Access the climate data from the Daymet database through its RESTful service.
Project description
Package |
Description |
Status |
|---|---|---|
Access NWIS, NID, HCDN 2009, NLCD, and SSEBop databases |
||
Send queries to any ArcGIS RESTful-, WMS-, and WFS-based services |
||
Convert responses from PyGeoOGC’s supported web services to datasets |
||
Navigate and subset NHDPlus (MR and HR) using web services |
||
Access topographic data through National Map’s 3DEP web service |
||
Access Daymet for daily climate data both single pixel and gridded |
PyDaymet: Daily climate data through Daymet


Features
PyNHD is part of a software stack for retrieving and processing hydrology and climatology datasets. This package provides an interface to access to daily climate data through the Daymet RESTful service. Both single pixel and gridded data can be requested which are returned as pandas.DataFrame and xarray.Dataset, respectively. Climate data is available for CONUS, Hawaii, and Puerto Rico. Additionally, PyDaymet can compute Potential EvapoTranspiration (PET) using UN-FAO 56 paper method for both single pixel and gridded data.
Note that starting from version 0.9.0, the recently released version of Daymet database is used. You can check the release information here Moreover, there’s a new function called get_bycoords that is an alternative to get_byloc for getting climate data at a single pixel. This new function uses THREDDS data server with NetCDF Subset Service (NCSS), and supports getting monthly and annual summaries directly from the server. You can pass time_scale as daily, monthly, or annual to get_bygeom or get_bycoords functions to download the respective summaries. get_bycoords will replace get_byloc in the future. So, please consider migrating your code by replacing get_byloc with get_bycoords. The input arguments of get_bycoords is identical to get_bygeom. Another difference between get_byloc and get_bycoords is column names where get_bycoords uses the units that are returned by NCSS server. Moreover, both get_bygeom and get_bycoords accept an additional argument called region for passing the region of interest.
You can try using PyDaymet without installing it on you system by clicking on the binder badge below the PyDaymet banner. A Jupyter notebook instance with the stack pre-installed will be launched in your web browser and you can start coding!
Please note that since this project is in early development stages, while the provided functionalities should be stable, changes in APIs are possible in new releases. But we appreciate it if you give this project a try and provide feedback. Contributions are most welcome.
Moreover, requests for additional functionalities can be submitted via issue tracker.
Installation
You can install PyDaymet using pip after installing libgdal on your system (for example, in Ubuntu run sudo apt install libgdal-dev):
$ pip install pydaymetAlternatively, PyDaymet can be installed from the conda-forge repository using Conda:
$ conda install -c conda-forge pydaymetQuick start
PyDaymet offers two functions for getting climate data; get_bycoords and get_bygeom. The arguments of these functions are identical except the first argument where the latter should be polygon and the former should be a coordinate (a tuple of length two as in (x, y)). The input geometry or coordinate can be in any valid CRS (defaults to EPSG:4326). The dates argument can be either a tuple of length two like (start_str, end_str) or a list of years like [2000, 2005]. It is noted that both functions have a pet flag for computing PET. Additionally, we can pass time_scale to get daily, monthly or annual summaries. This flag by default is set to daily.
from pynhd import NLDI
import pydaymet as daymet

geometry = NLDI().get_basins("01031500").geometry[0]

var = ["prcp", "tmin"]
dates = ("2000-01-01", "2000-06-30")

daily = daymet.get_bygeom(geometry, dates, variables=var, pet=True)
monthly = daymet.get_bygeom(geometry, dates, variables=var, time_scale="monthly")
If the input geometry (or coordinate) is in a CRS other than EPSG:4326, we should pass it to the functions.
coords = (-1431147.7928, 318483.4618)
crs = "epsg:3542"
dates = ("2000-01-01", "2006-12-31")
annual = daymet.get_bycoords(
    coords, dates, variables=var, loc_crs=crs, time_scale="annual"
)
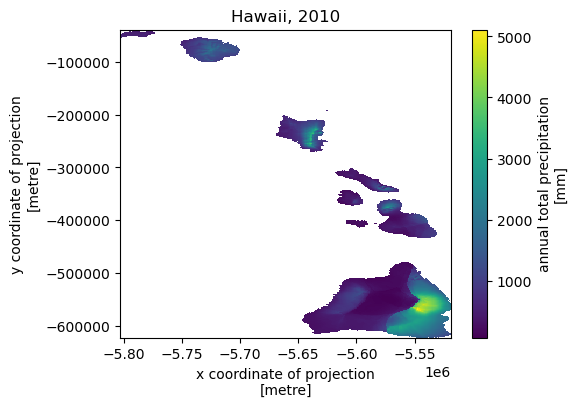
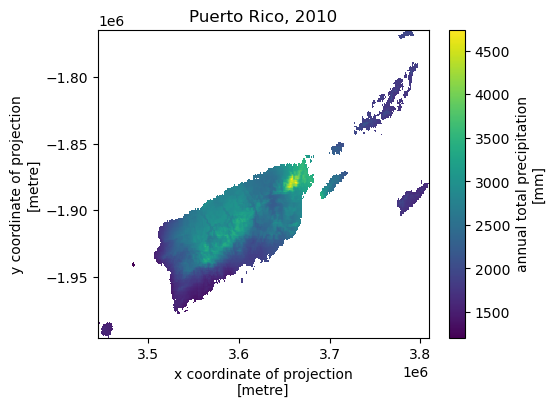
Next, let’s get annual total precipitation for Hawaii and Puerto Rico for 2010.
hi_ext = (-160.3055, 17.9539, -154.7715, 23.5186)
pr_ext = (-67.9927, 16.8443, -64.1195, 19.9381)
hi = daymet.get_bygeom(hi_ext, 2010, variables="prcp", region="hi", time_scale="annual")
pr = daymet.get_bygeom(pr_ext, 2010, variables="prcp", region="pr", time_scale="annual")
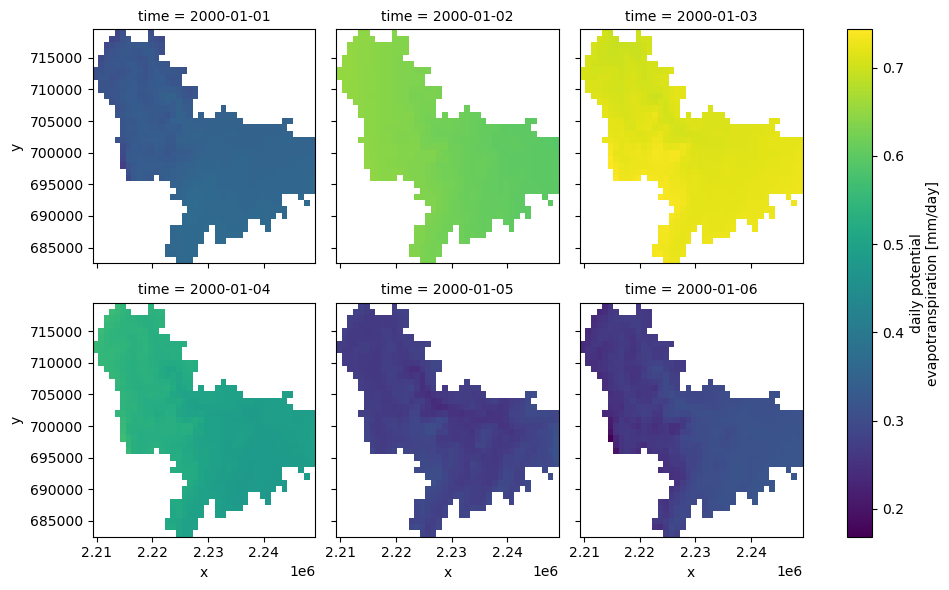
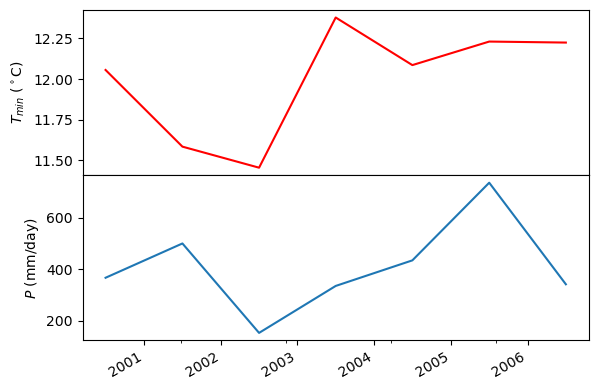
Some example plots are shown below:


Contributing
Contributions are very welcomed. Please read CONTRIBUTING.rst file for instructions.
Credits
Credits to Koen Hufkens for his implementation of accessing the Daymet RESTful service, daymetpy.
Project details
Release history Release notifications | RSS feed
Download files
Download the file for your platform. If you're not sure which to choose, learn more about installing packages.
Source Distribution
Built Distribution
Hashes for pydaymet-0.10.0-py2.py3-none-any.whl
| Algorithm | Hash digest | |
|---|---|---|
| SHA256 | a80344be7c5126b550d1382c8d411a1316f415821f17b585a3bde4b155af039a |
|
| MD5 | 4197d6e0f1d15d0821c5461cd6afb339 |
|
| BLAKE2b-256 | a12493597ea511c6cbdd4b8278f4f99bf9519cdc1739b55b0258d28befe9226a |


