Draw speciaized graphs using pyecharts

Project description


Latest version works with pyecharts 1.3.1+.
Please launch the binder to get an interactive jupyter notebook running.
1. Time Series Event
Usage of TimeYAxisDateXAxis:
import pyecharts.options as opts
from pyecharts_extras.date_time import TimeYAxisDateXAxis, DateAxisOpts, TimeAxisOpts
from datetime import datetime

data = [
   datetime(2020,9,1,3,11,11),
   ...
]

data2 = [
    datetime(2020,9,1,1,11,11),
    ...
]

chart = TimeYAxisDateXAxis(init_opts=opts.InitOpts(height="1000px"))
chart.set_global_opts(
         xaxis_opts=DateAxisOpts(axis_data=all_dates),
         yaxis_opts=TimeAxisOpts(),
         tooltip_opts=opts.TooltipOpts(is_show=False))
chart.add_data('A', data, symbol_size=10)
chart.add_data('B', data2, symbol_size=20)
chart.render_notebook()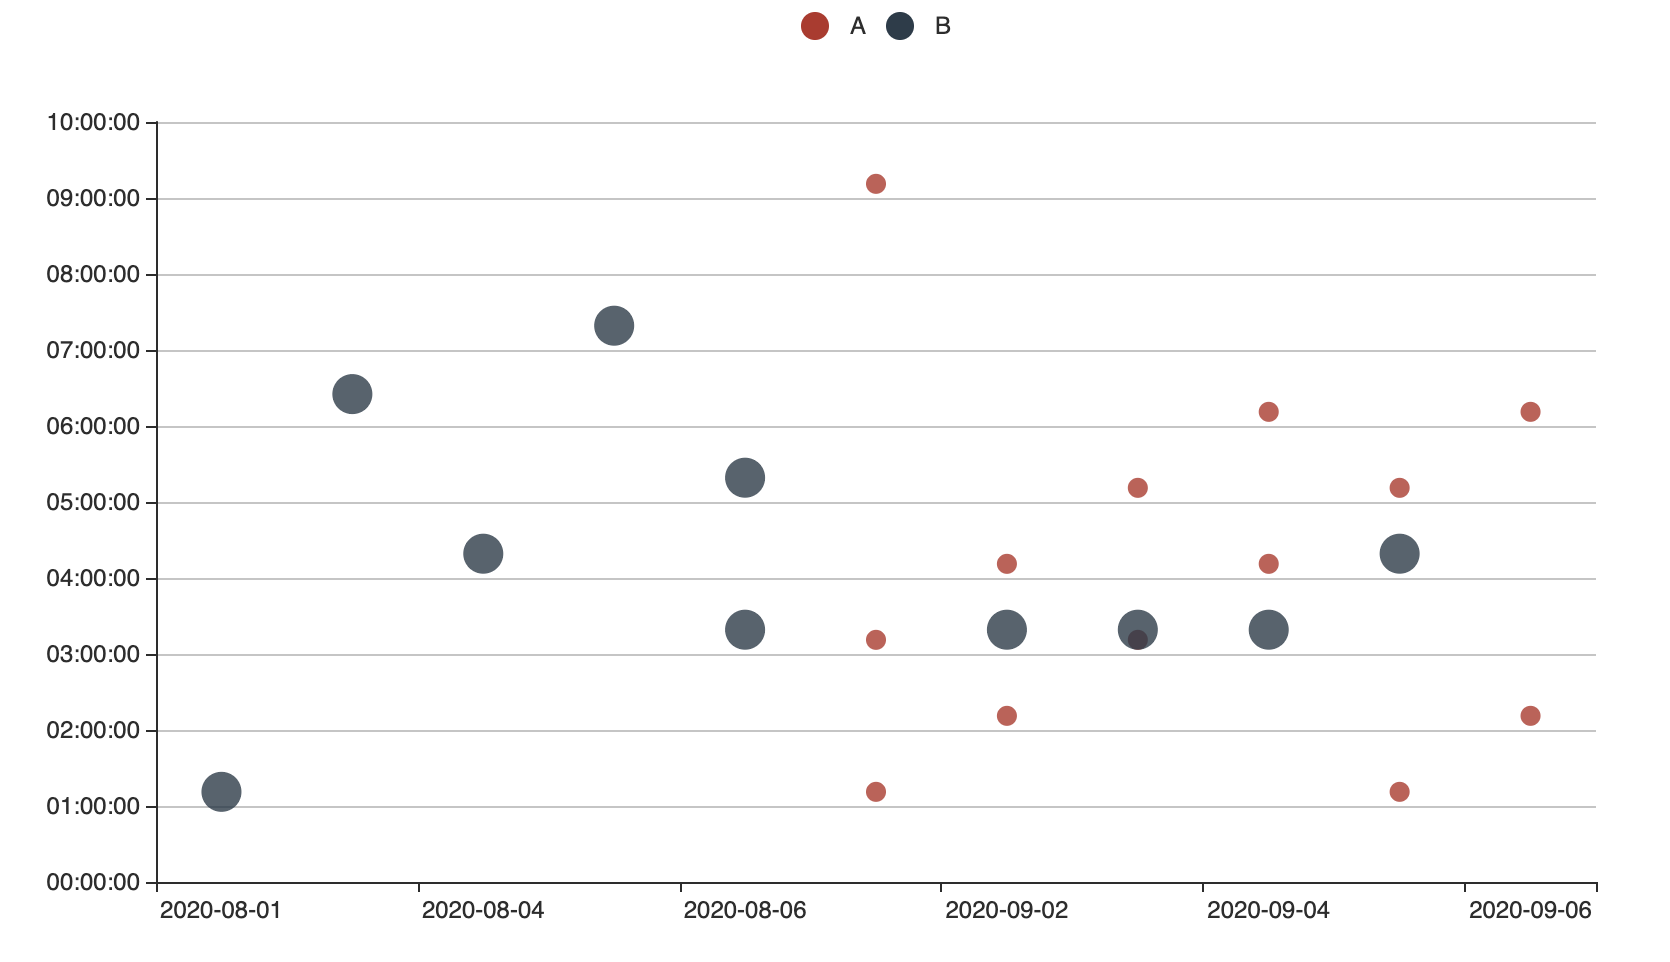
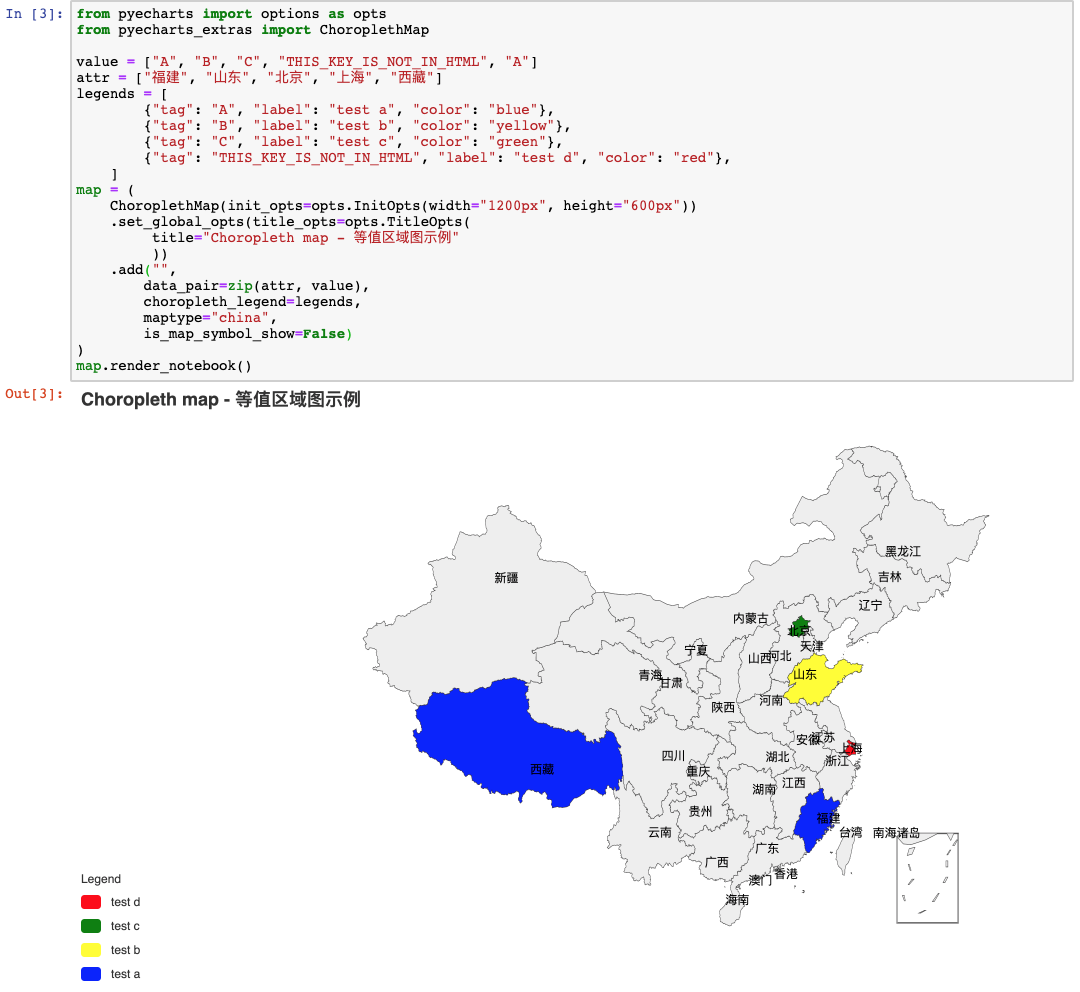
2. ChoroplethMap
Installation
You can install pyecharts-extras via pip:
$ pip install pyecharts-extrasor clone it and install it:
$ git clone https://github.com/pyecharts/pyecharts-extras.git
$ cd pyecharts-extras
$ python setup.py install
Change log
0.0.5 - 12.09.2020
Fixed
time date scatter plot failed to display different sets of data
0.0.4 - 06.09.2020
Added
it scatters event over time vs date chart so as to spot patterns in events.
0.0.3 - 15.07.2019
Updated
it use pyecharts 1.3 to draw ChoroplethMap
0.0.2 - 09.06.2019
Updated
it use pyecharts 1.x to draw ChoroplethMap
0.0.1 - 17.04.2019
first release
it draws ChoroplethMap


Download files
Download the file for your platform. If you're not sure which to choose, learn more about installing packages.
Source Distribution
Built Distribution
Filter files by name, interpreter, ABI, and platform.
If you're not sure about the file name format, learn more about wheel file names.
Copy a direct link to the current filters
File details
Details for the file pyecharts-extras-0.0.5.tar.gz.
File metadata
- Download URL: pyecharts-extras-0.0.5.tar.gz
- Upload date:
- Size: 6.8 kB
- Tags: Source
- Uploaded using Trusted Publishing? No
- Uploaded via: twine/3.2.0 pkginfo/1.5.0.1 requests/2.24.0 setuptools/47.1.0 requests-toolbelt/0.9.1 tqdm/4.48.2 CPython/3.8.5
File hashes
| Algorithm | Hash digest | |
|---|---|---|
| SHA256 |
6123feb7fd7f776290db0e524a2feedc66f0fd60e2fa0ea24544b30b1233dea1
|
|
| MD5 |
96efdd32f5c9089ca4ee74d3dc6174f3
|
|
| BLAKE2b-256 |
1159e36b8ceca4d7a68ca32de8f0c49c72455e5a153971d84c50320e52e4ae8e
|
File details
Details for the file pyecharts_extras-0.0.5-py2.py3-none-any.whl.
File metadata
- Download URL: pyecharts_extras-0.0.5-py2.py3-none-any.whl
- Upload date:
- Size: 5.5 kB
- Tags: Python 2, Python 3
- Uploaded using Trusted Publishing? No
- Uploaded via: twine/3.2.0 pkginfo/1.5.0.1 requests/2.24.0 setuptools/47.1.0 requests-toolbelt/0.9.1 tqdm/4.48.2 CPython/3.8.5
File hashes
| Algorithm | Hash digest | |
|---|---|---|
| SHA256 |
1f66360d2cde3cb0ec54089f4ce3371cfb15716b5585048b18240af250320777
|
|
| MD5 |
847356ceaf0231bf8d2f9fbc2e35bca4
|
|
| BLAKE2b-256 |
04469e1d6ddefdbafdbd73900666208d45b635e3d555d1bba12f3951fdf6f813
|


