
PyG2Plot
🎨 Python3 binding for
@AntV/G2Plotwhich an interactive and responsive charting library. Based on the grammar of graphics, you can easily make superior statistical charts through a few lines of code.PyG2Plotis inspired by pyecharts.



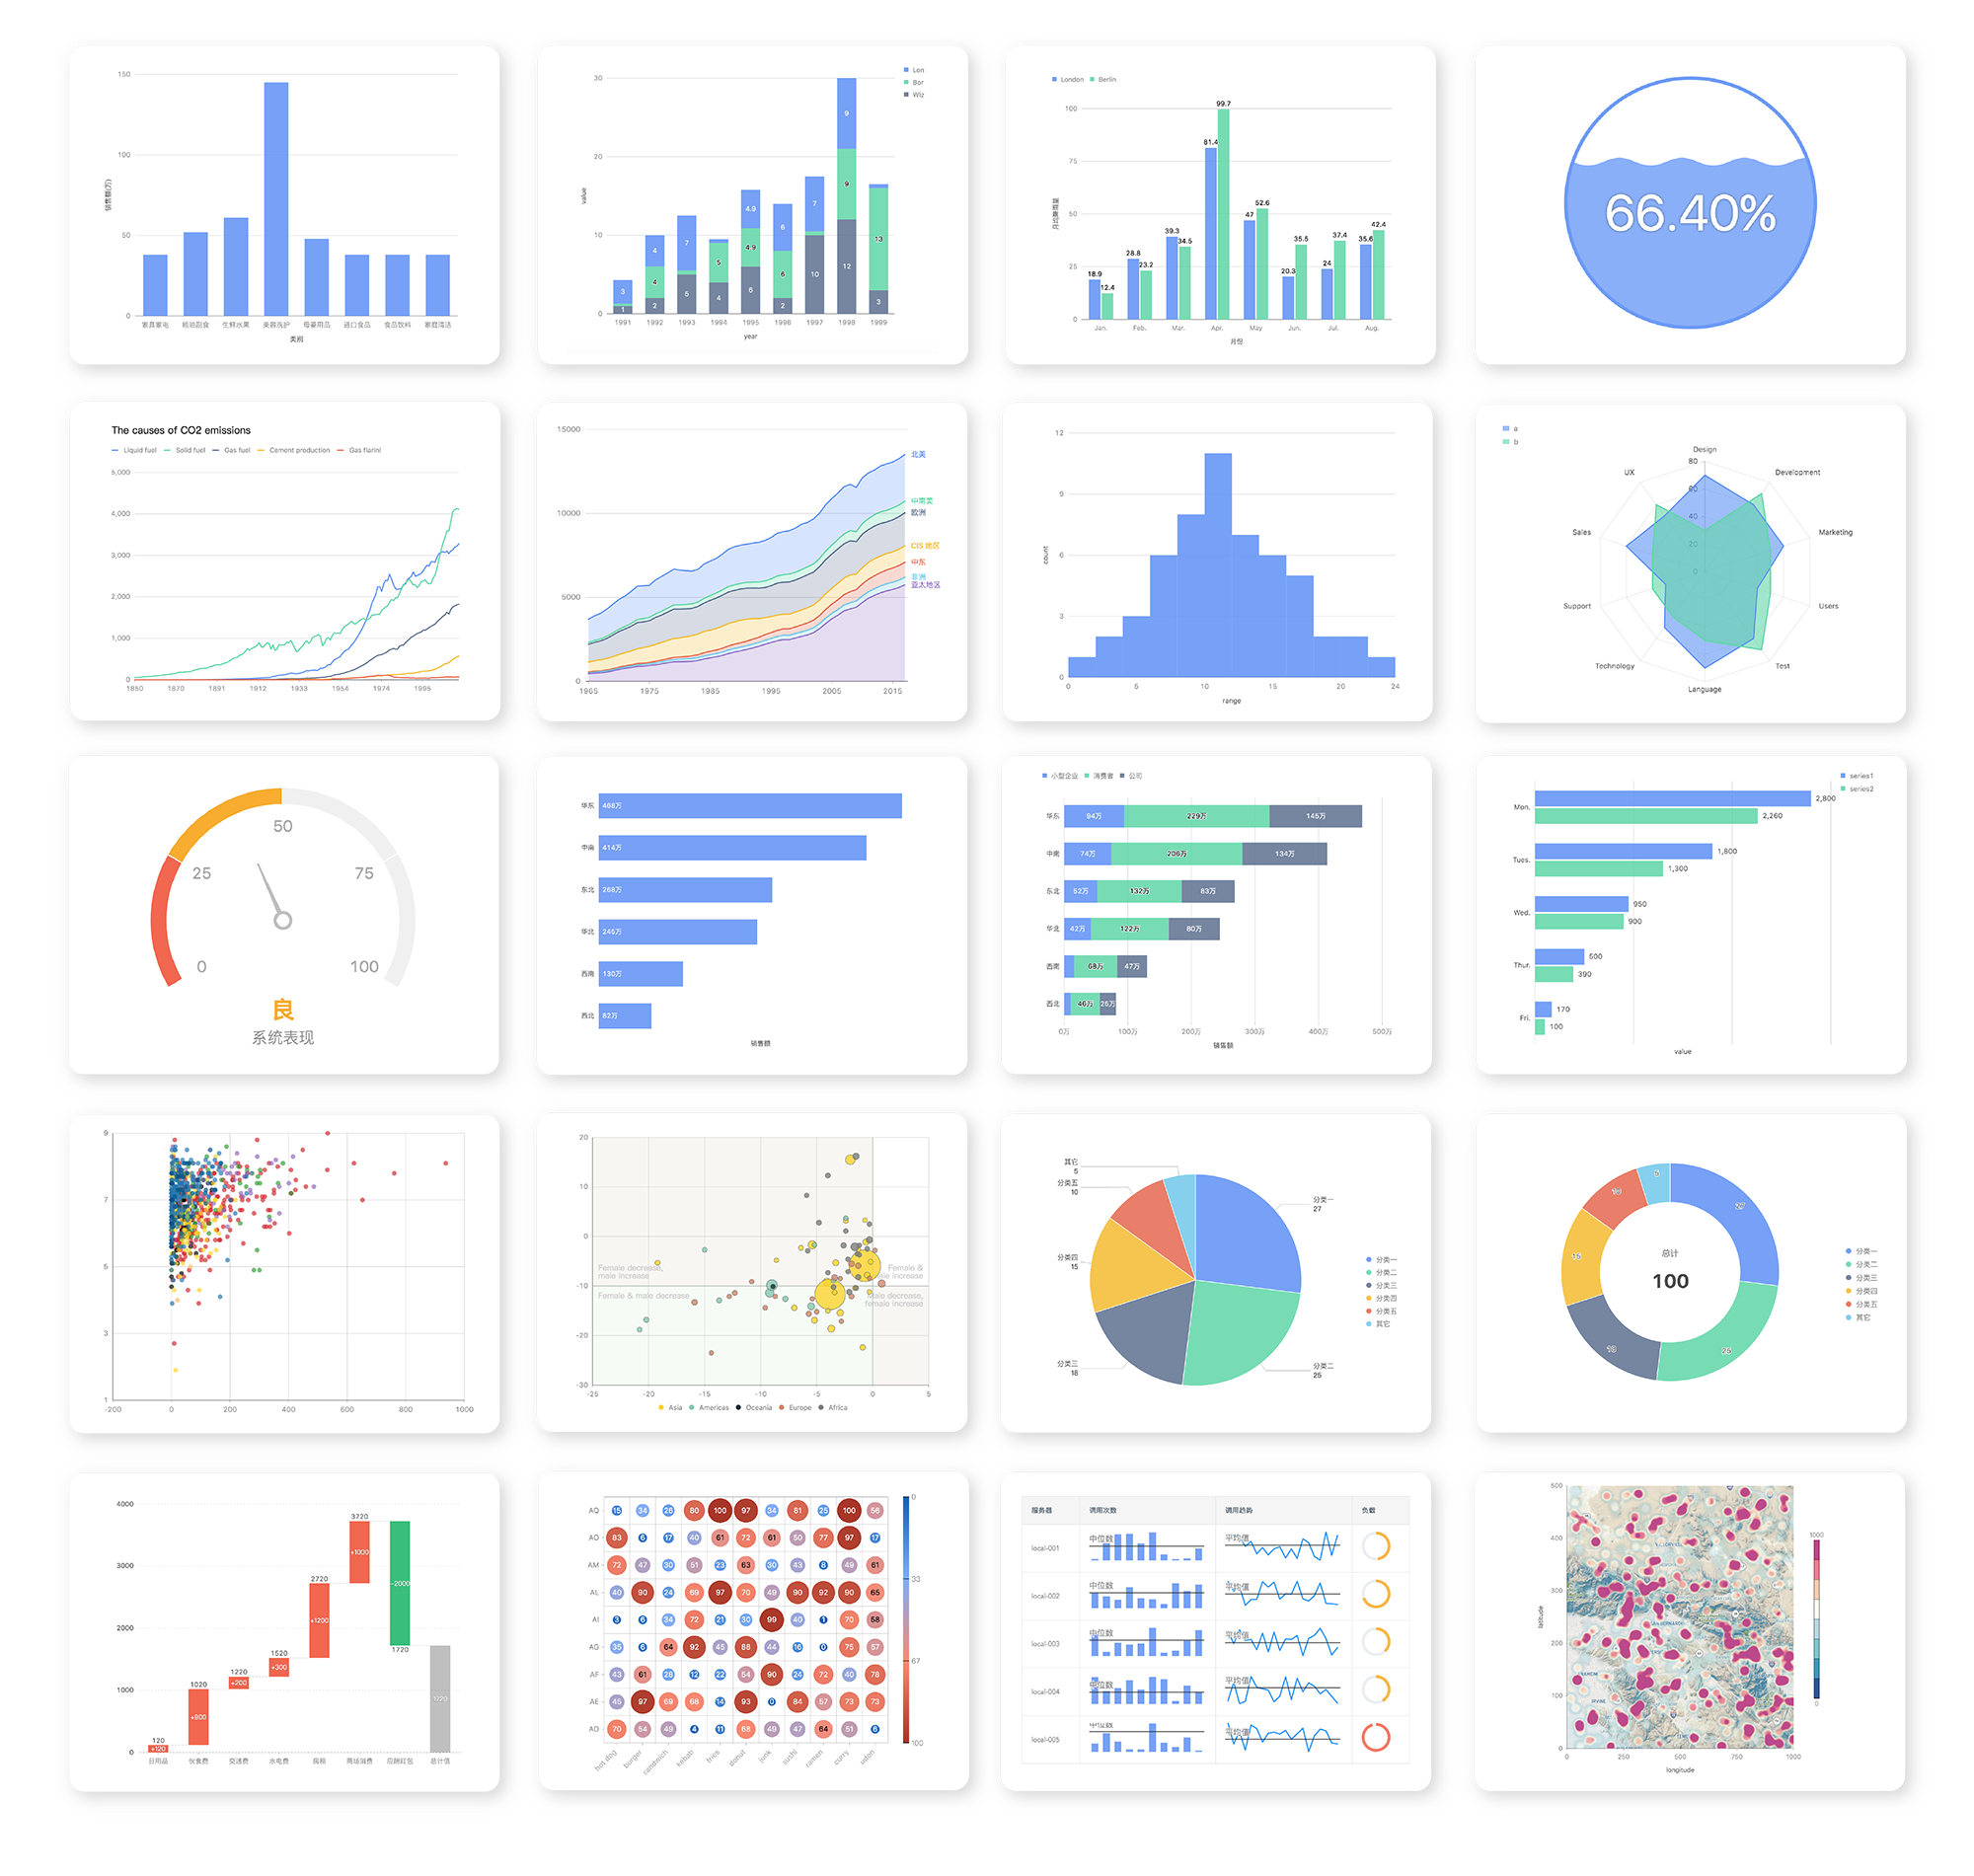
Document: 中文说明文档 · Drawing statistical plots · In Jupyter Notebook · Principles
Installation
$ pip install pyg2plot
Usage
render HTML
from pyg2plot import Plot

line = Plot("Line")

line.set_options({
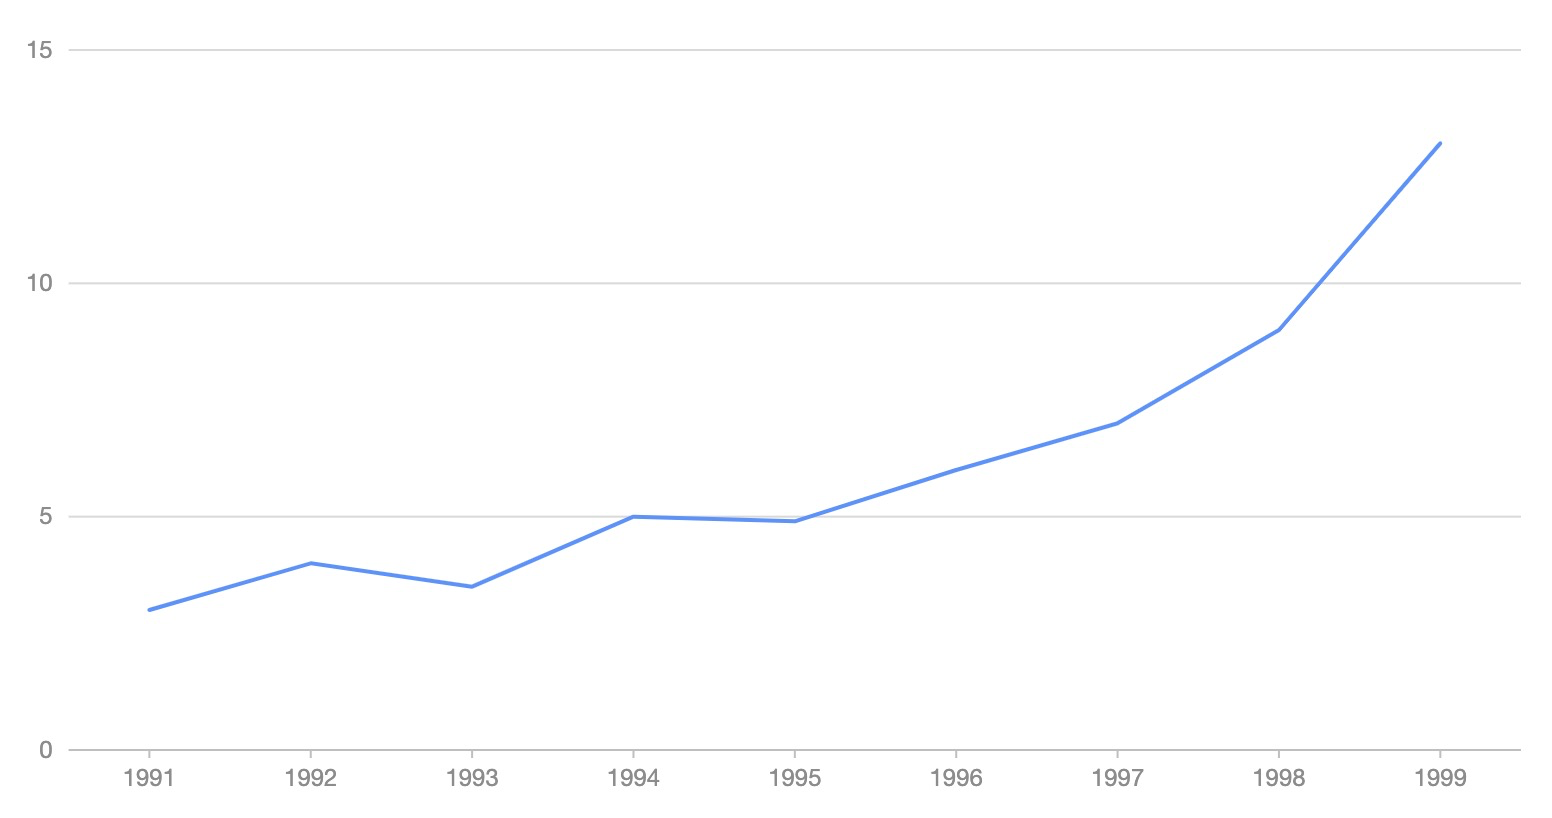
  "data": [
    { "year": "1991", "value": 3 },
    { "year": "1992", "value": 4 },
    { "year": "1993", "value": 3.5 },
    { "year": "1994", "value": 5 },
    { "year": "1995", "value": 4.9 },
    { "year": "1996", "value": 6 },
    { "year": "1997", "value": 7 },
    { "year": "1998", "value": 9 },
    { "year": "1999", "value": 13 },
  ],
  "xField": "year",
  "yField": "value",
})

# 1. render html file
line.render("plot.html")
# 2. render html string
line.render_html()
render Jupyter
from pyg2plot import Plot

line = Plot("Line")

line.set_options({
  "height": 400, # set a default height in jupyter preview
  "data": [
    { "year": "1991", "value": 3 },
    { "year": "1992", "value": 4 },
    { "year": "1993", "value": 3.5 },
    { "year": "1994", "value": 5 },
    { "year": "1995", "value": 4.9 },
    { "year": "1996", "value": 6 },
    { "year": "1997", "value": 7 },
    { "year": "1998", "value": 9 },
    { "year": "1999", "value": 13 },
  ],
  "xField": "year",
  "yField": "value",
})

# 1. render in notebook
line.render_notebook()

# 2. render in jupyter lab
line.render_jupyter_lab()
use JavaScript callback
from pyg2plot import Plot, JS

line = Plot("Line")

line.set_options({
  "height": 400, # set a default height in jupyter preview
  "data": [
    { "year": "1991", "value": 3 },
    { "year": "1992", "value": 4 },
    { "year": "1993", "value": 3.5 },
    { "year": "1994", "value": 5 },
    { "year": "1995", "value": 4.9 },
    { "year": "1996", "value": 6 },
    { "year": "1997", "value": 7 },
    { "year": "1998", "value": 9 },
    { "year": "1999", "value": 13 },
  ],
  "xField": "year",
  "yField": "value",
  "lineStye": JS('''function() {
    return { stroke: 'red' };
  }''')
})
Use JS API, you can use JavaScript syntax for callback.
API
Now, only has one API of pyg2plot.
- Plot
-
Plot(plot_type: str): get an instance of
Plotclass. -
plot.set_options(options: object): set the options of G2Plot into instance.
-
plot.render(path, env, **kwargs): render out html file by setting the path, jinja2 env and kwargs.
-
plot.render_notebook(env, **kwargs): render plot on jupyter preview.
-
plot.render_jupyter_lab(env, **kwargs): render plot on jupyter lab preview.
-
plot.render_html(env, **kwargs): render out html string by setting jinja2 env and kwargs.
-
plot.dump_js_options(env, **kwargs): dump js options by setting jinja2 env and kwargs, use it for HTTP request.
More apis is on the way.
License
MIT@hustcc.
1 maintainer

Metadata
1 maintainer
Release files for pyg2plot 0.1.8
For a detailed explanation of source distributions (sdists) and built distributions (wheels), please see the package formats documentation.
Built distribution (wheel)
| File | Interpreter | ABI | Platform | Reset |
|---|---|---|---|---|
| pyg2plot-0.1.8-py3-none-any.whl | Python 3 | none | any | Details |
Release files / pyg2plot-0.1.8-py3-none-any.whl
| Download URL | pyg2plot-0.1.8-py3-none-any.whl |
|---|---|
| Size | 8.5 kB |
| Tags | Python 3 |
|
SHA-256 checksum How to use checksums |
d1633dfd7fc0adac49549aea58bcdb5f0cc694181536ccc95f8700d45df312e7
|
|
BLAKE2b-256 checksum How to use checksums |
62649df0ac398660d170c08d668fc565ddbd0c21ae94d63f9936e14bd898773b
|
| Upload date | |
|
Uploaded using Trusted Publishing? What is trusted publishing? |
No |
| Uploaded via |
twine/3.3.0 pkginfo/1.6.1 requests/2.25.1 setuptools/49.2.1 requests-toolbelt/0.9.1 tqdm/4.56.0 CPython/3.9.1
|














