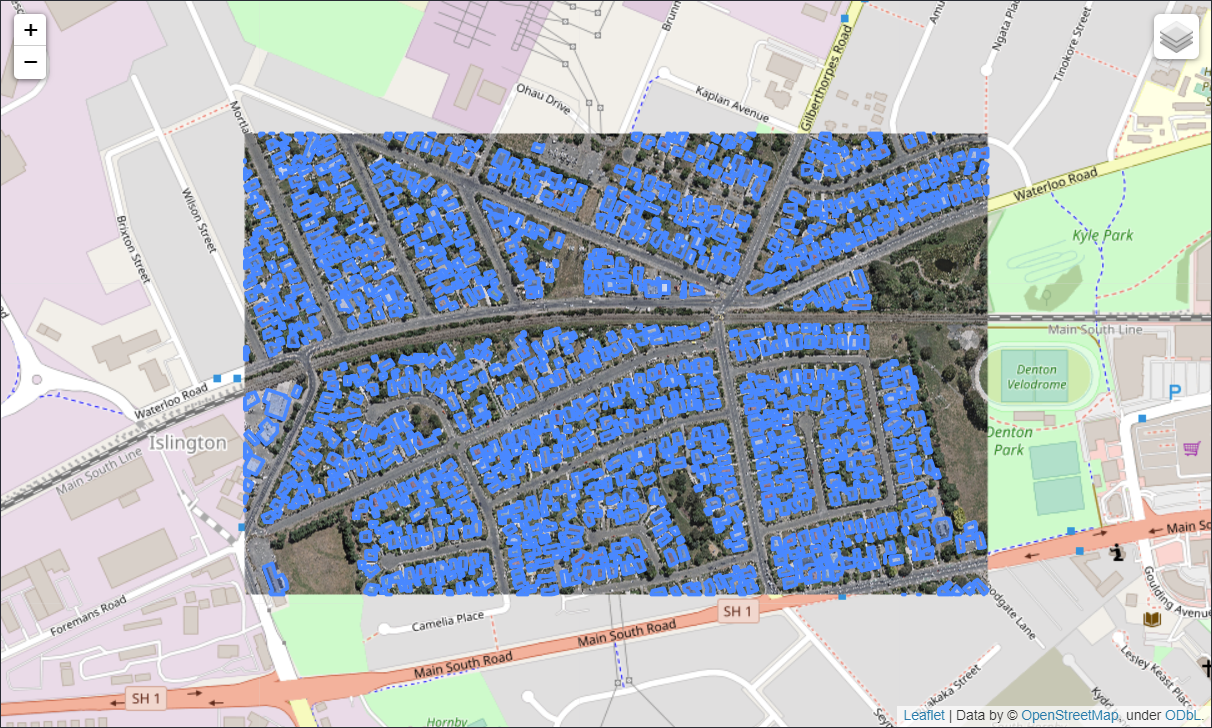
Visualize geo-tiff/json based on folium.
Project description
pyGEOVis
Visualize geo-tiff/json based on folium. It can be used to visualize geo-data (geotiff/geojson) after ML/DL about RS.
USE
The class named Geovis just have three functions.Useing addRaster to add a image with geo-info (like geotiff) to the map and useing addVector to add a vector (just support geojson with polygon or multipolygon) to the map. In the end, useing show to show this interactive map.
from pygeovis import Geovis

viser = Geovis()
viser.addRaster("data/val.tif", band_list=[1, 2, 3])
viser.addVector("data/val.geojson")
viser.show()
Project details
Release history Release notifications | RSS feed
Download files
Download the file for your platform. If you're not sure which to choose, learn more about installing packages.
Source Distributions
No source distribution files available for this release.See tutorial on generating distribution archives.


