
Mixture fitting library
pymixfit is a Python mixture fitting library. This library tries
to fit a variety of candidate functions to presented measurement data
to extract the different components that make up the sampled data
points. This may be used to identify different mechanisms that contribute
to formation of data.
This library is based on fitting capabilities of lmfit.
The whole idea of mixture fitting and fitting sums using least squares is built on the ideas of
- Fitting mixtures of statistical distributions
- Bundle adjustment methods in engineering photogrammetry
Installation
pip install pymixfit-tspspi
Currently implemented model functions
- Constant (
mixfitfunctions.constant.MixfitFunctionConstantFactory)- $f(x) = \text{offset}$
- Linear (
mixfitfunctions.linear.MixfitFunctionLinearFactory)- $f(x) = \text{slope} * x + \text{intercept}$
- Gaussian (
mixfitfunctions.gaussian.MixfitFunctionGaussianFactory)- $f(x) = \text{amp} * \frac{1}{\sqrt{2 \pi}} e^{- \frac{1}{2} \left(\frac{x-\mu}{\sigma}\right)^2} + \text{offset}$
- Differential Gaussian (
mixfitfunctions.differentialgaussian.MixfitFunctionDifferentialGaussian) - Cauchy / Lorentz (
mixfitfunctions.cauchy.MixfitFunctionCauchyFactory) - Differential Cauchy / Lorentz (
mixfitfunctions.cauchy.MixfitFunctionDifferentialCauchyFactory)
By default all functions are used as candidate functions by the mixture fitter
Usage
To use the mixture fitter simply instantiate the Mixfit class and
perform a fit function. It's a good idea to apply one of the abort
conditions, else the fitter only aborts when it reaches the point of no
further improvements. Possible abort conditions are:
stopErroris the improvement of the $\chi^2$. As soon as the fit quality of the fit goes below the threashold the process is abortedmaxIterationslimits the number of components that are fit
One may supply a list of allowed functions as well as their limits using
the allowed argument:
Example
For more advanced examples take a look at the examples directory.
Fitting arbitrary models into our data
import numpy as np
import matplotlib.pyplot as plt

from mixfit.mixfit import Mixfit

data = np.load("examplefile.npz")

# Just a way to get the sample data
# This data includes different runs capturing
# in-phase and quadrature channels during
# frequency sweeps. The x axis is the frequencies,
# the fitted data is the mean of all runs
x = data["f_RF"]
I = data["sigI"].mean(1)

# Now create the mixture fitter for _all_
# models
mf = Mixfit(
	maxIterations = 4,
	stopError = 0.05
)

# And execute
resI = mf.fit(x, I)

# Plot
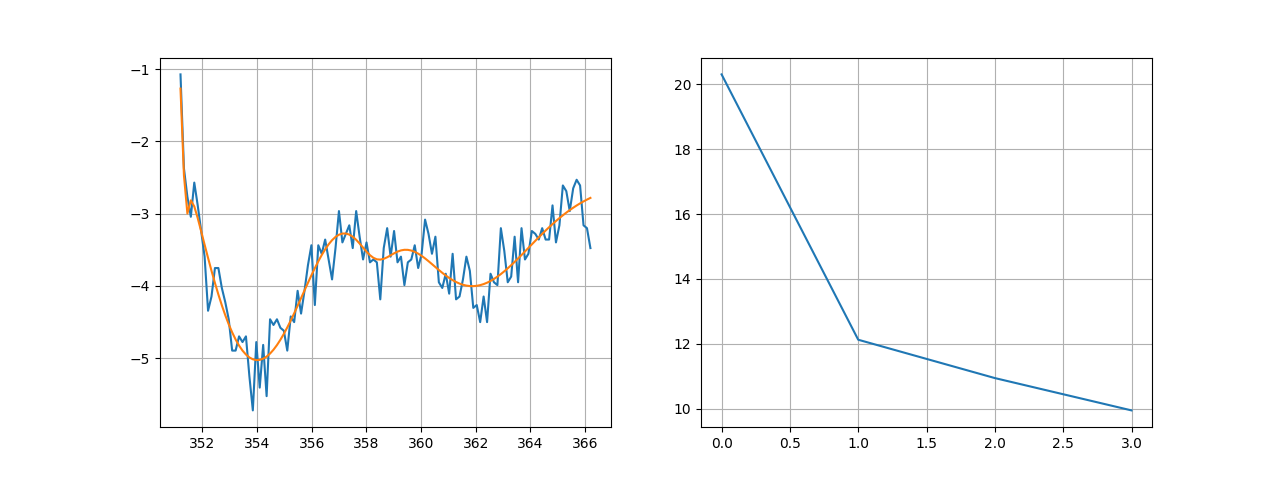
fig, ax = plt.subplots(1, 2, figsize=(6.4*2, 4.8))
ax[0].plot(x*2, I) # We plot raw data
ax[0].plot(x*2, resI(x)) # and our fit result
ax[0].grid()

ax[1].plot(resI._chis)
ax[1].grid()

plt.show()
Running this code yields the following decomposition:
DiffGaussian(amp=6.710041629819328+-4.470775516222519, mu=175.76446887225788+-0.1454700003529027, sigma=1.4076661399565236+-0.3343414565050647, offset=-23320382.44684337+-112828498842278.73)
DiffGaussian(amp=2.774258665757228+-1.4958867327164893, mu=179.76706853968935+-0.4050248108850253, sigma=1.2976513505933047+-0.3279503072202676, offset=17745816.52197658+-175430109563261.66)
Cauchy(amp=-2.7037880990536274+-3.5613251200337626, x0=179.17057600546437+-0.08406908277066111, gamma=0.6377217109551133+-0.3774710838448468, offset=5574563.378103231+-166637348925010.78)
DiffCauchy(amp=0.01760683178016082+-0.03633273296203317, x0=175.6555822822984+-0.028894691836587848, gamma=0.06706371066814047+-0.12080936119483864, offset=0.002912072266518264+-4552116.210404506)
1 maintainer

Metadata
1 maintainer
Release files for pymixfit-tspspi 0.0.1
For a detailed explanation of source distributions (sdists) and built distributions (wheels), please see the package formats documentation.
Source distribution (sdist)
| File | Size | Uploaded | |
|---|---|---|---|
| pymixfit_tspspi-0.0.1.tar.gz | 11.8 kB | Details |
Built distribution (wheel)
| File | Interpreter | ABI | Platform | Reset |
|---|---|---|---|---|
| pymixfit_tspspi-0.0.1-py3-none-any.whl | Python 3 | none | any | Details |
Total release size: 26.1 kB
Release files / pymixfit_tspspi-0.0.1.tar.gz
| Download URL | pymixfit_tspspi-0.0.1.tar.gz |
|---|---|
| Size | 11.8 kB |
| Tags | Source |
|
SHA-256 checksum How to use checksums |
b7b388dd203140177703eaafa2c921147e1f5e17aff489fd26e3749d586cb874
|
|
BLAKE2b-256 checksum How to use checksums |
23a0e3a6f5b3691cfc9c5aedf6f11cf9e806c40966a7250216a684ea62fdf90c
|
| Upload date | |
|
Uploaded using Trusted Publishing? What is trusted publishing? |
No |
| Uploaded via |
twine/5.0.0 CPython/3.8.13
|
Release files / pymixfit_tspspi-0.0.1-py3-none-any.whl
| Download URL | pymixfit_tspspi-0.0.1-py3-none-any.whl |
|---|---|
| Size | 14.3 kB |
| Tags | Python 3 |
|
SHA-256 checksum How to use checksums |
37d18c4f1ca9ac7a4f712c23457a089a881d561b22b0cbca31feb434dc421c71
|
|
BLAKE2b-256 checksum How to use checksums |
38d1d6f3692d8ae95c23be550f2bcd65baf7d510a5d738b297d8781a60fbec56
|
| Upload date | |
|
Uploaded using Trusted Publishing? What is trusted publishing? |
No |
| Uploaded via |
twine/5.0.0 CPython/3.8.13
|













