A dependency-free large (+2500) collection of colormaps and palettes for Python.
Verified details
These details have been verified by PyPIProject links
GitHub Statistics
Maintainers

Project description
PyPalettes
A dependency-free large (+2500) collection of colormaps and palettes for Python.
- All available palettes can be found in the Color Palette Finder.
- To learn more about how to use
pypalettes, please refer to the official documentation.


This package is based on the R package paletteer, and all associated sub-packages (with original palettes) mentioned in the LICENSE file.
Installation
With pip:
pip install pypalettes
With conda:
conda install conda-forge::pypalettes
Quick start
pypalettes primarly offers 2 functions:
load_palette("palette_name"): loads a list of colors (dependency-free)load_cmap("palette_name"): loads a colormap object (for matplotlib/seaborn/etc)
Continuous colormap for matplotlib/seaborn
import matplotlib.pyplot as plt
import numpy as np
from pypalettes import load_cmap

cmap = load_cmap("Sunset2", cmap_type="continuous")

data = np.random.randn(20, 20)

plt.imshow(data, cmap=cmap)
plt.colorbar()

Categorical palette
import matplotlib.pyplot as plt
import seaborn as sns
from pypalettes import load_palette

palette = load_palette("Fun")

df = sns.load_dataset("penguins")

g = sns.lmplot(
    data=df,
    x="bill_length_mm",
    y="bill_depth_mm",
    hue="species",
    palette=palette,
)

Your own colormap for matplotlib/seaborn
import matplotlib.pyplot as plt
from pypalettes import create_cmap
import numpy as np

cmap = create_cmap(
    colors=["#D57A6DFF", "#E8B762FF", "#9CCDDFFF", "#525052FF"],
    cmap_type="continuous",
)

x = np.linspace(0, 20, 1000)
y = np.sin(x)

plt.scatter(x, y, c=y, cmap=cmap)
plt.colorbar()

Features
- Add +2500 native palettes to matplotlib and seaborn
- Load, customise and combine +2500 palettes
- Create your own palettes
To find out more about using PyPalettes, use this PyPalettes guide.
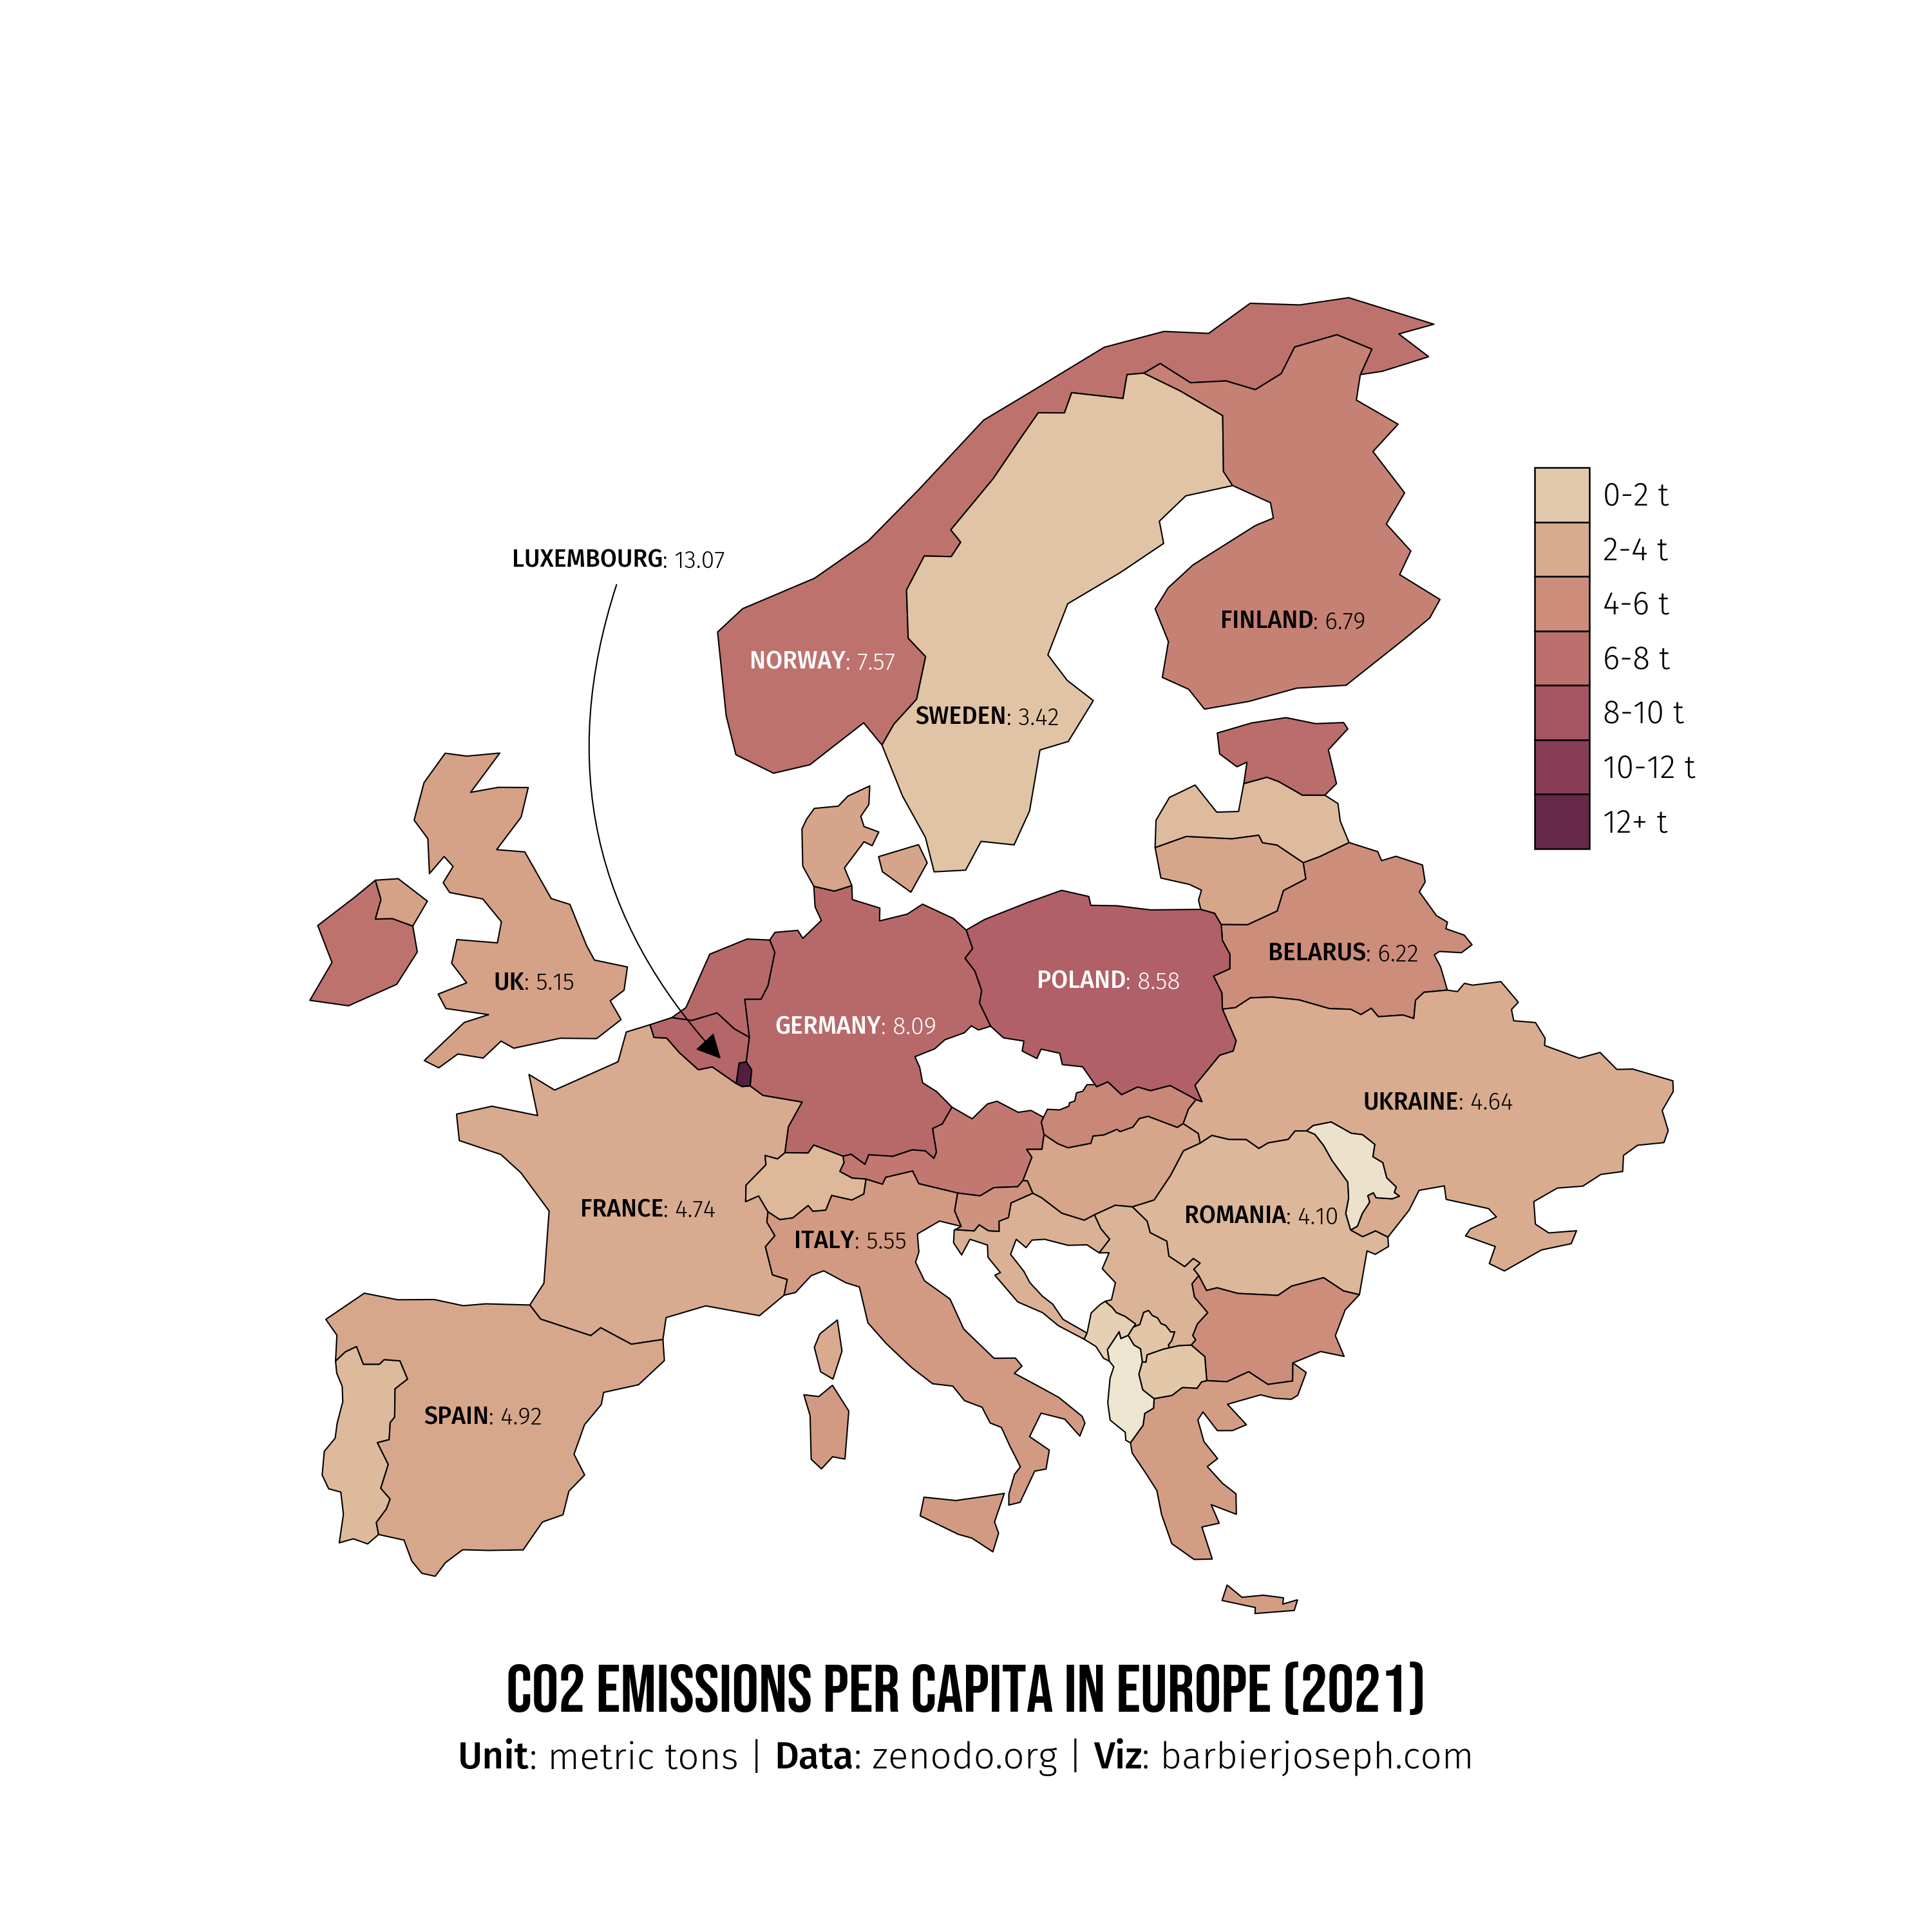
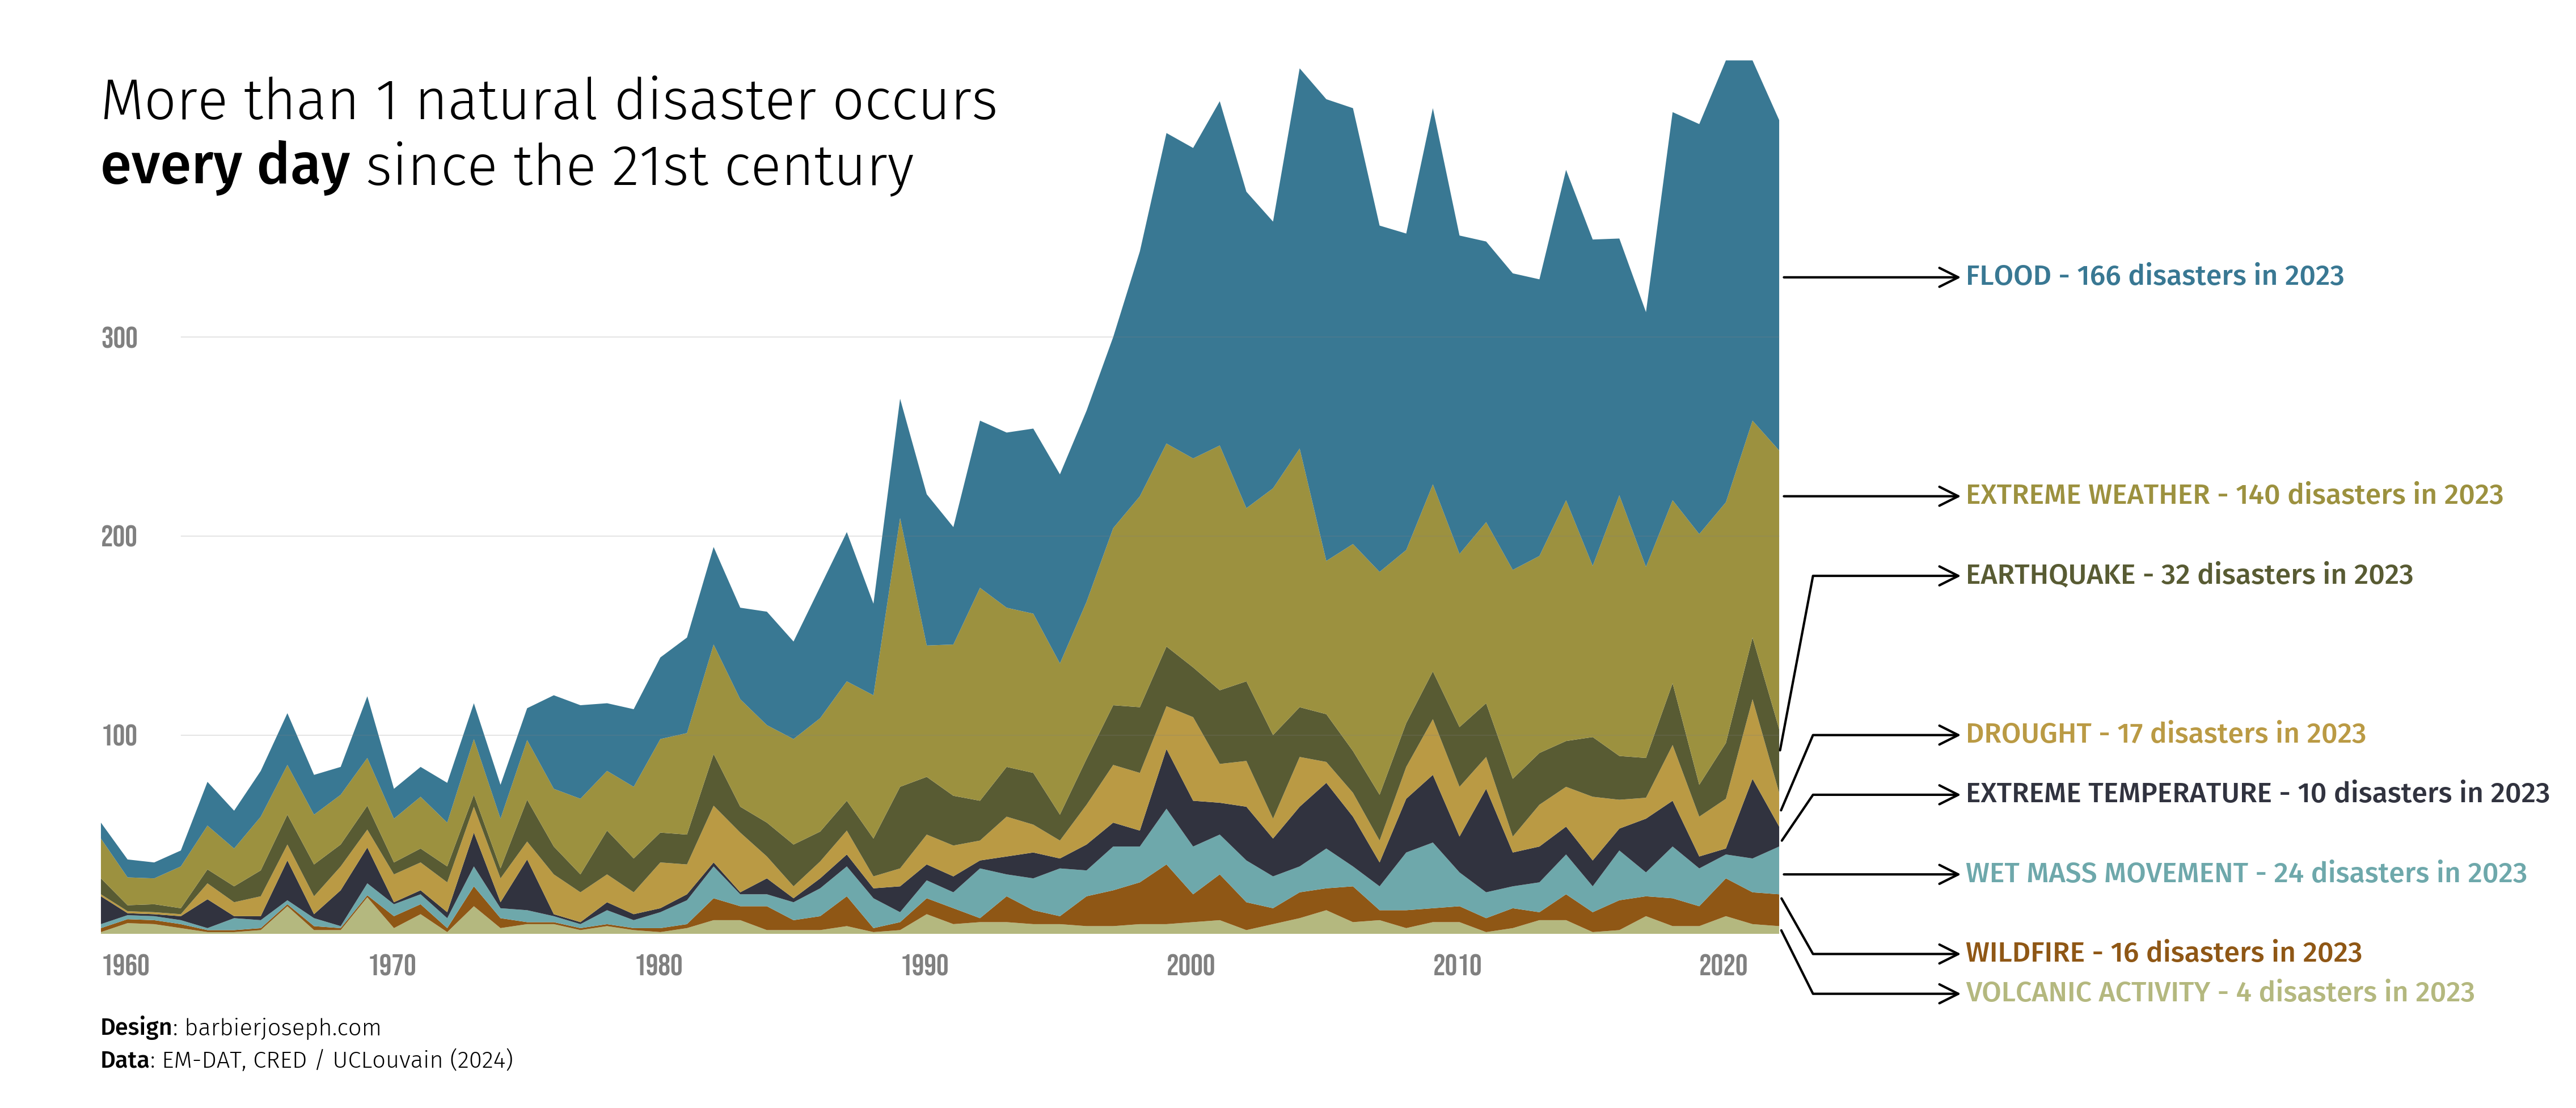
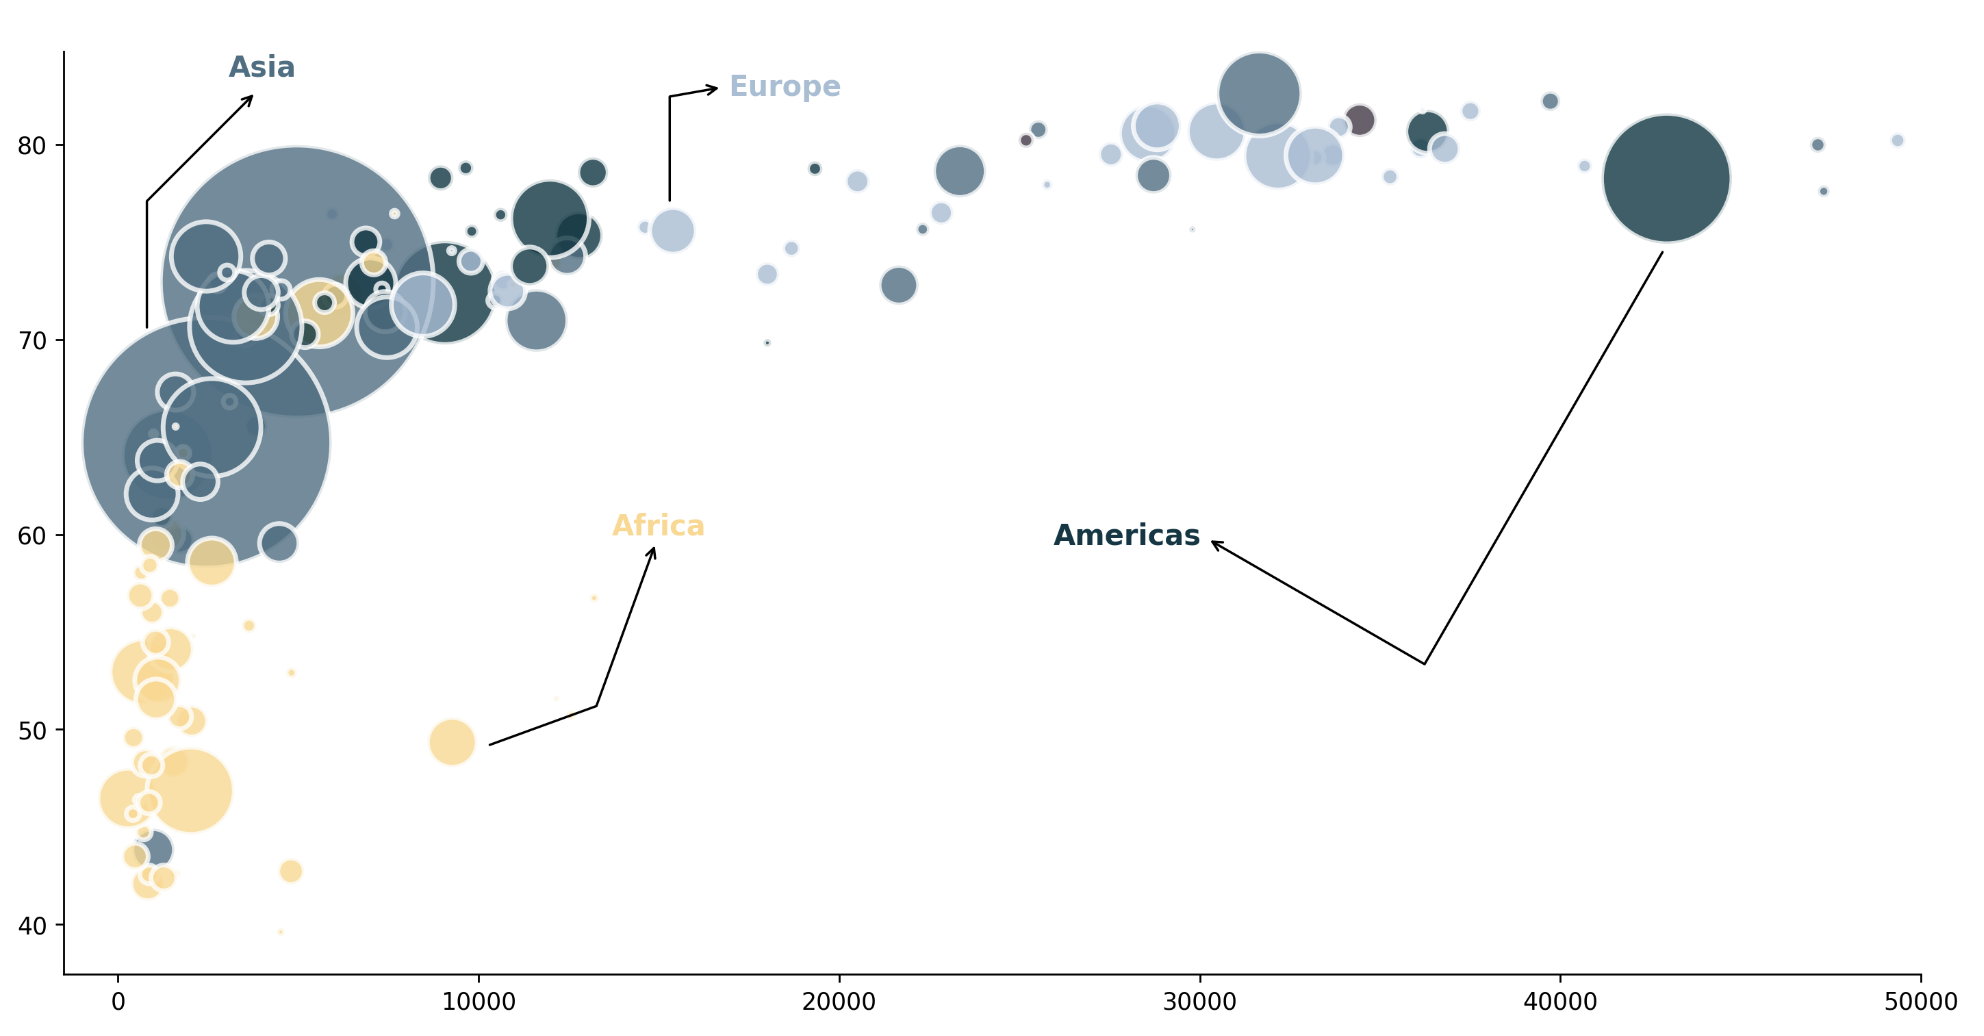
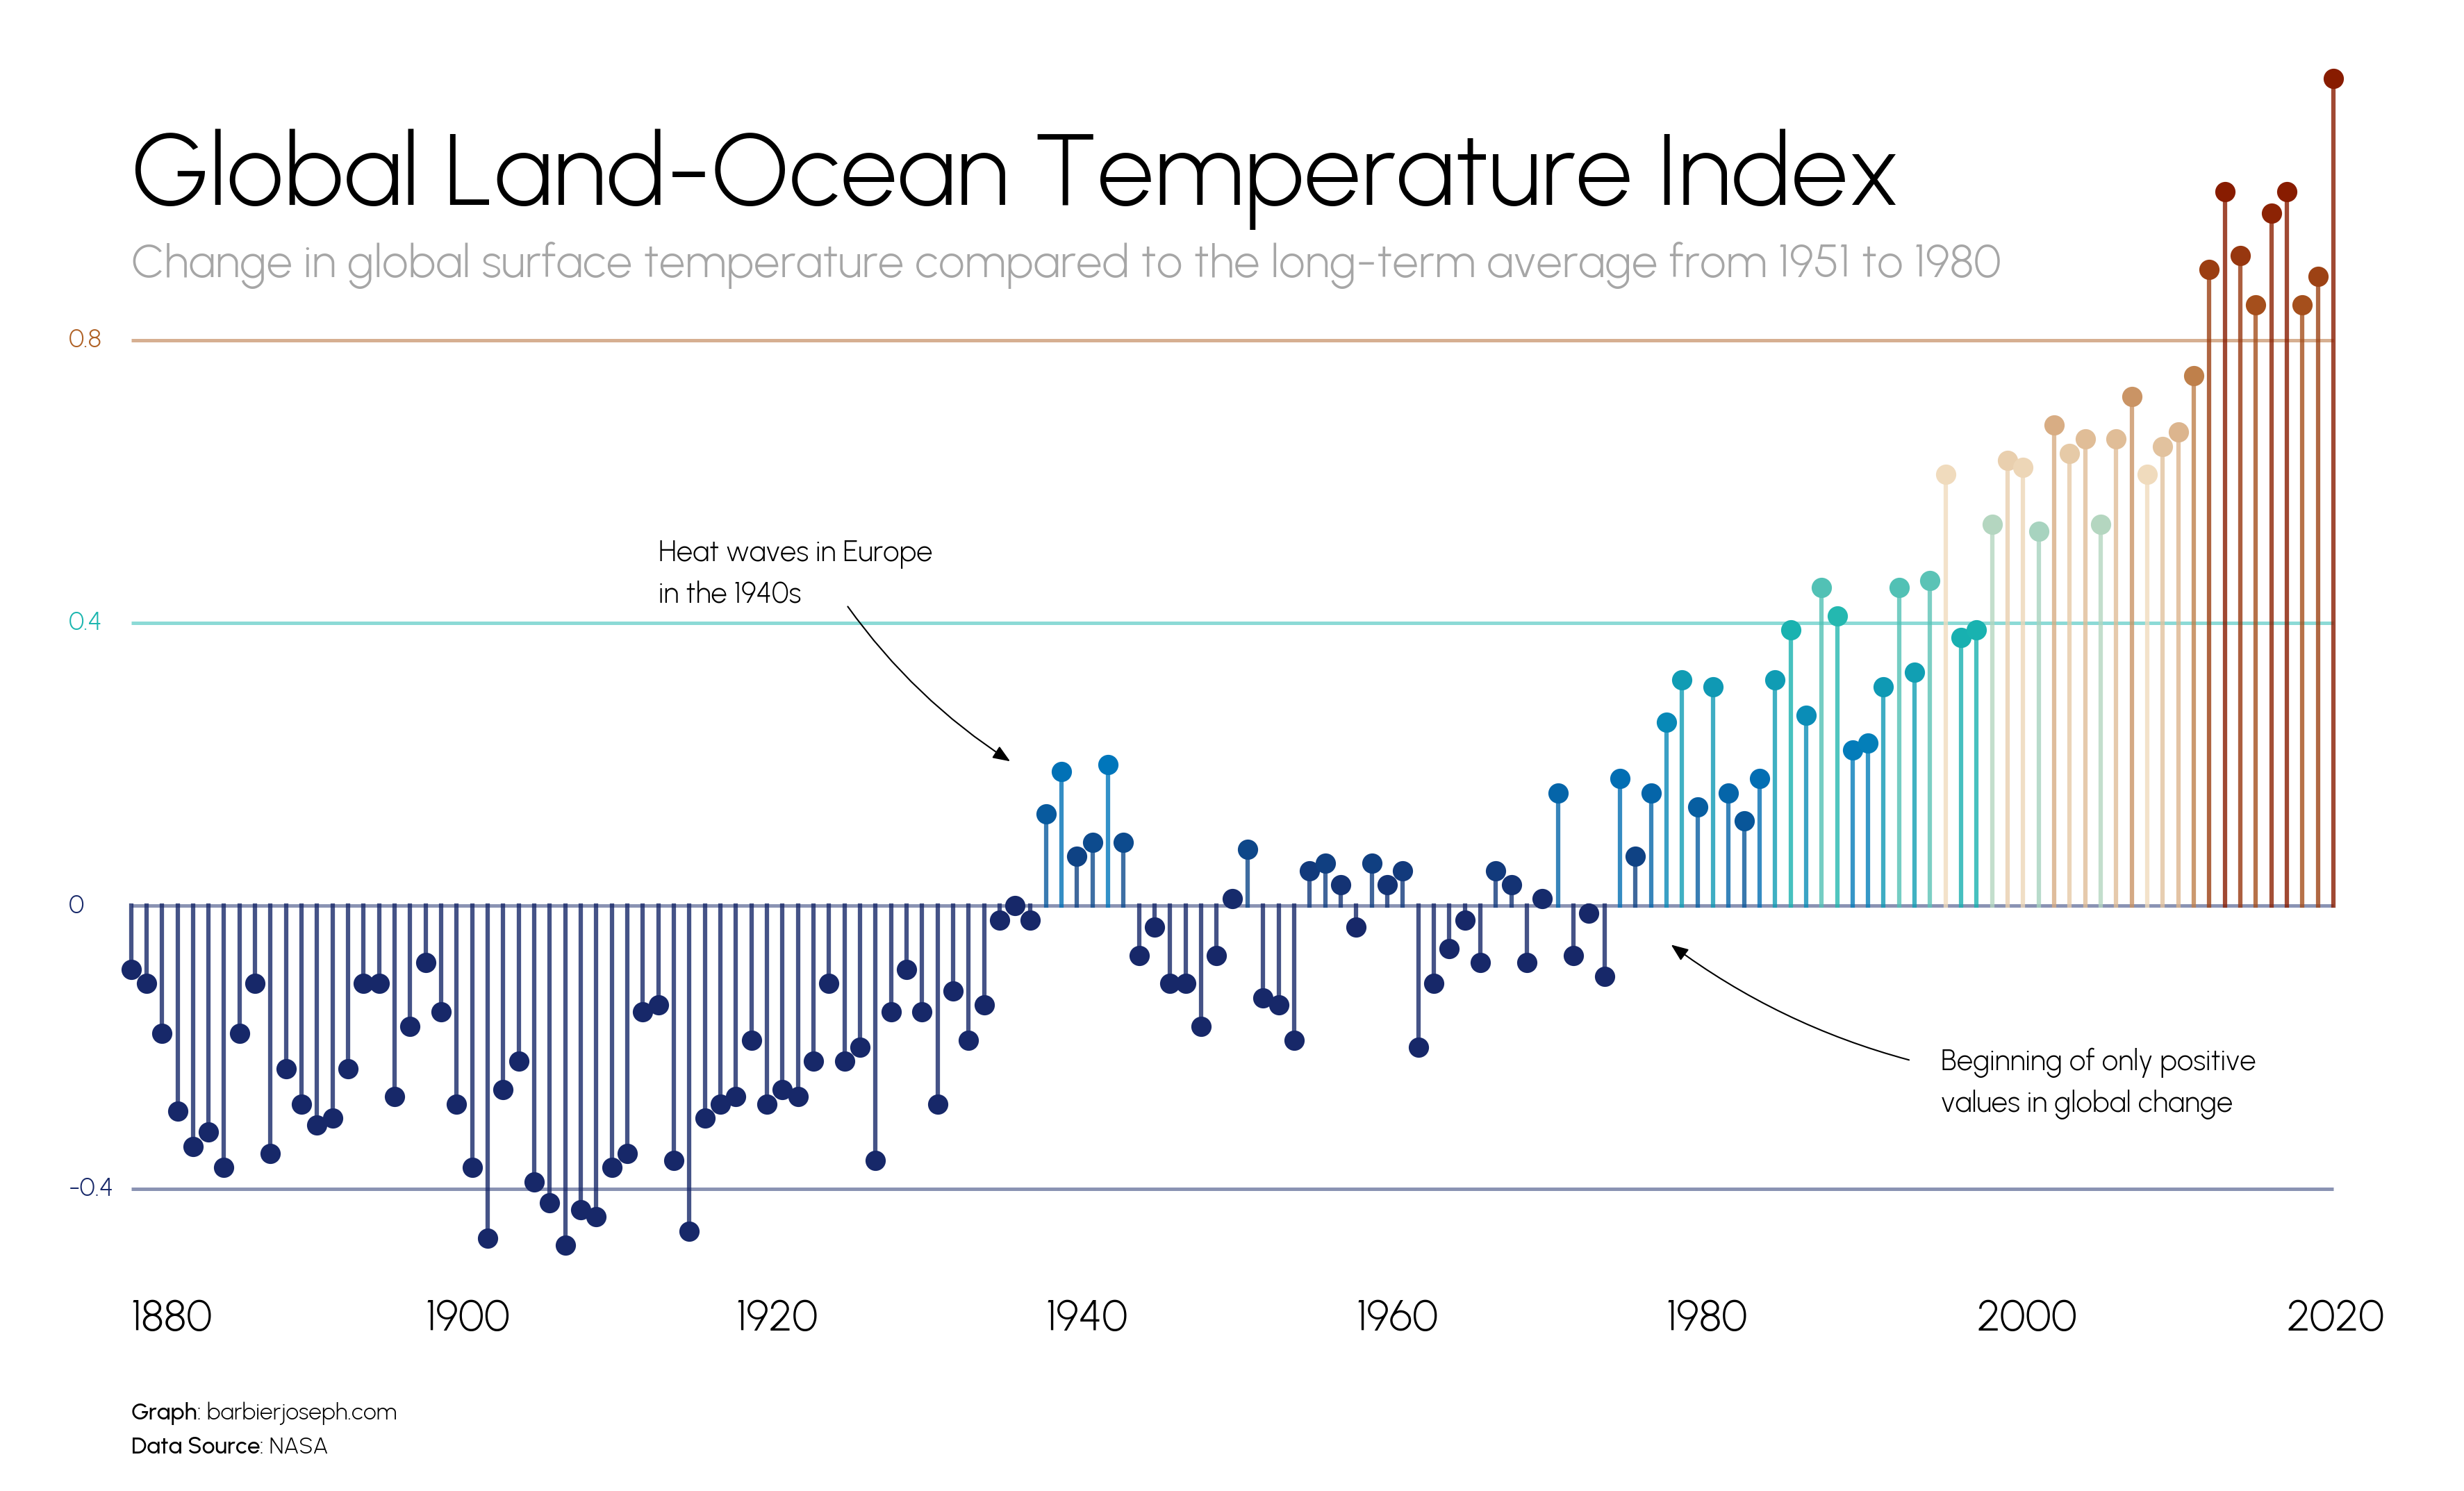
Chart made with pypalettes
Click on the image to get the associated code!
Acknowledgements
PyPalettes is highly inspired (and relies on for the first one)
from
- the R package paletteer
- the python library palettable
A big thanks to Yan Holtz for creating the Color Palette Finder, a web app for browsing palettes
Project details
Verified details
These details have been verified by PyPIProject links
GitHub Statistics
Maintainers


Download files
Download the file for your platform. If you're not sure which to choose, learn more about installing packages.
Source Distribution
Built Distribution
Filter files by name, interpreter, ABI, and platform.
If you're not sure about the file name format, learn more about wheel file names.
Copy a direct link to the current filters
File details
Details for the file pypalettes-0.2.1.tar.gz.
File metadata
- Download URL: pypalettes-0.2.1.tar.gz
- Upload date:
- Size: 14.5 MB
- Tags: Source
- Uploaded using Trusted Publishing? Yes
- Uploaded via: twine/6.1.0 CPython/3.13.7
File hashes
| Algorithm | Hash digest | |
|---|---|---|
| SHA256 |
f086b8c3275cf36472216532f4a4c80ebc1a6e639ac5fff9609f94c4123e44c1
|
|
| MD5 |
ff61b4c931c944b2d7b2ba98b3019d9b
|
|
| BLAKE2b-256 |
3a2c14c7e4b7c61cb26a003e8c8979a24949522270668faf1e3bc6b26e7a8ca8
|
Provenance
The following attestation bundles were made for pypalettes-0.2.1.tar.gz:
Publisher:
pypi.yaml on y-sunflower/pypalettes
-
Statement:
-
Statement type:
https://in-toto.io/Statement/v1 -
Predicate type:
https://docs.pypi.org/attestations/publish/v1 -
Subject name:
pypalettes-0.2.1.tar.gz -
Subject digest:
f086b8c3275cf36472216532f4a4c80ebc1a6e639ac5fff9609f94c4123e44c1 - Sigstore transparency entry: 685860258
- Sigstore integration time:
-
Permalink:
y-sunflower/pypalettes@5eb7e379588c7fced59fc93ab1eaf1104ef63d36 -
Branch / Tag:
refs/tags/v0.2.1 - Owner: https://github.com/y-sunflower
-
Access:
public
-
Token Issuer:
https://token.actions.githubusercontent.com -
Runner Environment:
github-hosted -
Publication workflow:
pypi.yaml@5eb7e379588c7fced59fc93ab1eaf1104ef63d36 -
Trigger Event:
push
-
Statement type:
File details
Details for the file pypalettes-0.2.1-py3-none-any.whl.
File metadata
- Download URL: pypalettes-0.2.1-py3-none-any.whl
- Upload date:
- Size: 367.3 kB
- Tags: Python 3
- Uploaded using Trusted Publishing? Yes
- Uploaded via: twine/6.1.0 CPython/3.13.7
File hashes
| Algorithm | Hash digest | |
|---|---|---|
| SHA256 |
5b26fc6e056212e402cf3e6338165ac16e1b19c000f882894d21f2de5bf79af0
|
|
| MD5 |
4fb8651d1405984be779c84c9552443f
|
|
| BLAKE2b-256 |
91fb3380832944eb4552b5873dd8c75095250356edfadf1156bd562da04fc793
|
Provenance
The following attestation bundles were made for pypalettes-0.2.1-py3-none-any.whl:
Publisher:
pypi.yaml on y-sunflower/pypalettes
-
Statement:
-
Statement type:
https://in-toto.io/Statement/v1 -
Predicate type:
https://docs.pypi.org/attestations/publish/v1 -
Subject name:
pypalettes-0.2.1-py3-none-any.whl -
Subject digest:
5b26fc6e056212e402cf3e6338165ac16e1b19c000f882894d21f2de5bf79af0 - Sigstore transparency entry: 685860259
- Sigstore integration time:
-
Permalink:
y-sunflower/pypalettes@5eb7e379588c7fced59fc93ab1eaf1104ef63d36 -
Branch / Tag:
refs/tags/v0.2.1 - Owner: https://github.com/y-sunflower
-
Access:
public
-
Token Issuer:
https://token.actions.githubusercontent.com -
Runner Environment:
github-hosted -
Publication workflow:
pypi.yaml@5eb7e379588c7fced59fc93ab1eaf1104ef63d36 -
Trigger Event:
push
-
Statement type:


