A package for performing spatial interpolation with vector data

Project description
PyPolate


Python tools for interpoolating spatial data
Table of Contents
- Introduction
- Examples
- Interpolating car crash data with areal weighting
- Masking land-use categories with the binary method
- Setting land-use category thresholds with the limiting variable method
- Assigning weights to land-use categories with the n-class method
- Disaggregating population with the parcel method
- Refining parcel method with the Cadastral-Based Expert Dasymetric System
Introduction
PyPolate is an open source project to make interpolating geospatial data in python easier. Geometric operations in PyPolate are performed by Geopandas. PyPolate currently works with spatial vector data and implements six different methods of spatial interpolation.
Examples
Interpolating car crash data with areal weighting
For this example, we will be using open data from Philadelphia. The first shapefile is crash data aggregated by Traffic Analysis zone (TAZ). The second shapefile is Census Block Groups.
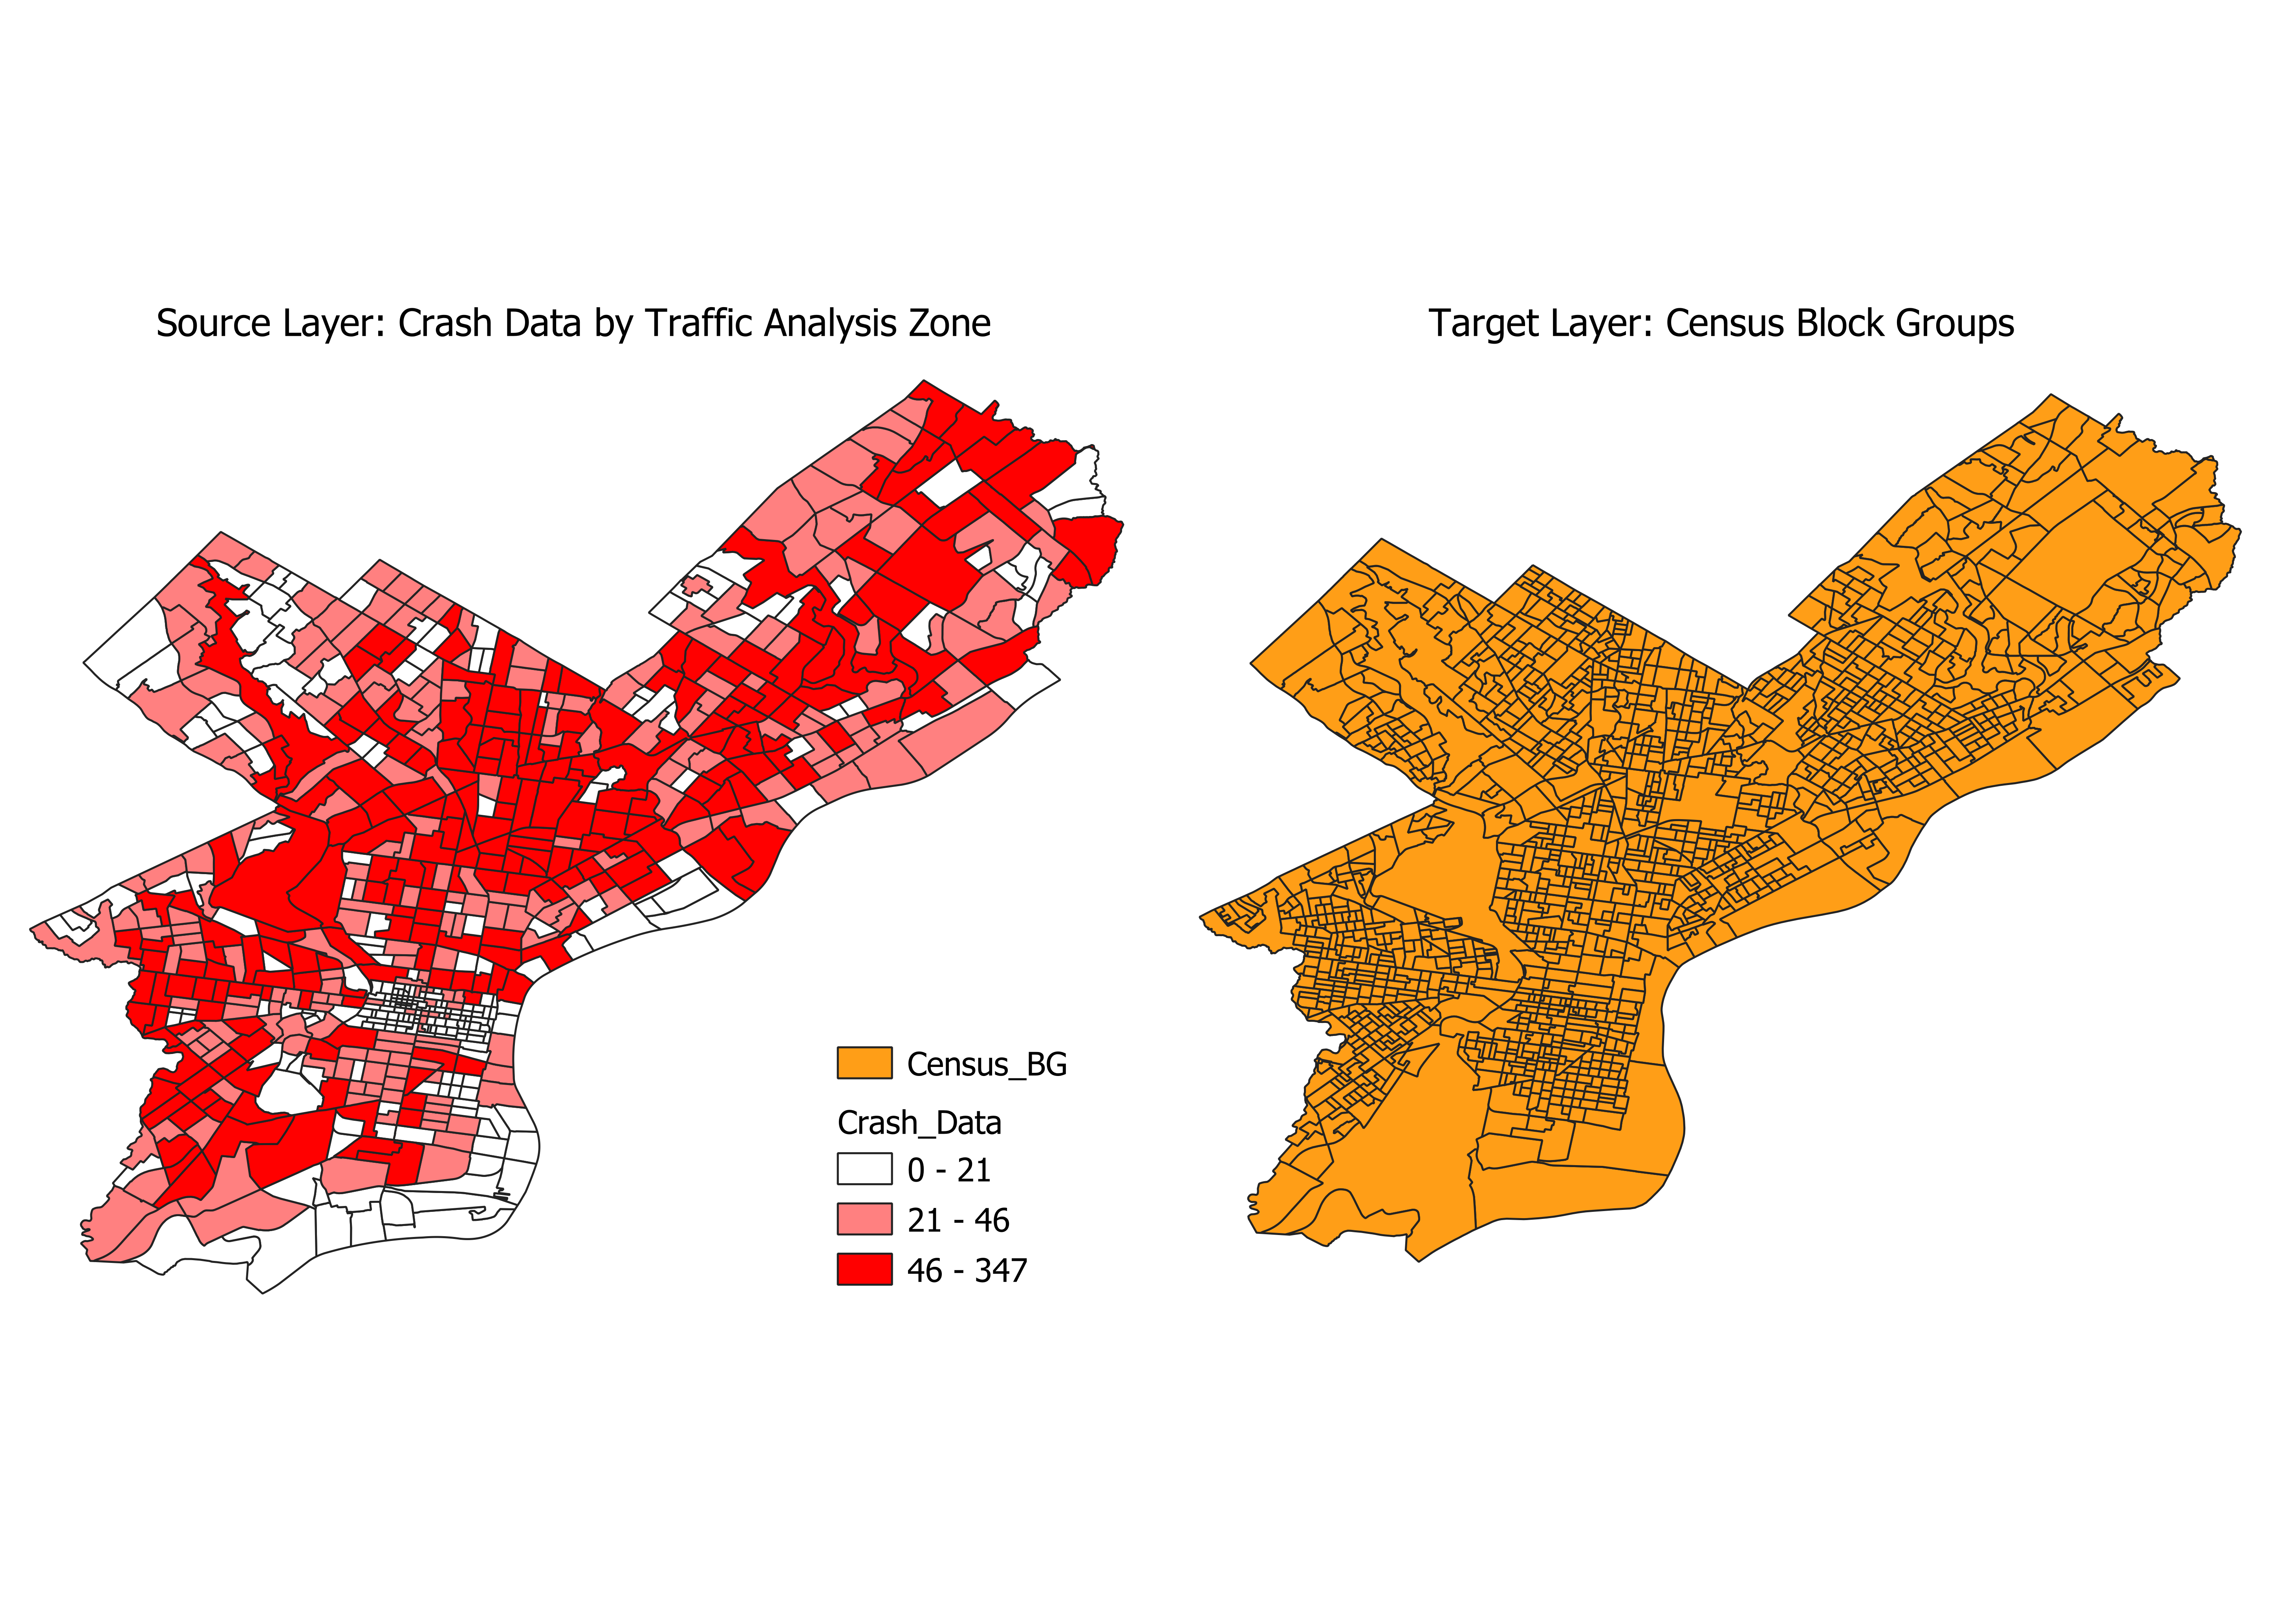
In this example, we want to interpolate the number of crashes from TAZ in the source layer, to Census Block group in our target layer. We can see from the crash-data attributes that the field for aggregated crashes is named Count_
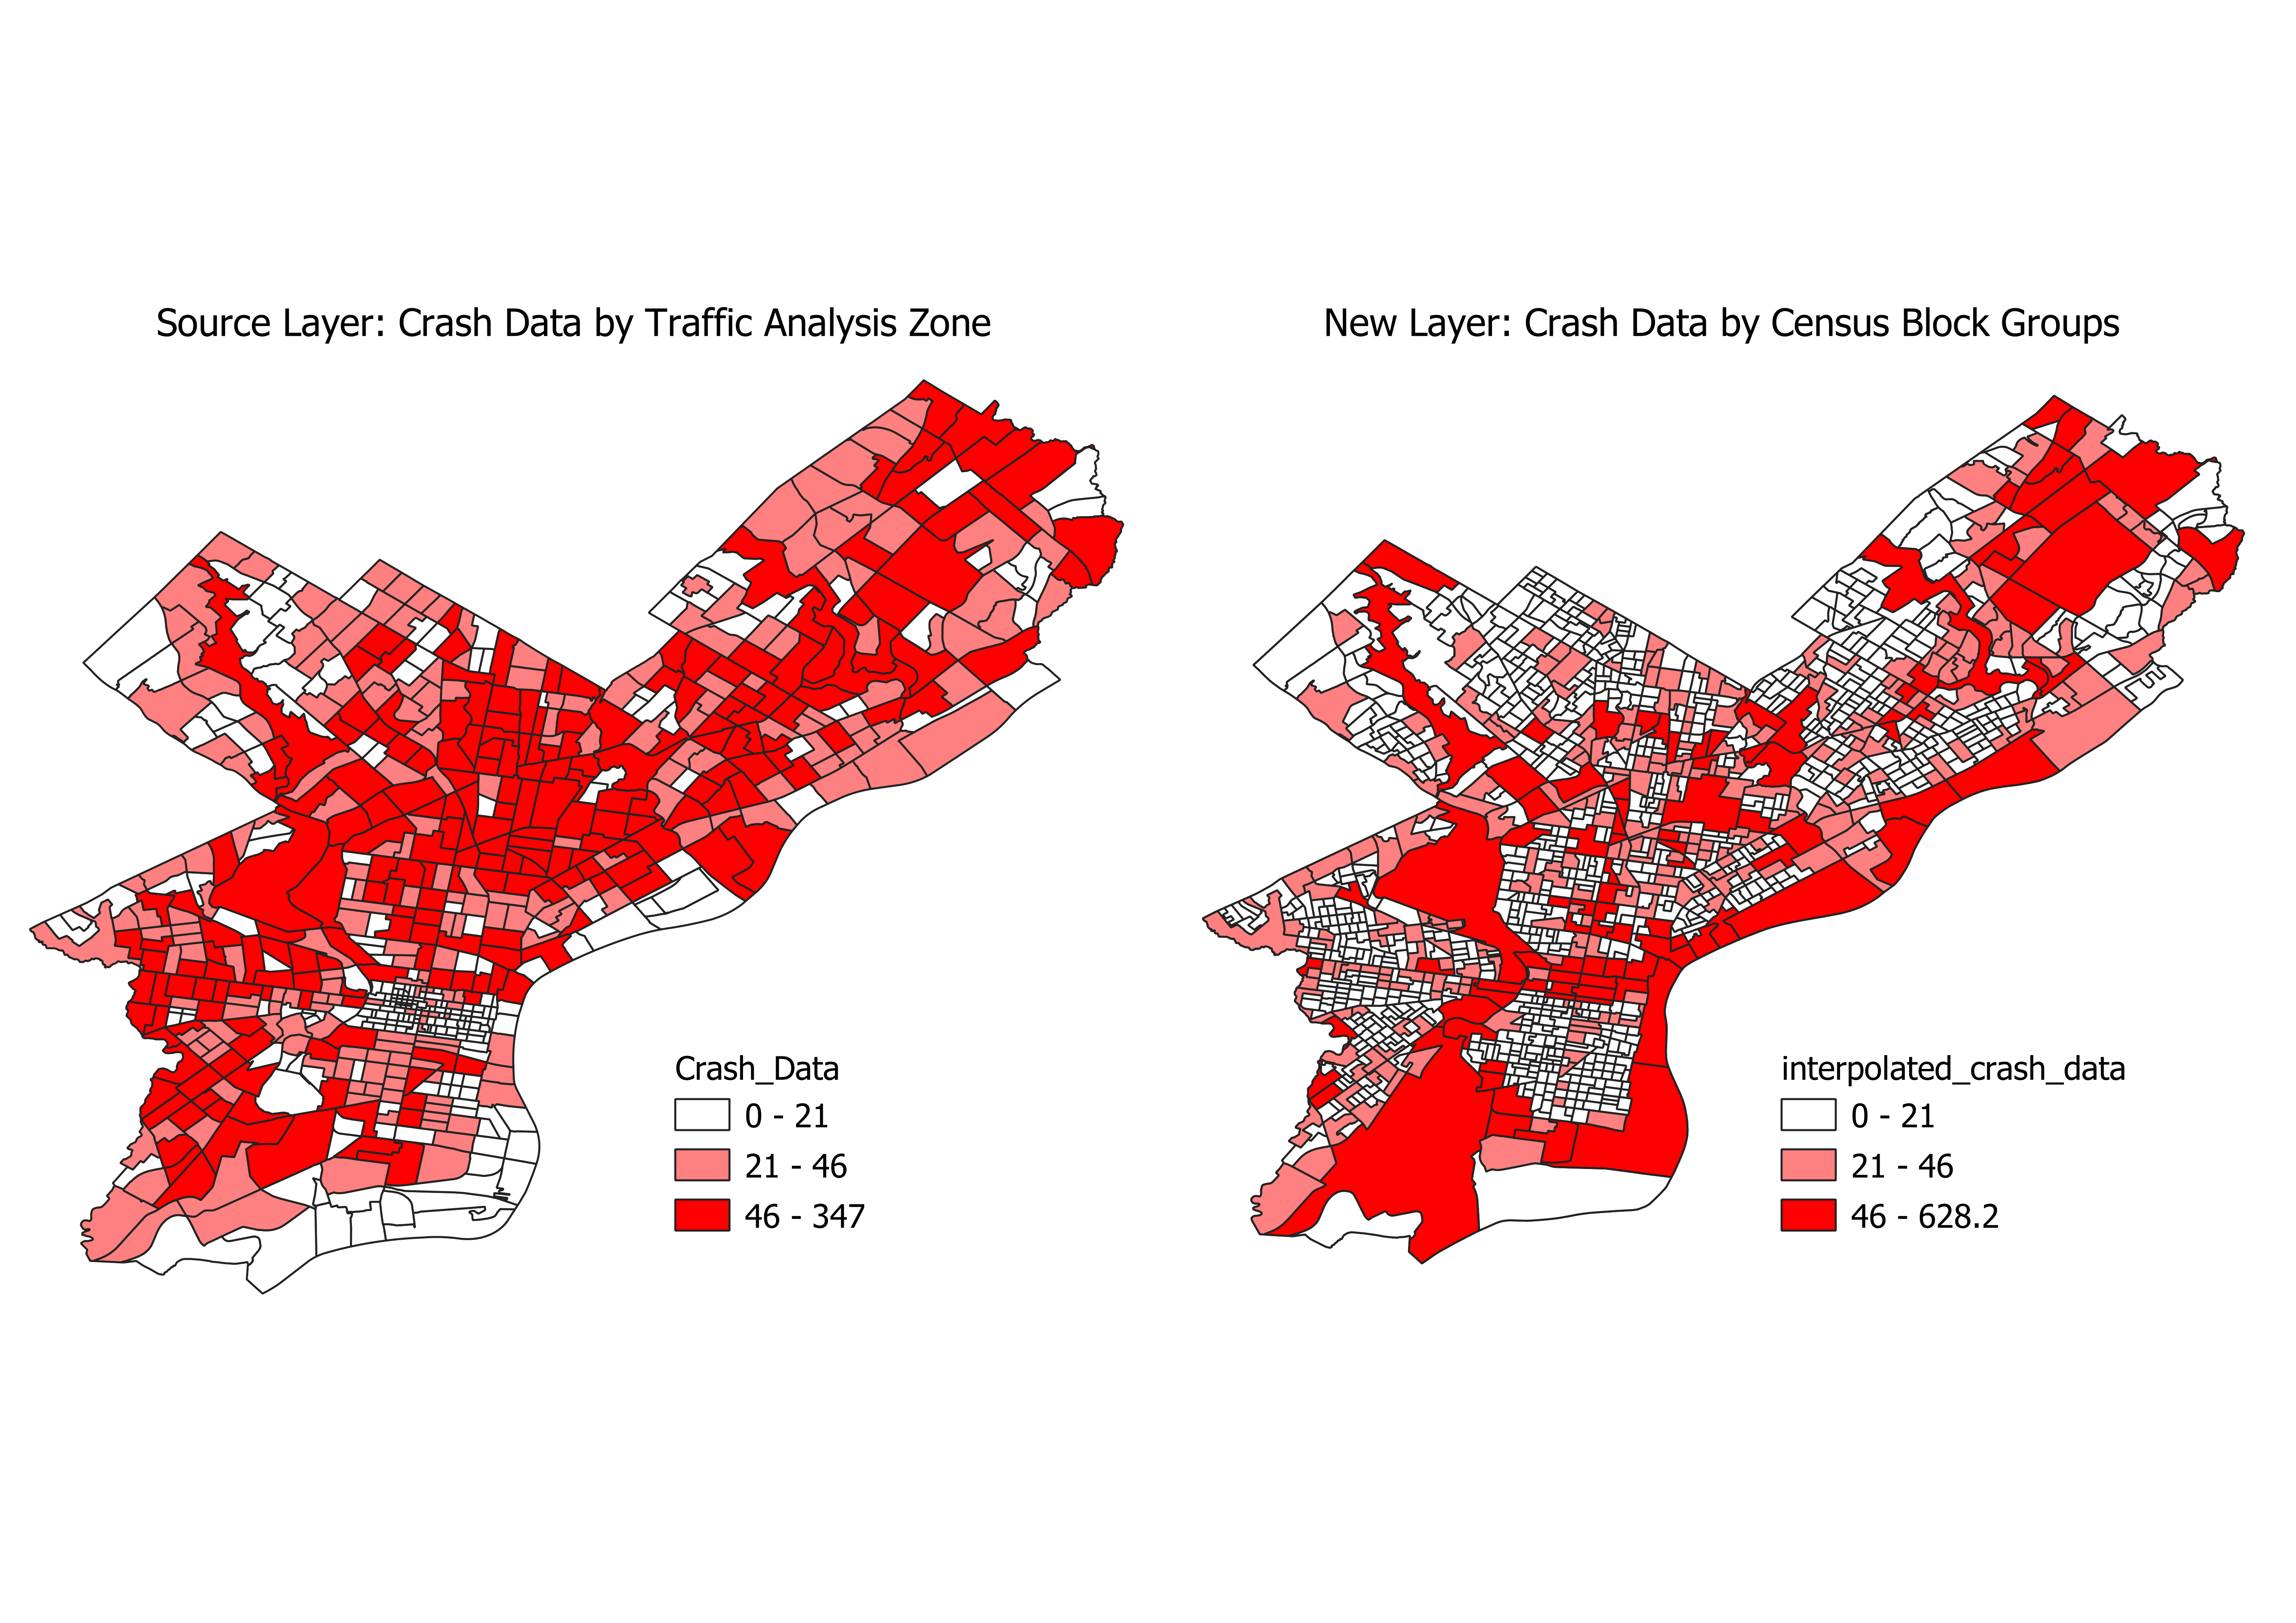
pypolate.areal(carcrash.df, census.df, Count_, '_intp')
If you map the output DataFrame and compare it to the input DataFrame, this is what it should look like:
Masking land-use categories with the binary method
In this example, we will use the Philadelphia crash data again, but this time we will use land use data as an ancillary data source. Let's take a look at our data:
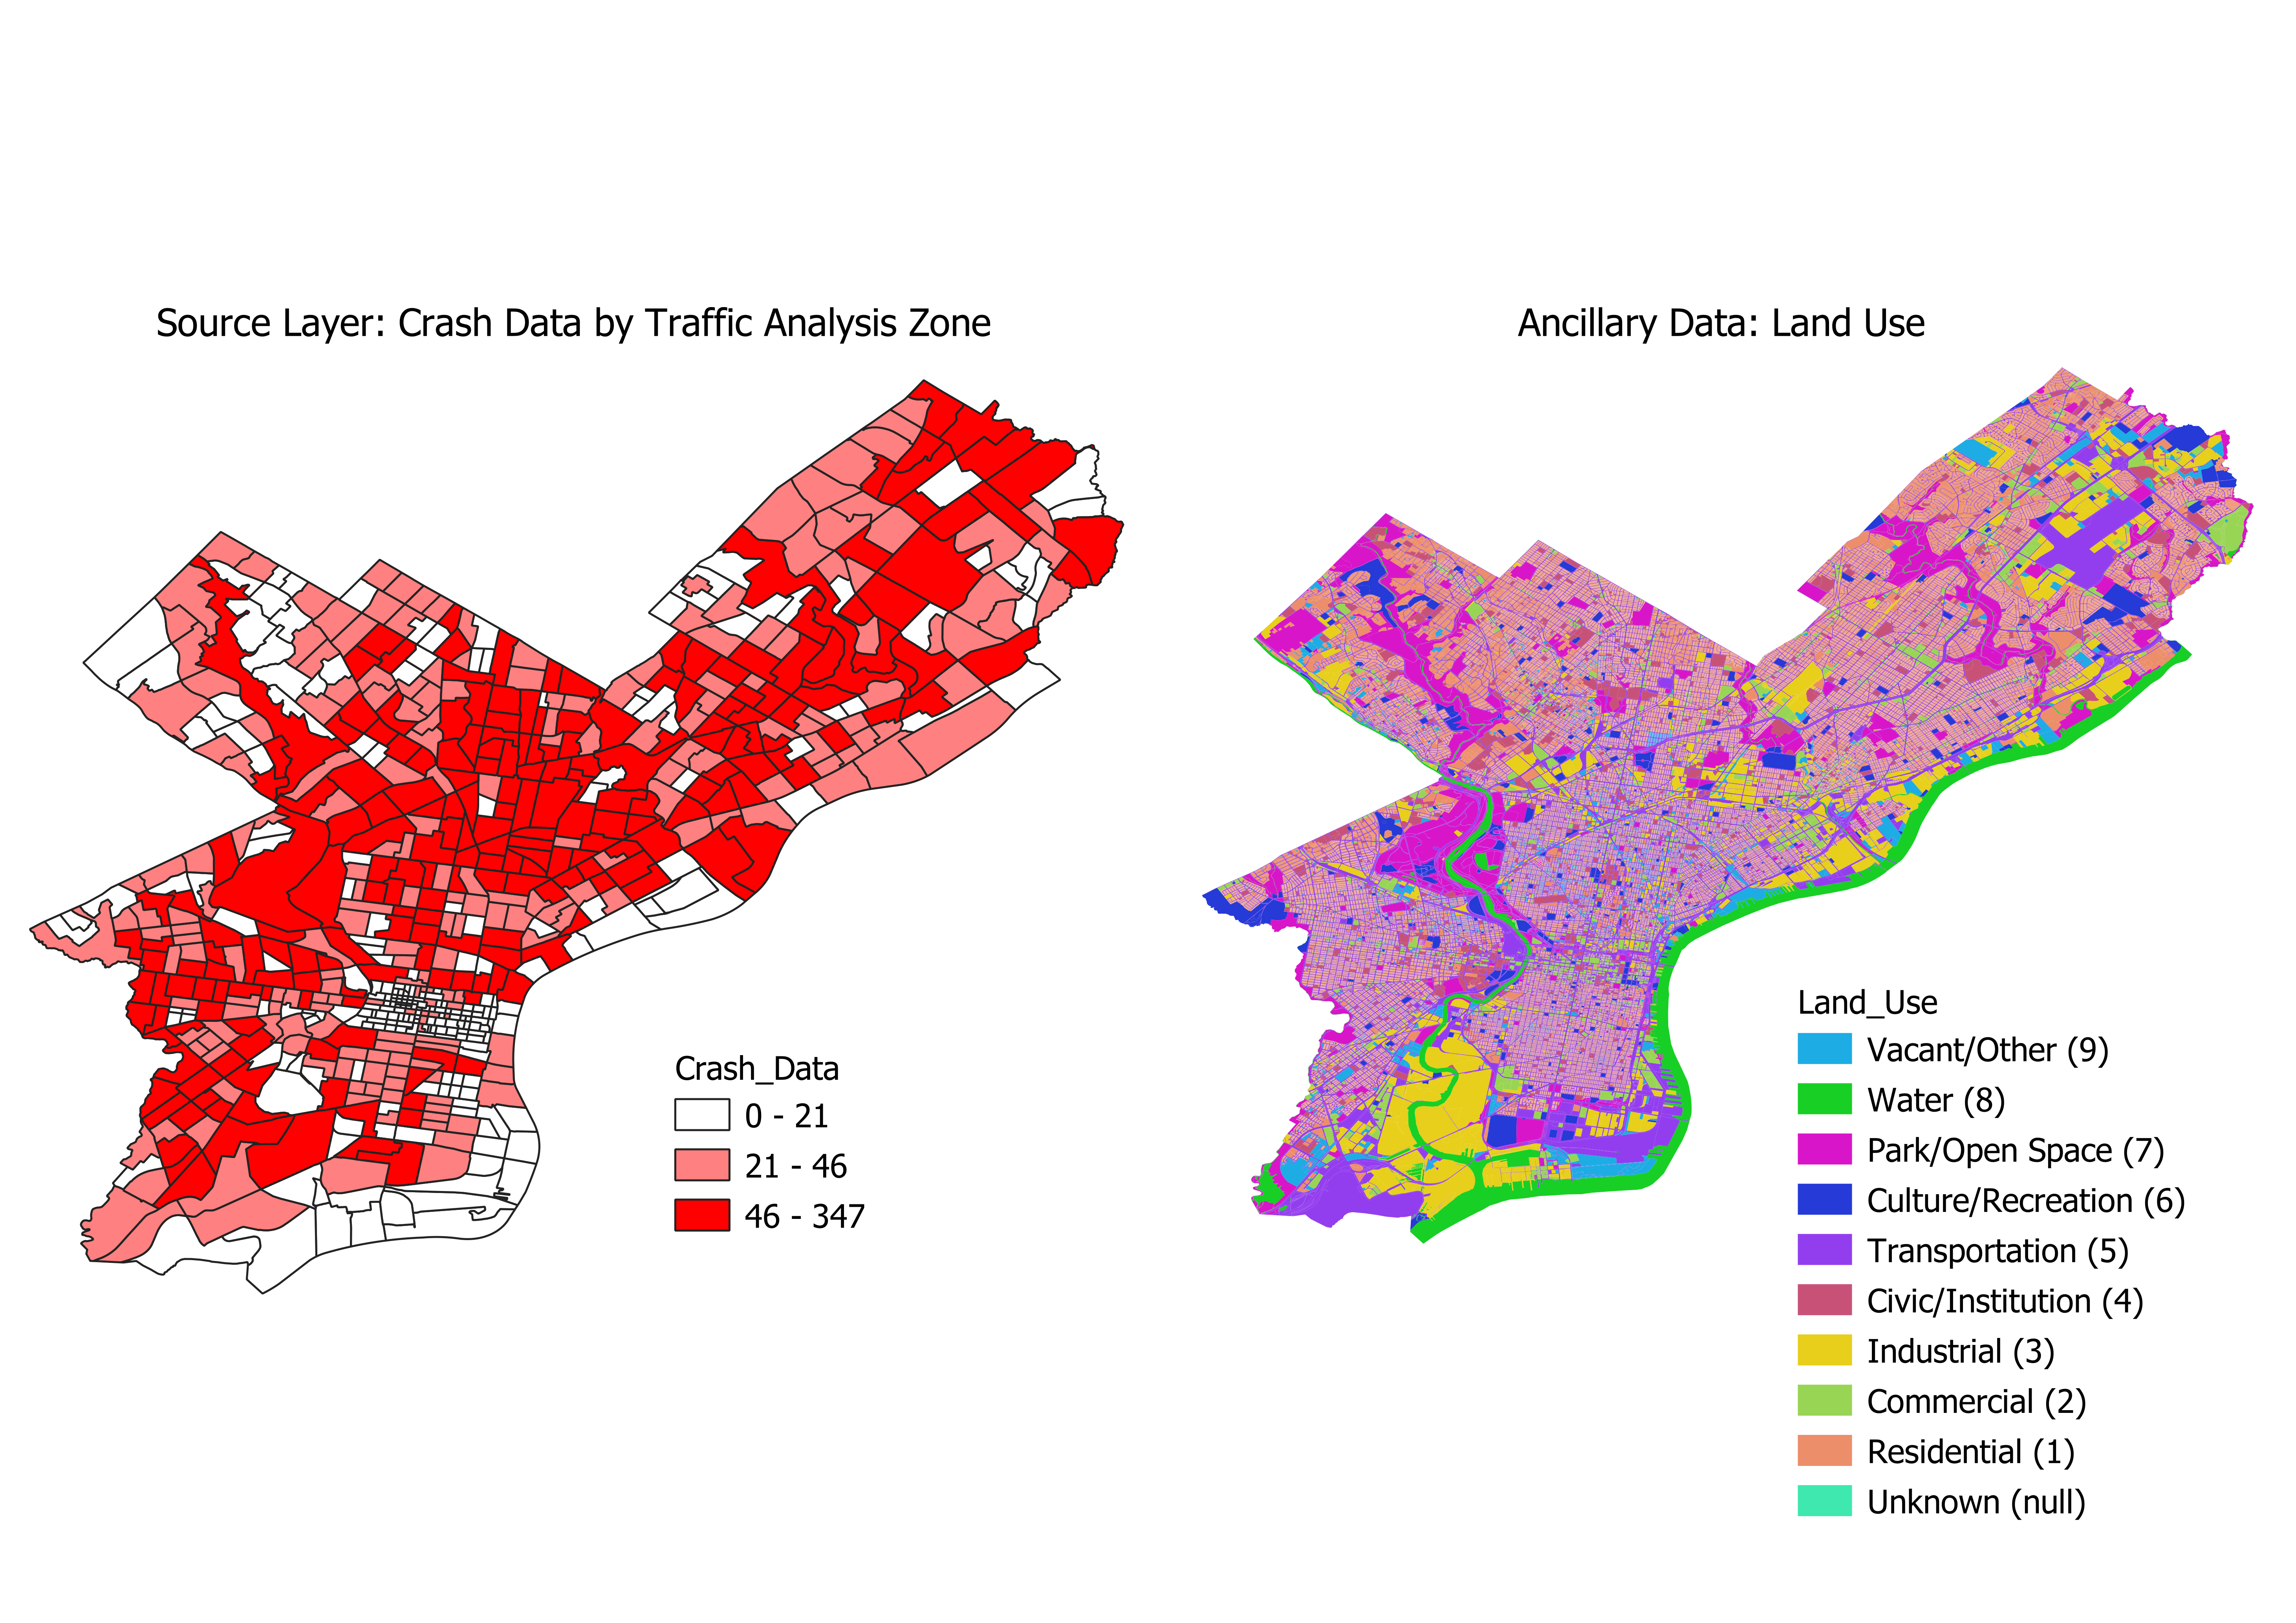
This method will use the land use DataFrame to mask out certain land use types from the crash data DataFrame. Car crashes definitely shouldn’t happen on water, and there may be other land use types you’d want to mask out. For this example, let’s assume that we want to interpolate the car crash data to just residential land use. Here’s what our inputs should look like:
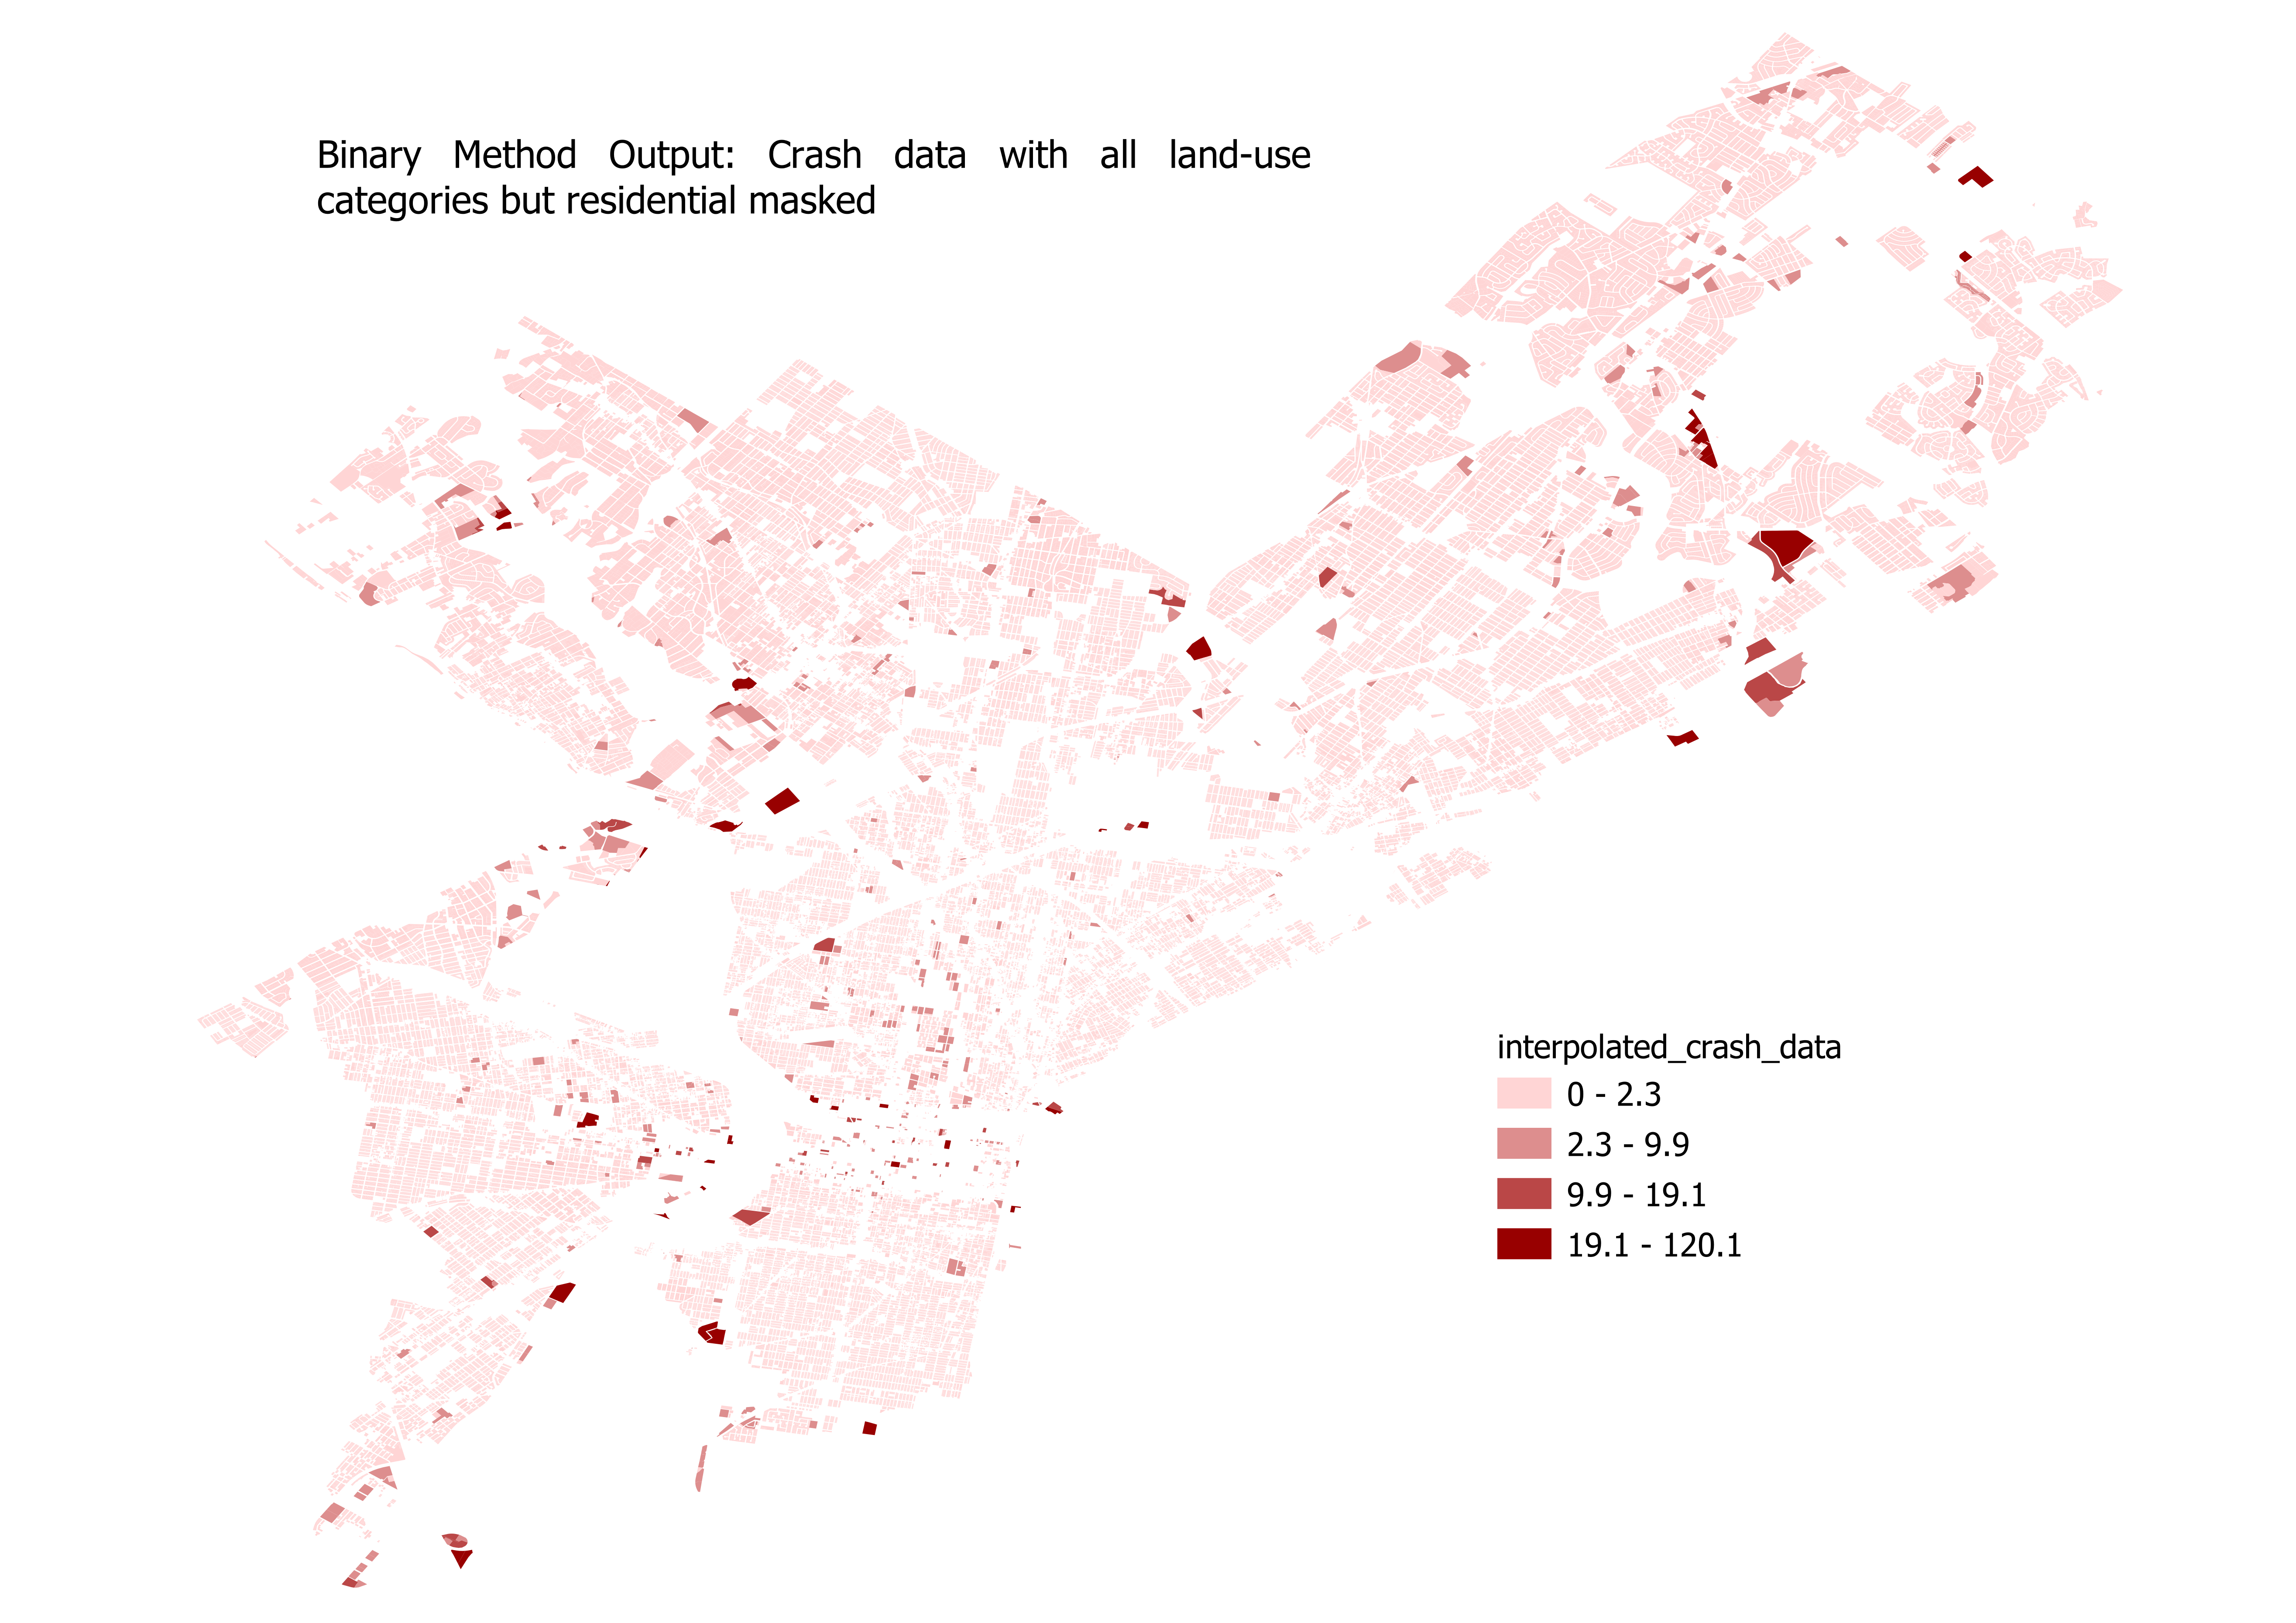
pypolate.binary(carcrash.df, landuse.df, 'C_DIG1', [2,3,4,5,6,7,8,9], '_intp', [Count_])
The field containing land use types is named C_DIG1, which contains a numbered value corresponding to the land use type. Residential corresponds to 1, so we will exclude all other values. The output of this interpolation should look similar to this:
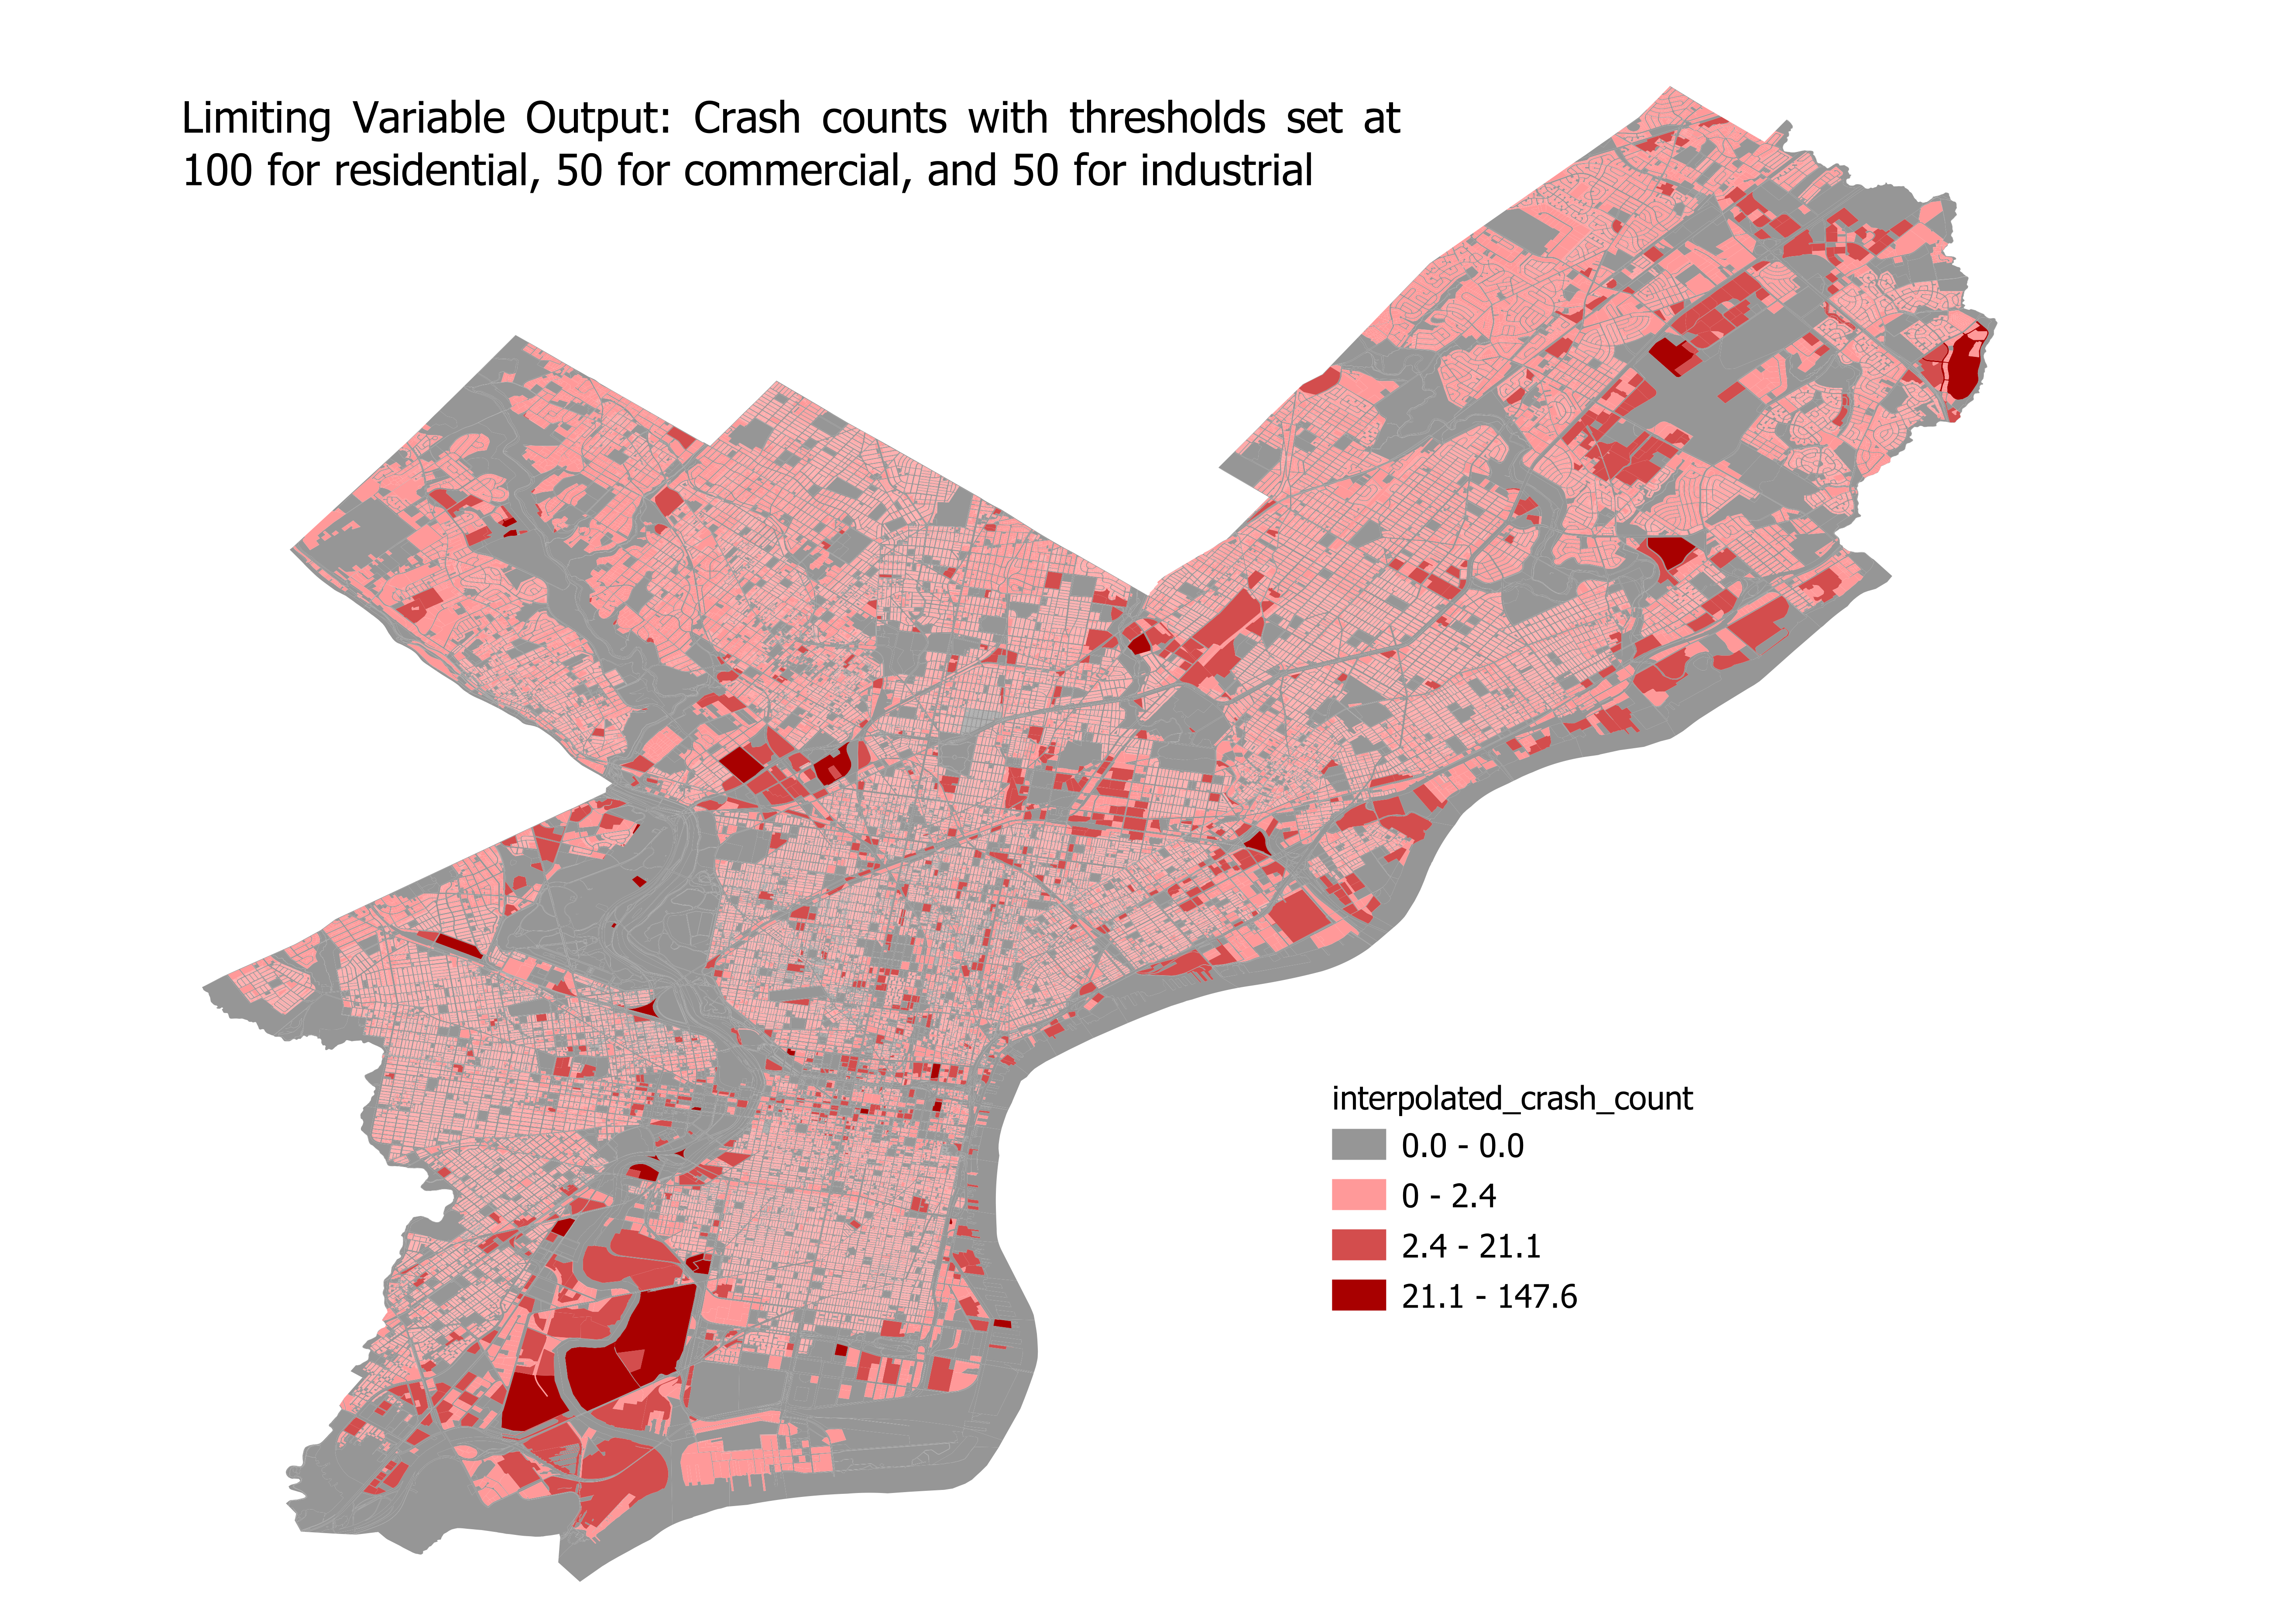
Setting land-use category thresholds with the limiting variable method
For this example, we can continue to use the Philadelphia crash data and Philadelphia land use data. Our starting data will look like this:
Calling the limiting variable method will look like this:
pypolate.lim_var(carcrash.df, landuse.df, 'C_DIG1', {1: 100, 2: 50, 3: 50}, [Count_], 'TAZ', '_intp')
And the output of the limiting variable function will look like this:
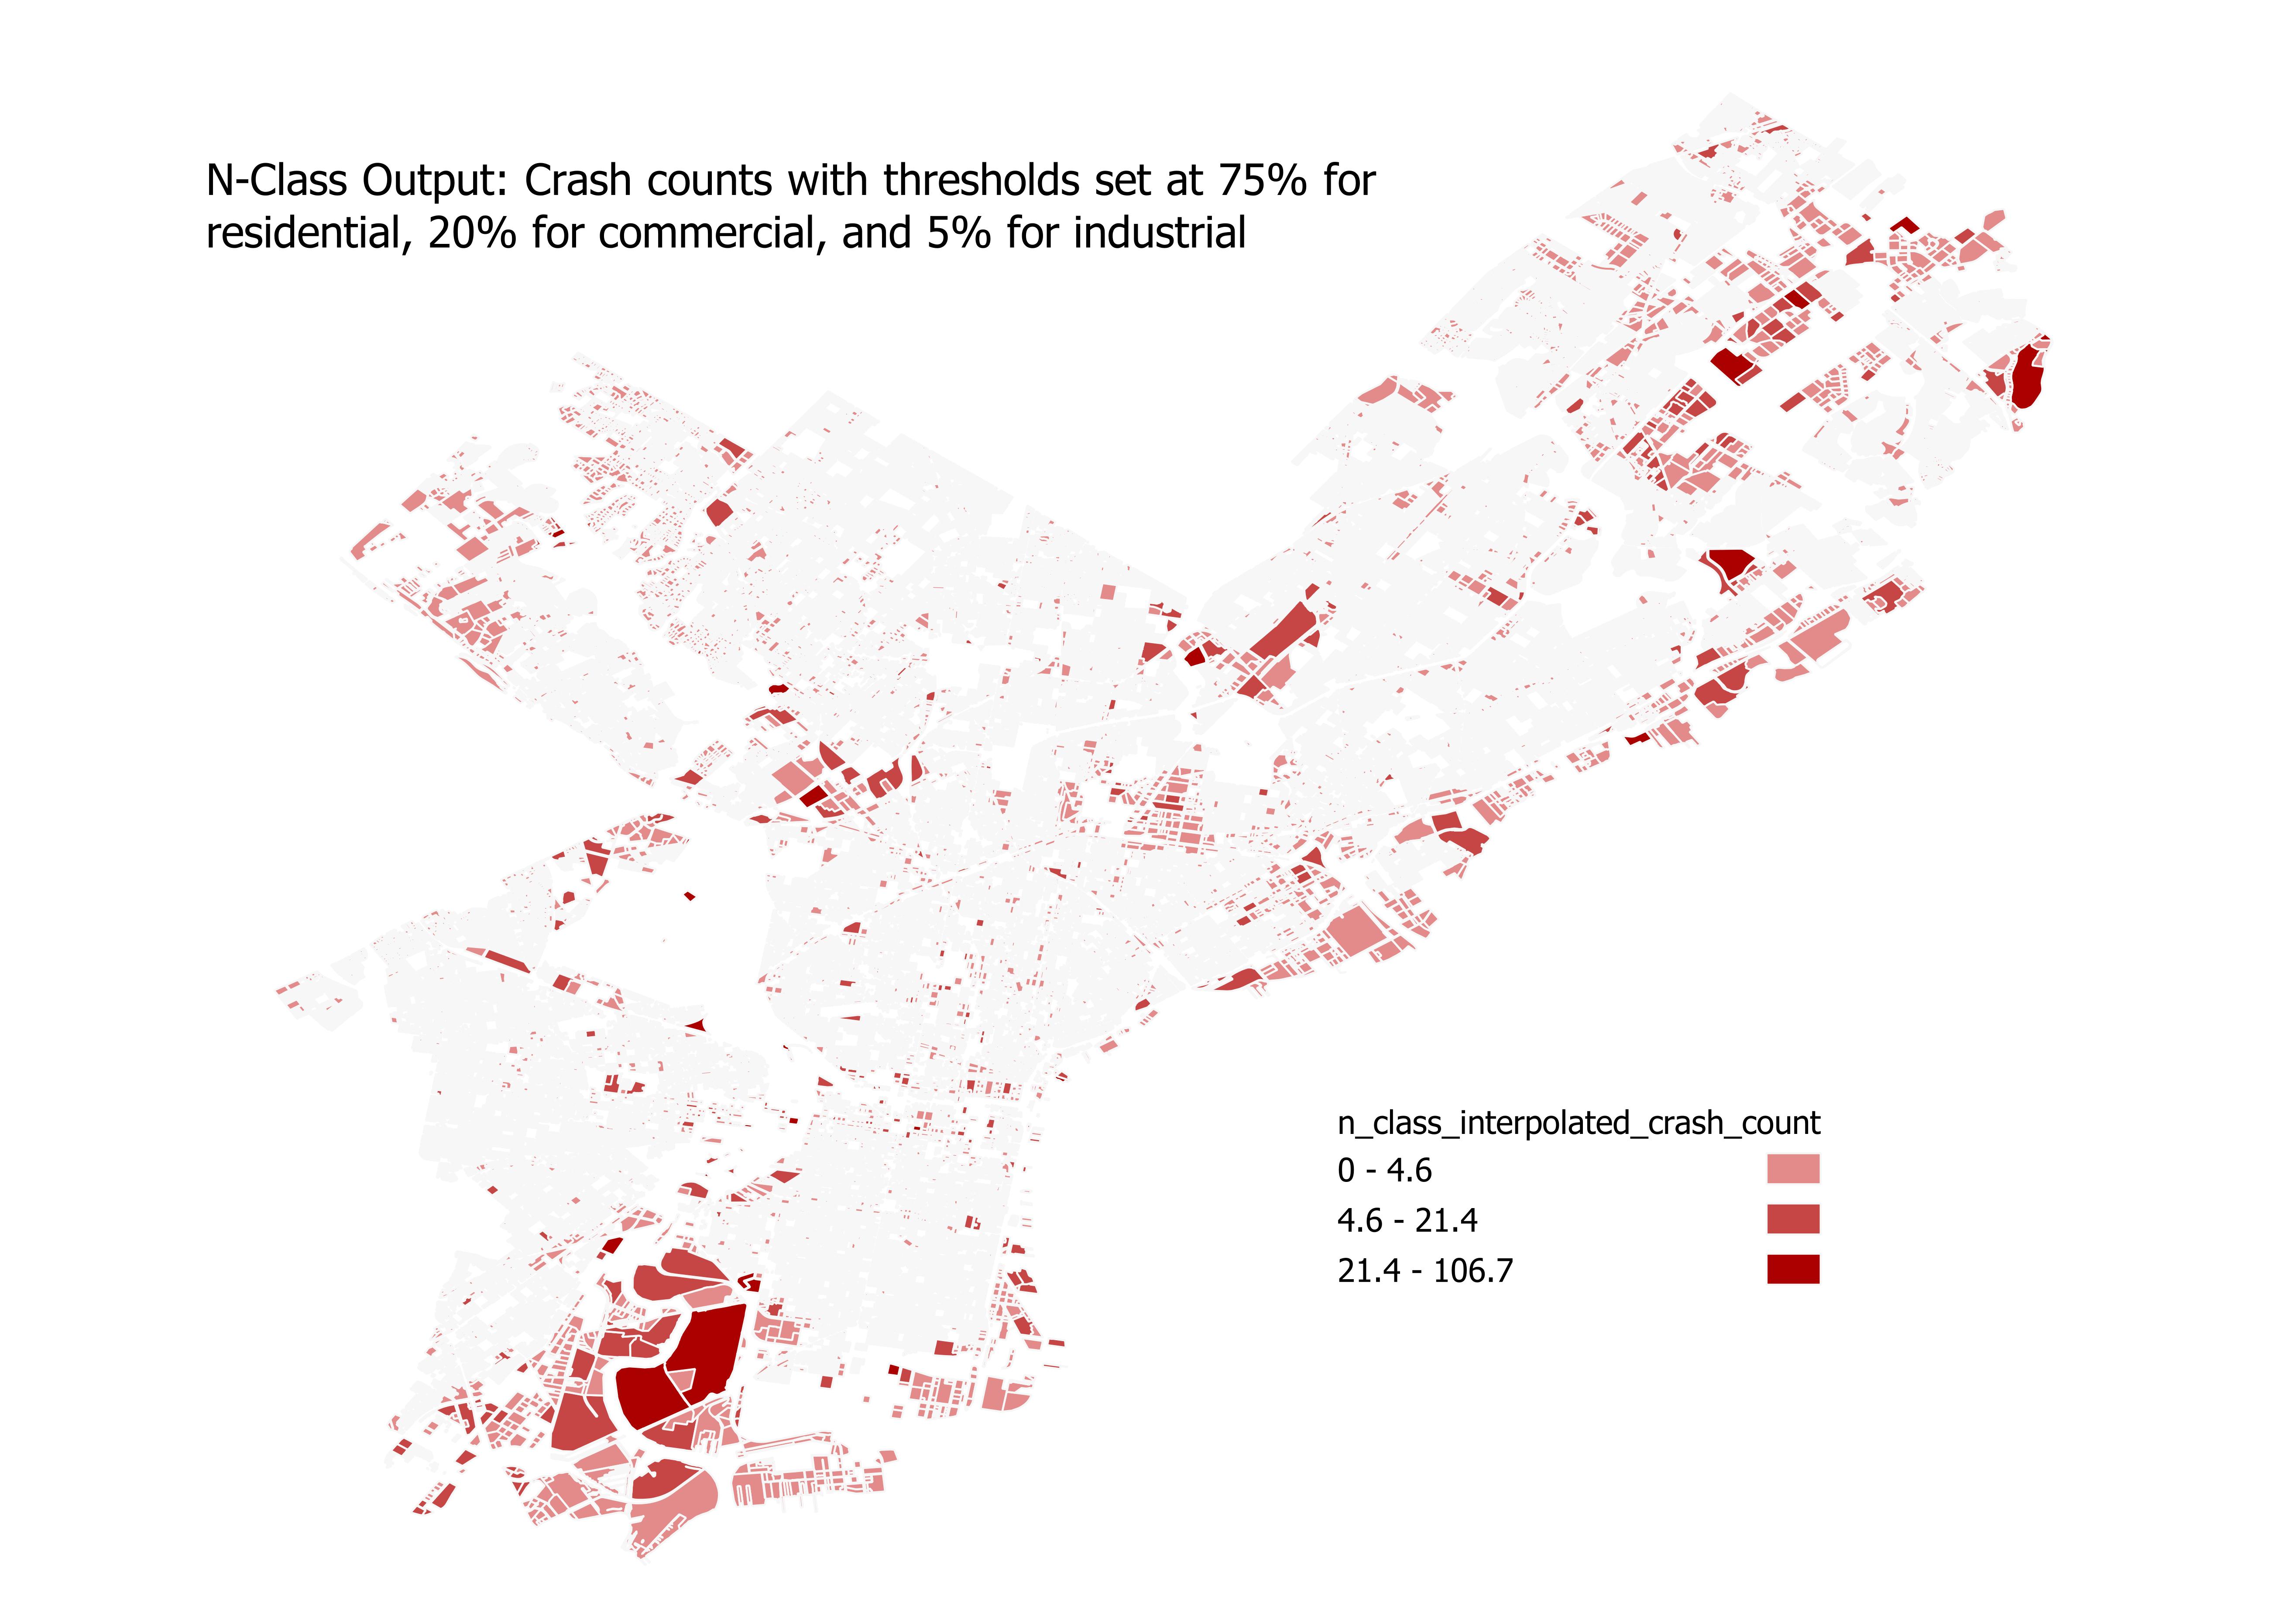
Assigning weights to land-use categories with the n-class method
For testing the n-class method, we can continue using the Philadelphia crash data and Philadelphia land use data. Our starting data will look like this again:
The inputs for n-class method are very similar to the limiting variable method, but instead of passing in a dictionary of thresholds based on square units, we pass in percentages as a decimal for our thresholds. The percentages should add up to 100%, regardless of how many classes you are splitting between. For this example, we’ll assign 75% to residential, 20% to commercial, and 5% to industrial:
pypolate.n_class(carcrash.df, landuse.df, 'C_DIG1', {1: 0.75, 2: 0.20, 3: 0.05}, [Count_], 'TAZ', '_intp')
The output should look something like this:
Disaggregating population with the parcel method
Description
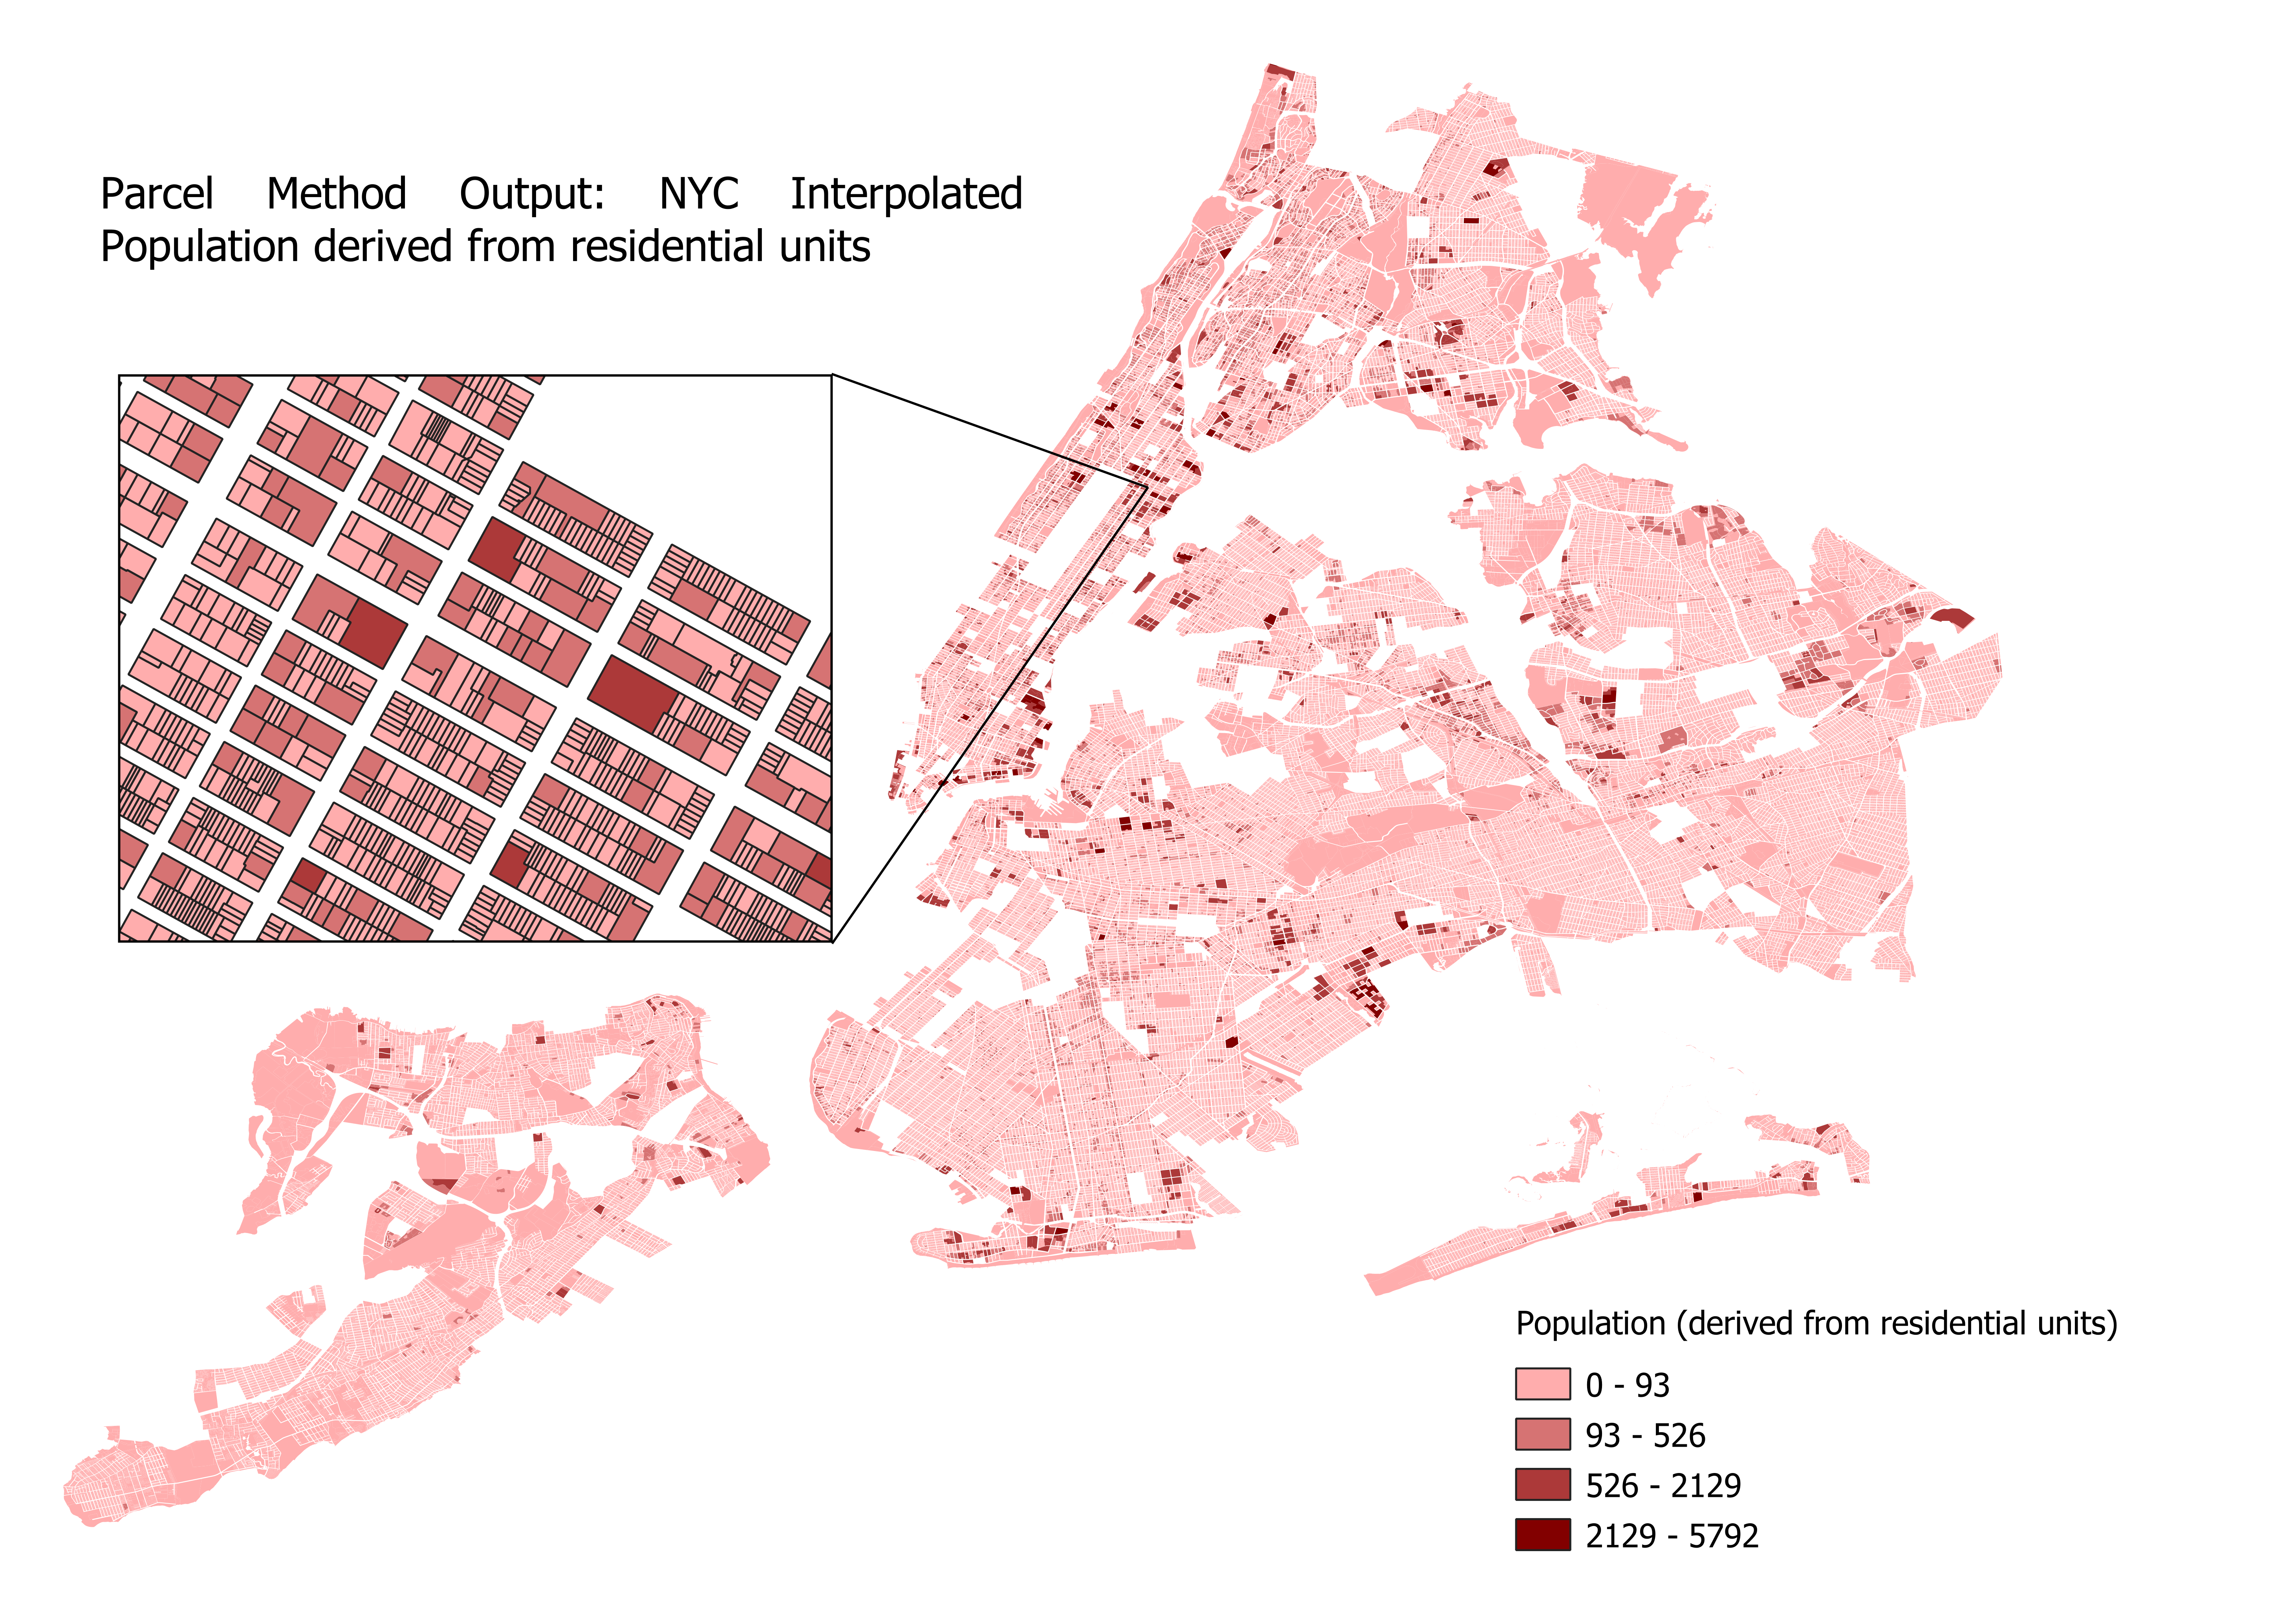
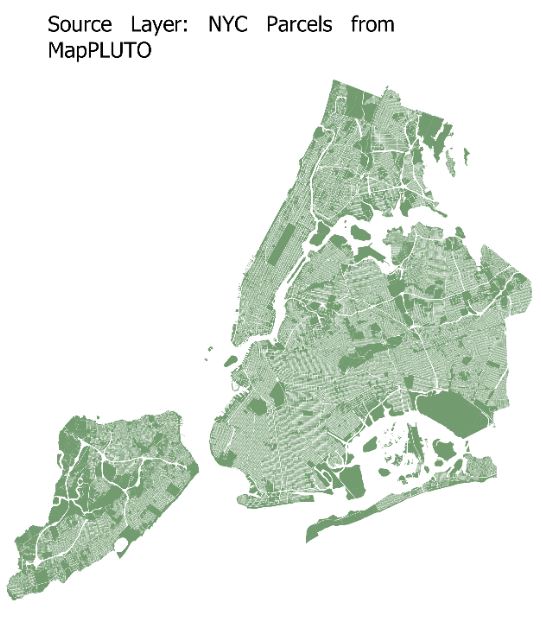
For the parcel method, we will use tax lot data from NYC's MapPLUTO, and population at the census block group level from TIGER/Line. Our data will look like this to begin:
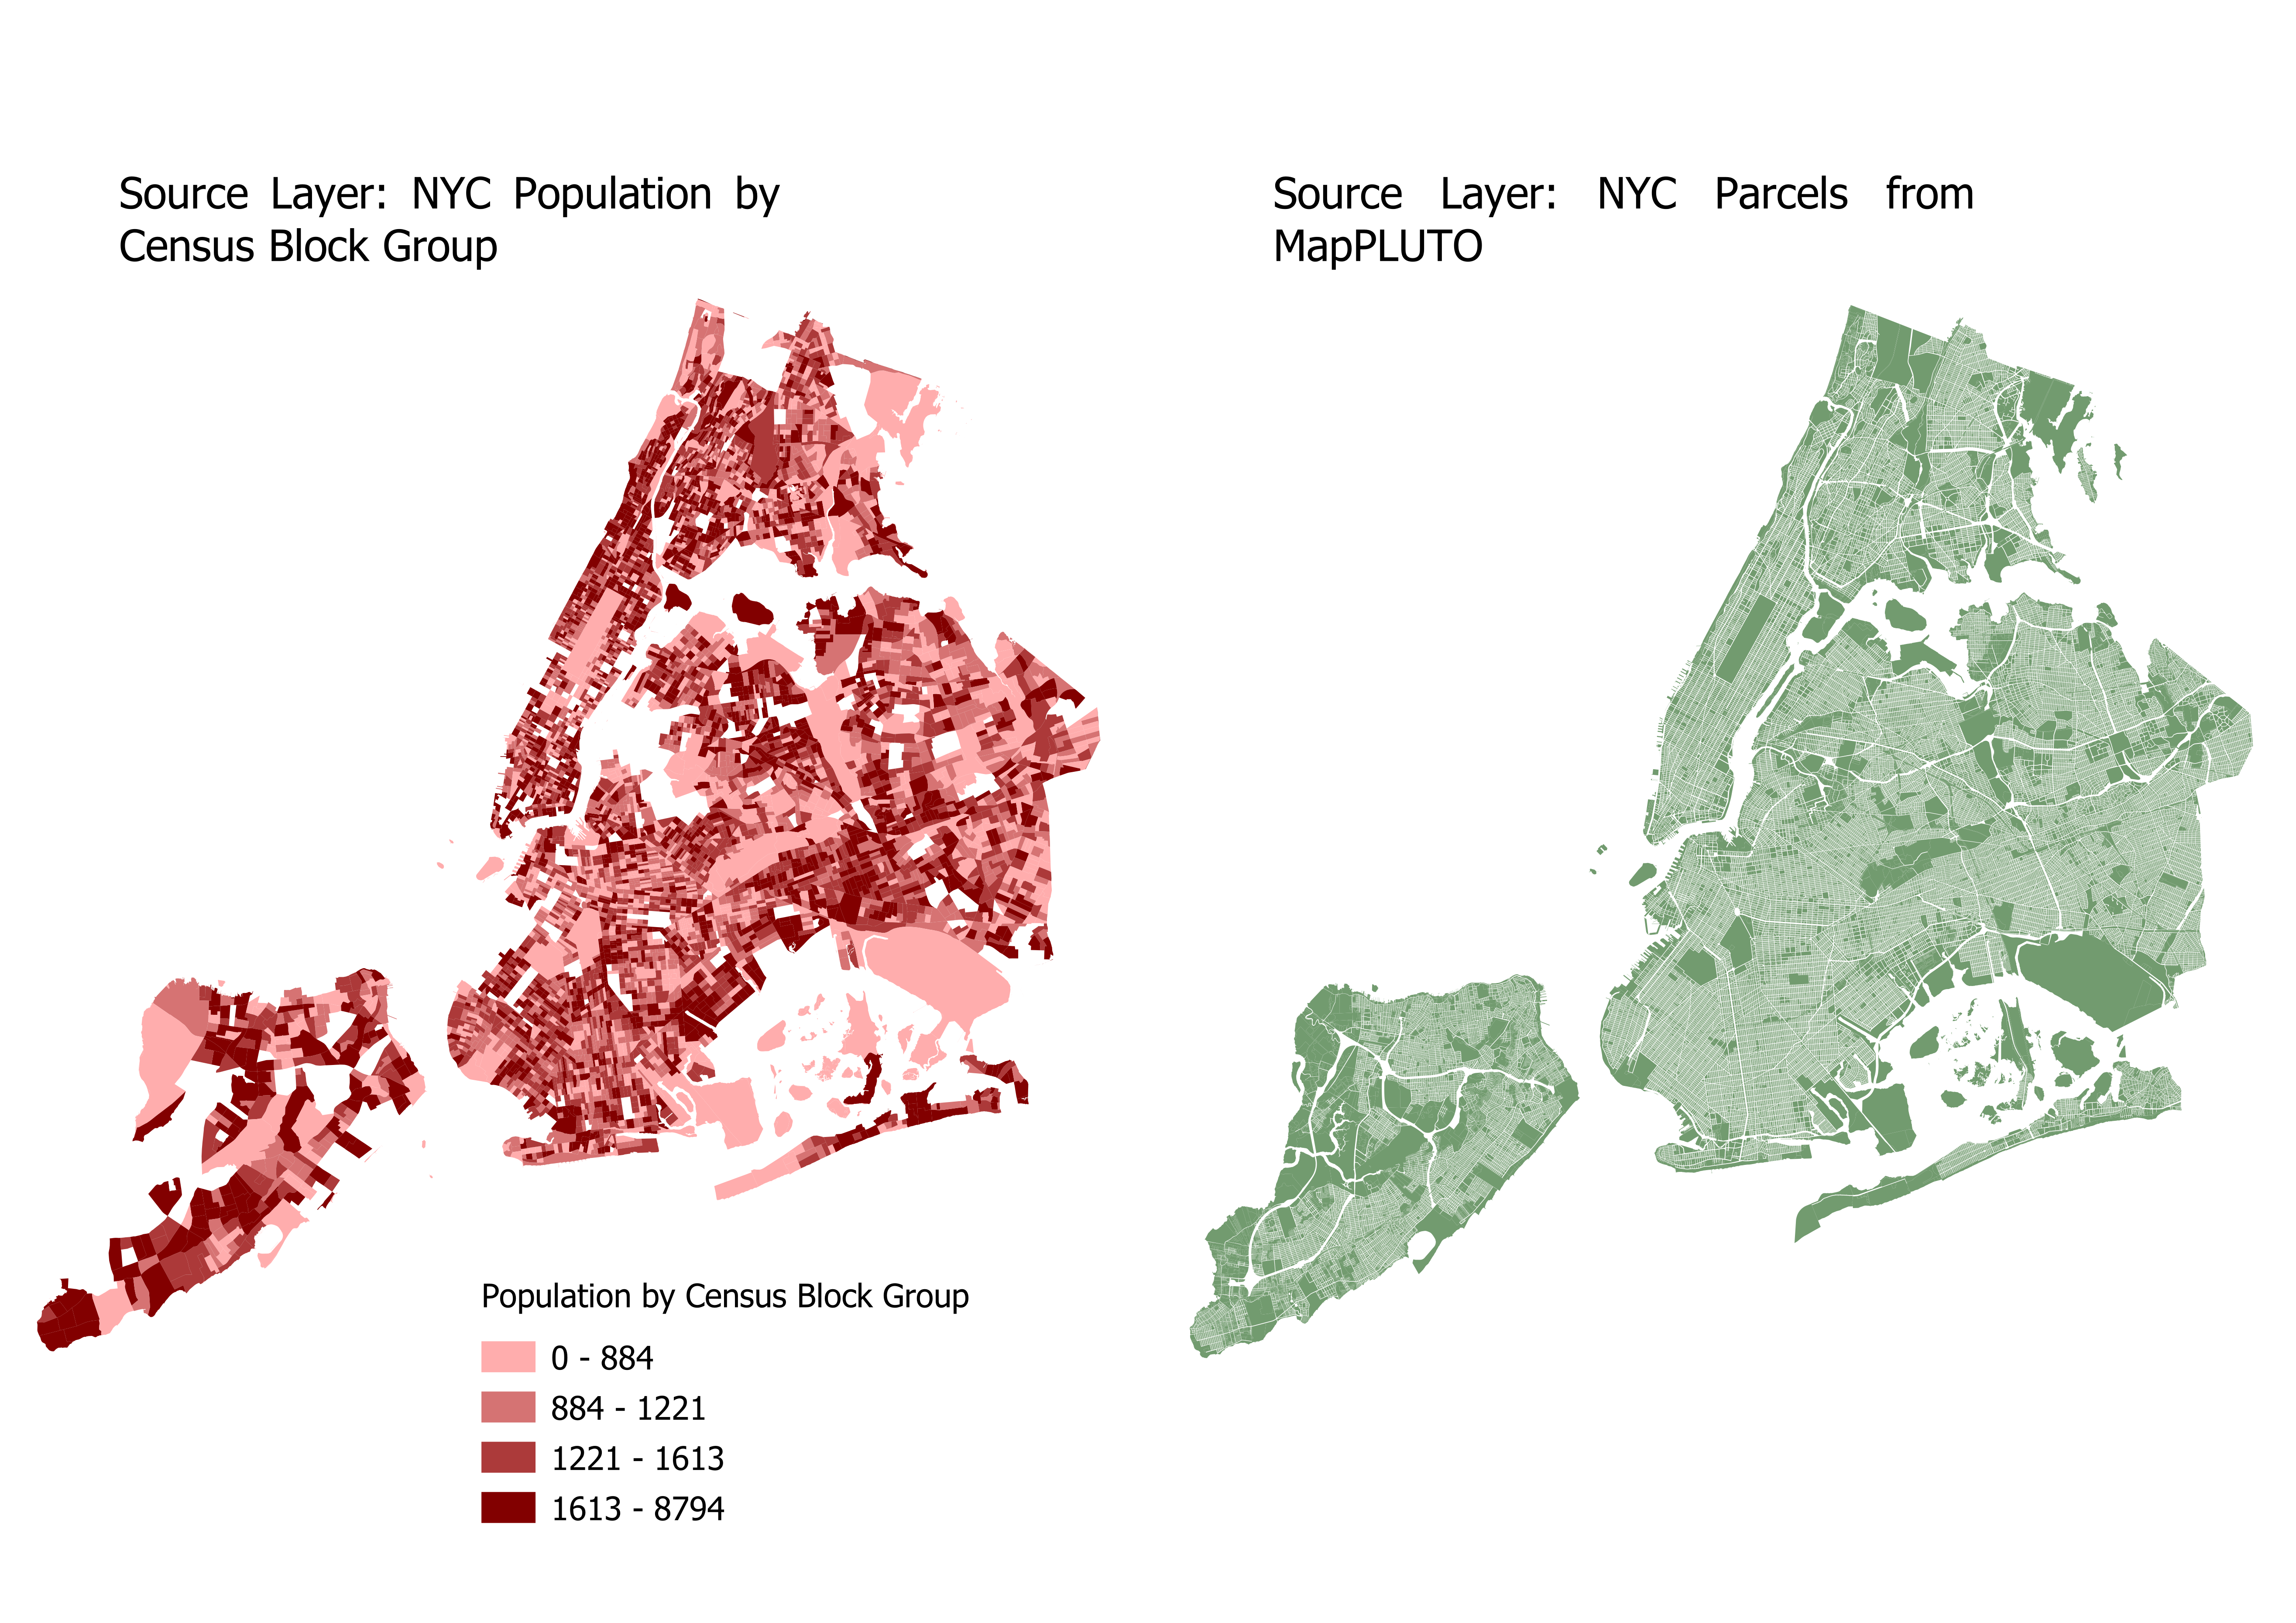
The data that we will be interpolating is population, which is currently aggregated in census block groups. Using the parcel method, the population can be disaggregated into individual parcels. Our inputs should look like this:
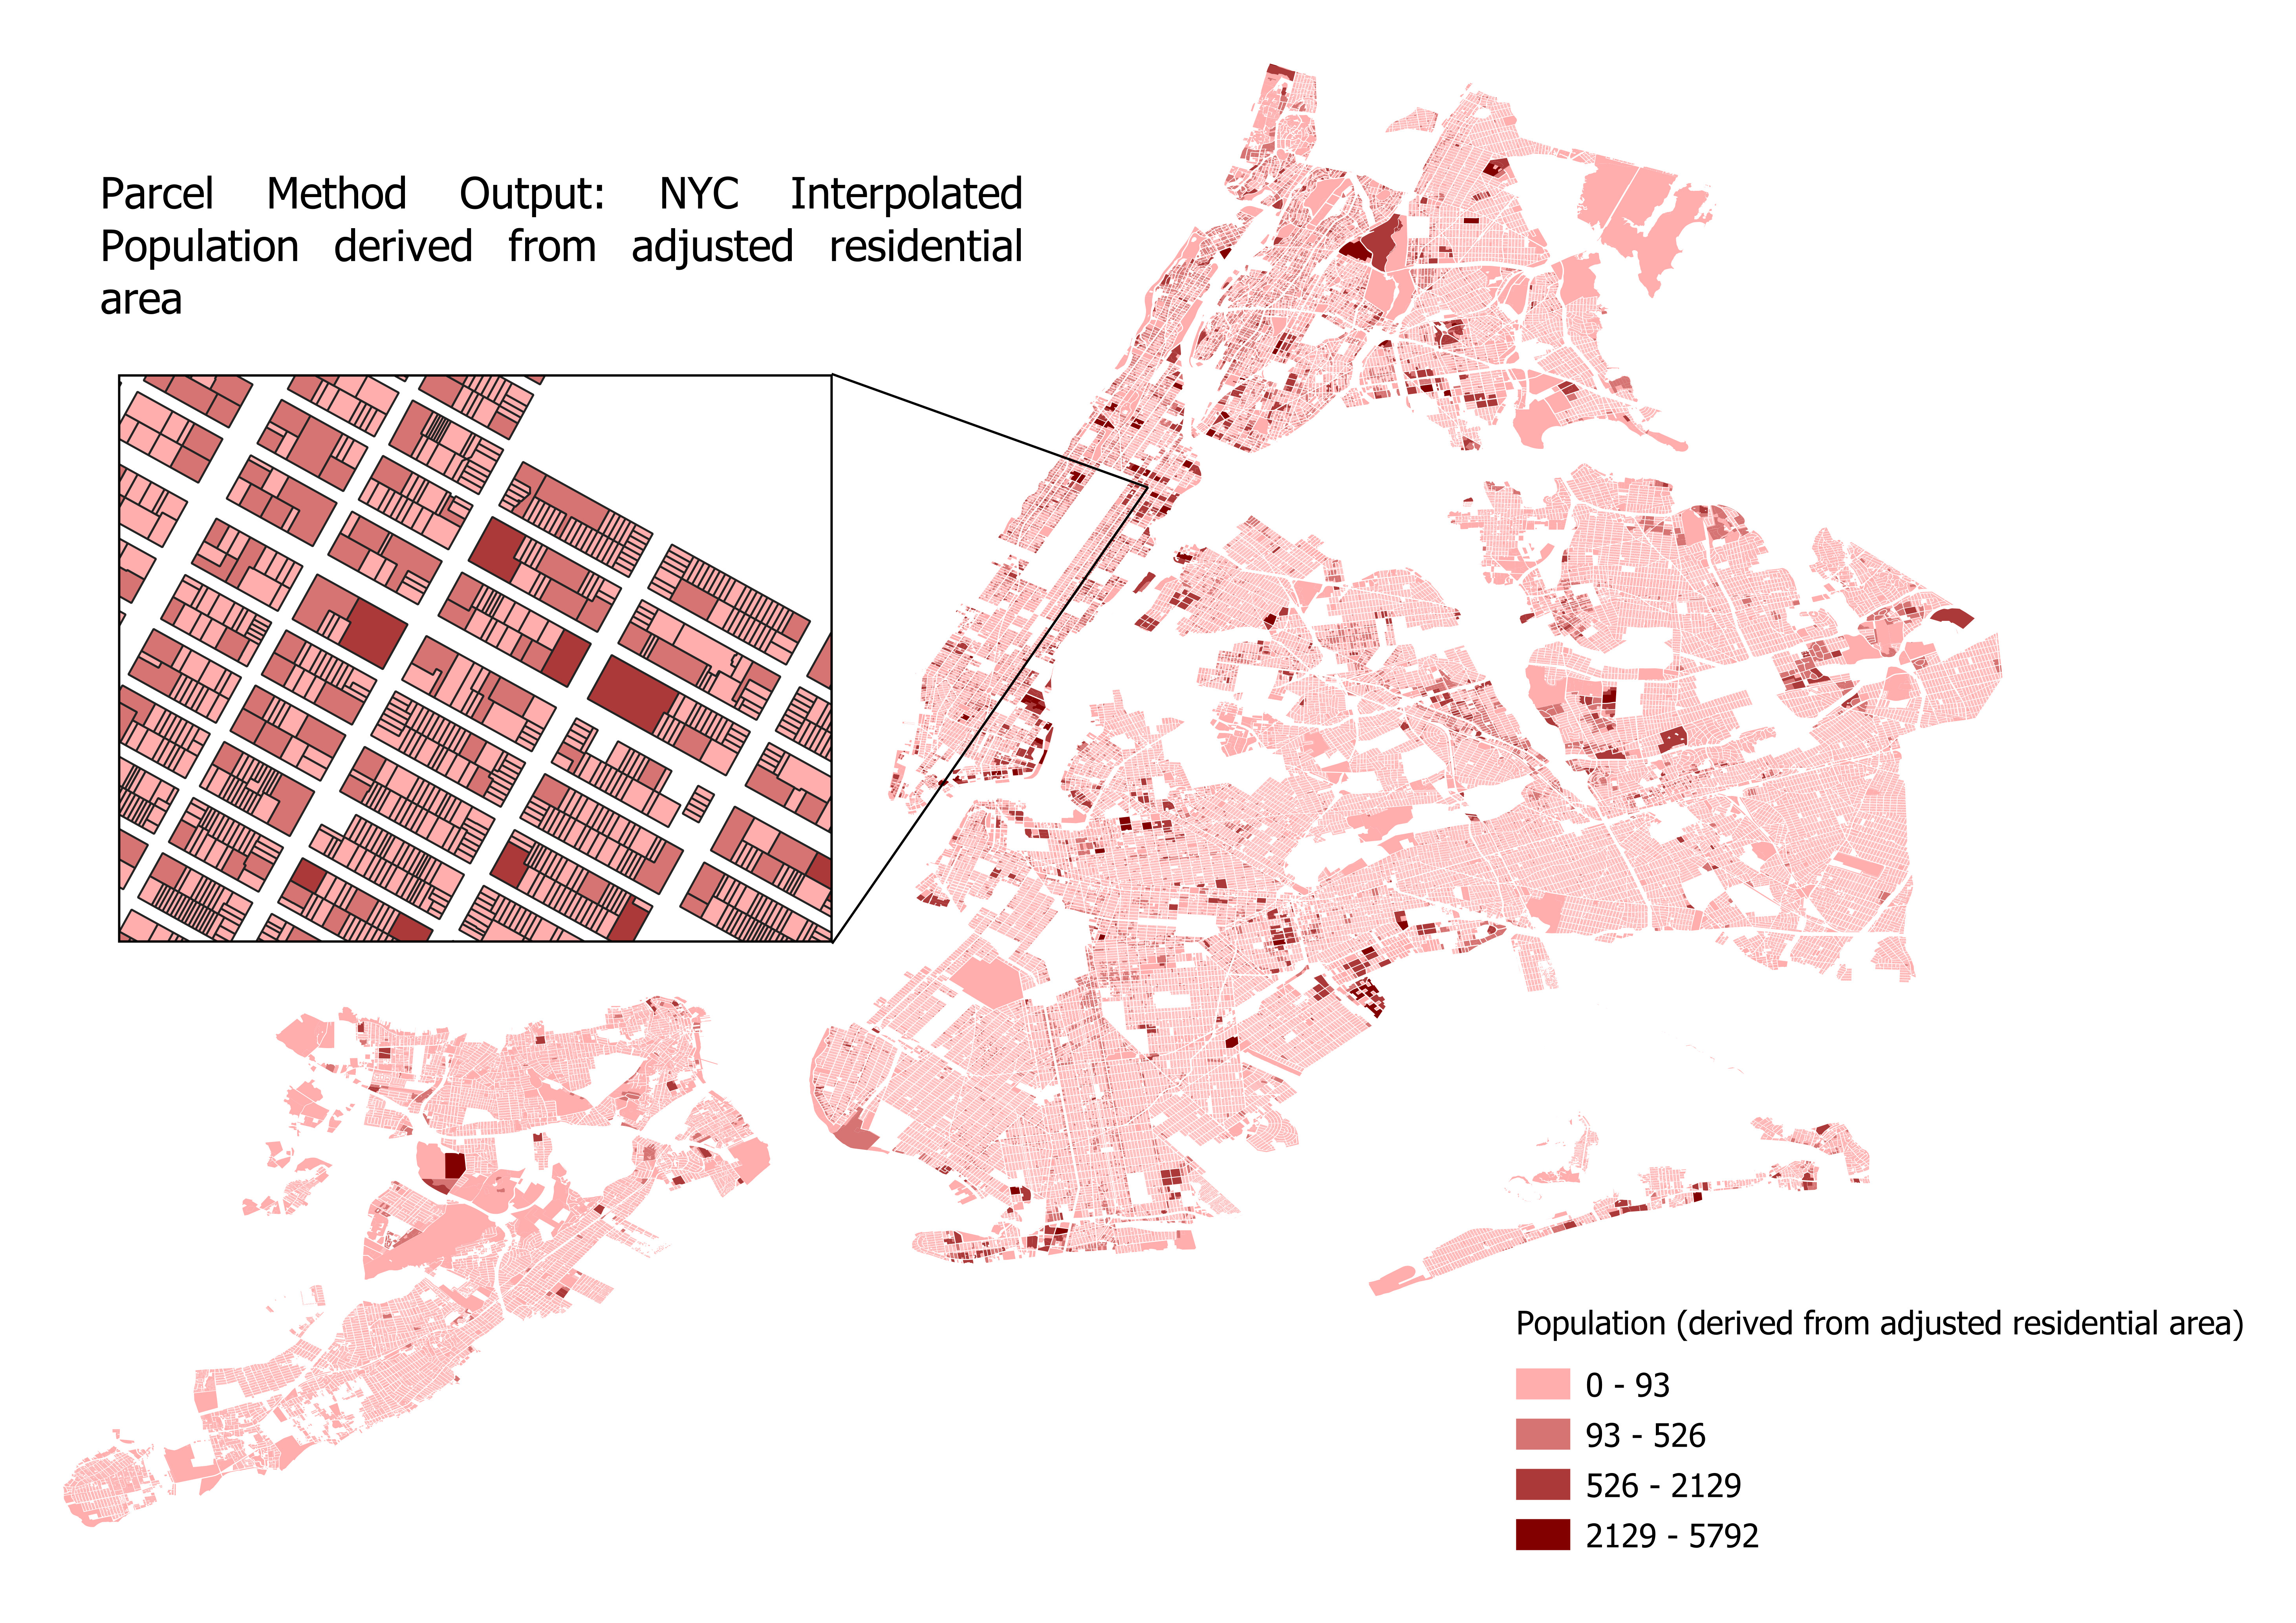
pypolate.parcel(block_group.df, parcels.df, 'UnitsTotal', 'UnitsRes', 'BldgArea', 'ResArea', [population])
The parcel method will interpolate population into two new columns which are calculated from different inputs. One of the new columns is named ara_derived (derived from adjusted residential area), and the other column is named ru_derived (derived from number of residential units). Below are the results of the parcel method, one map for each interpolation type:
Refining parcel method with the Cadastral-Based Expert Dasymetric System
Like the parcel method, we’ll be using census block groups containing population, and parcel data. In addition, we are also using a larger census zone DataFrame (which also contains population) that the smaller census zone nests inside, in this case census tracts.
The CEDS method works perfectly with census data, but theoretically will work with any two geographies that nest without intersecting.
Our input data will look like this if plotted:
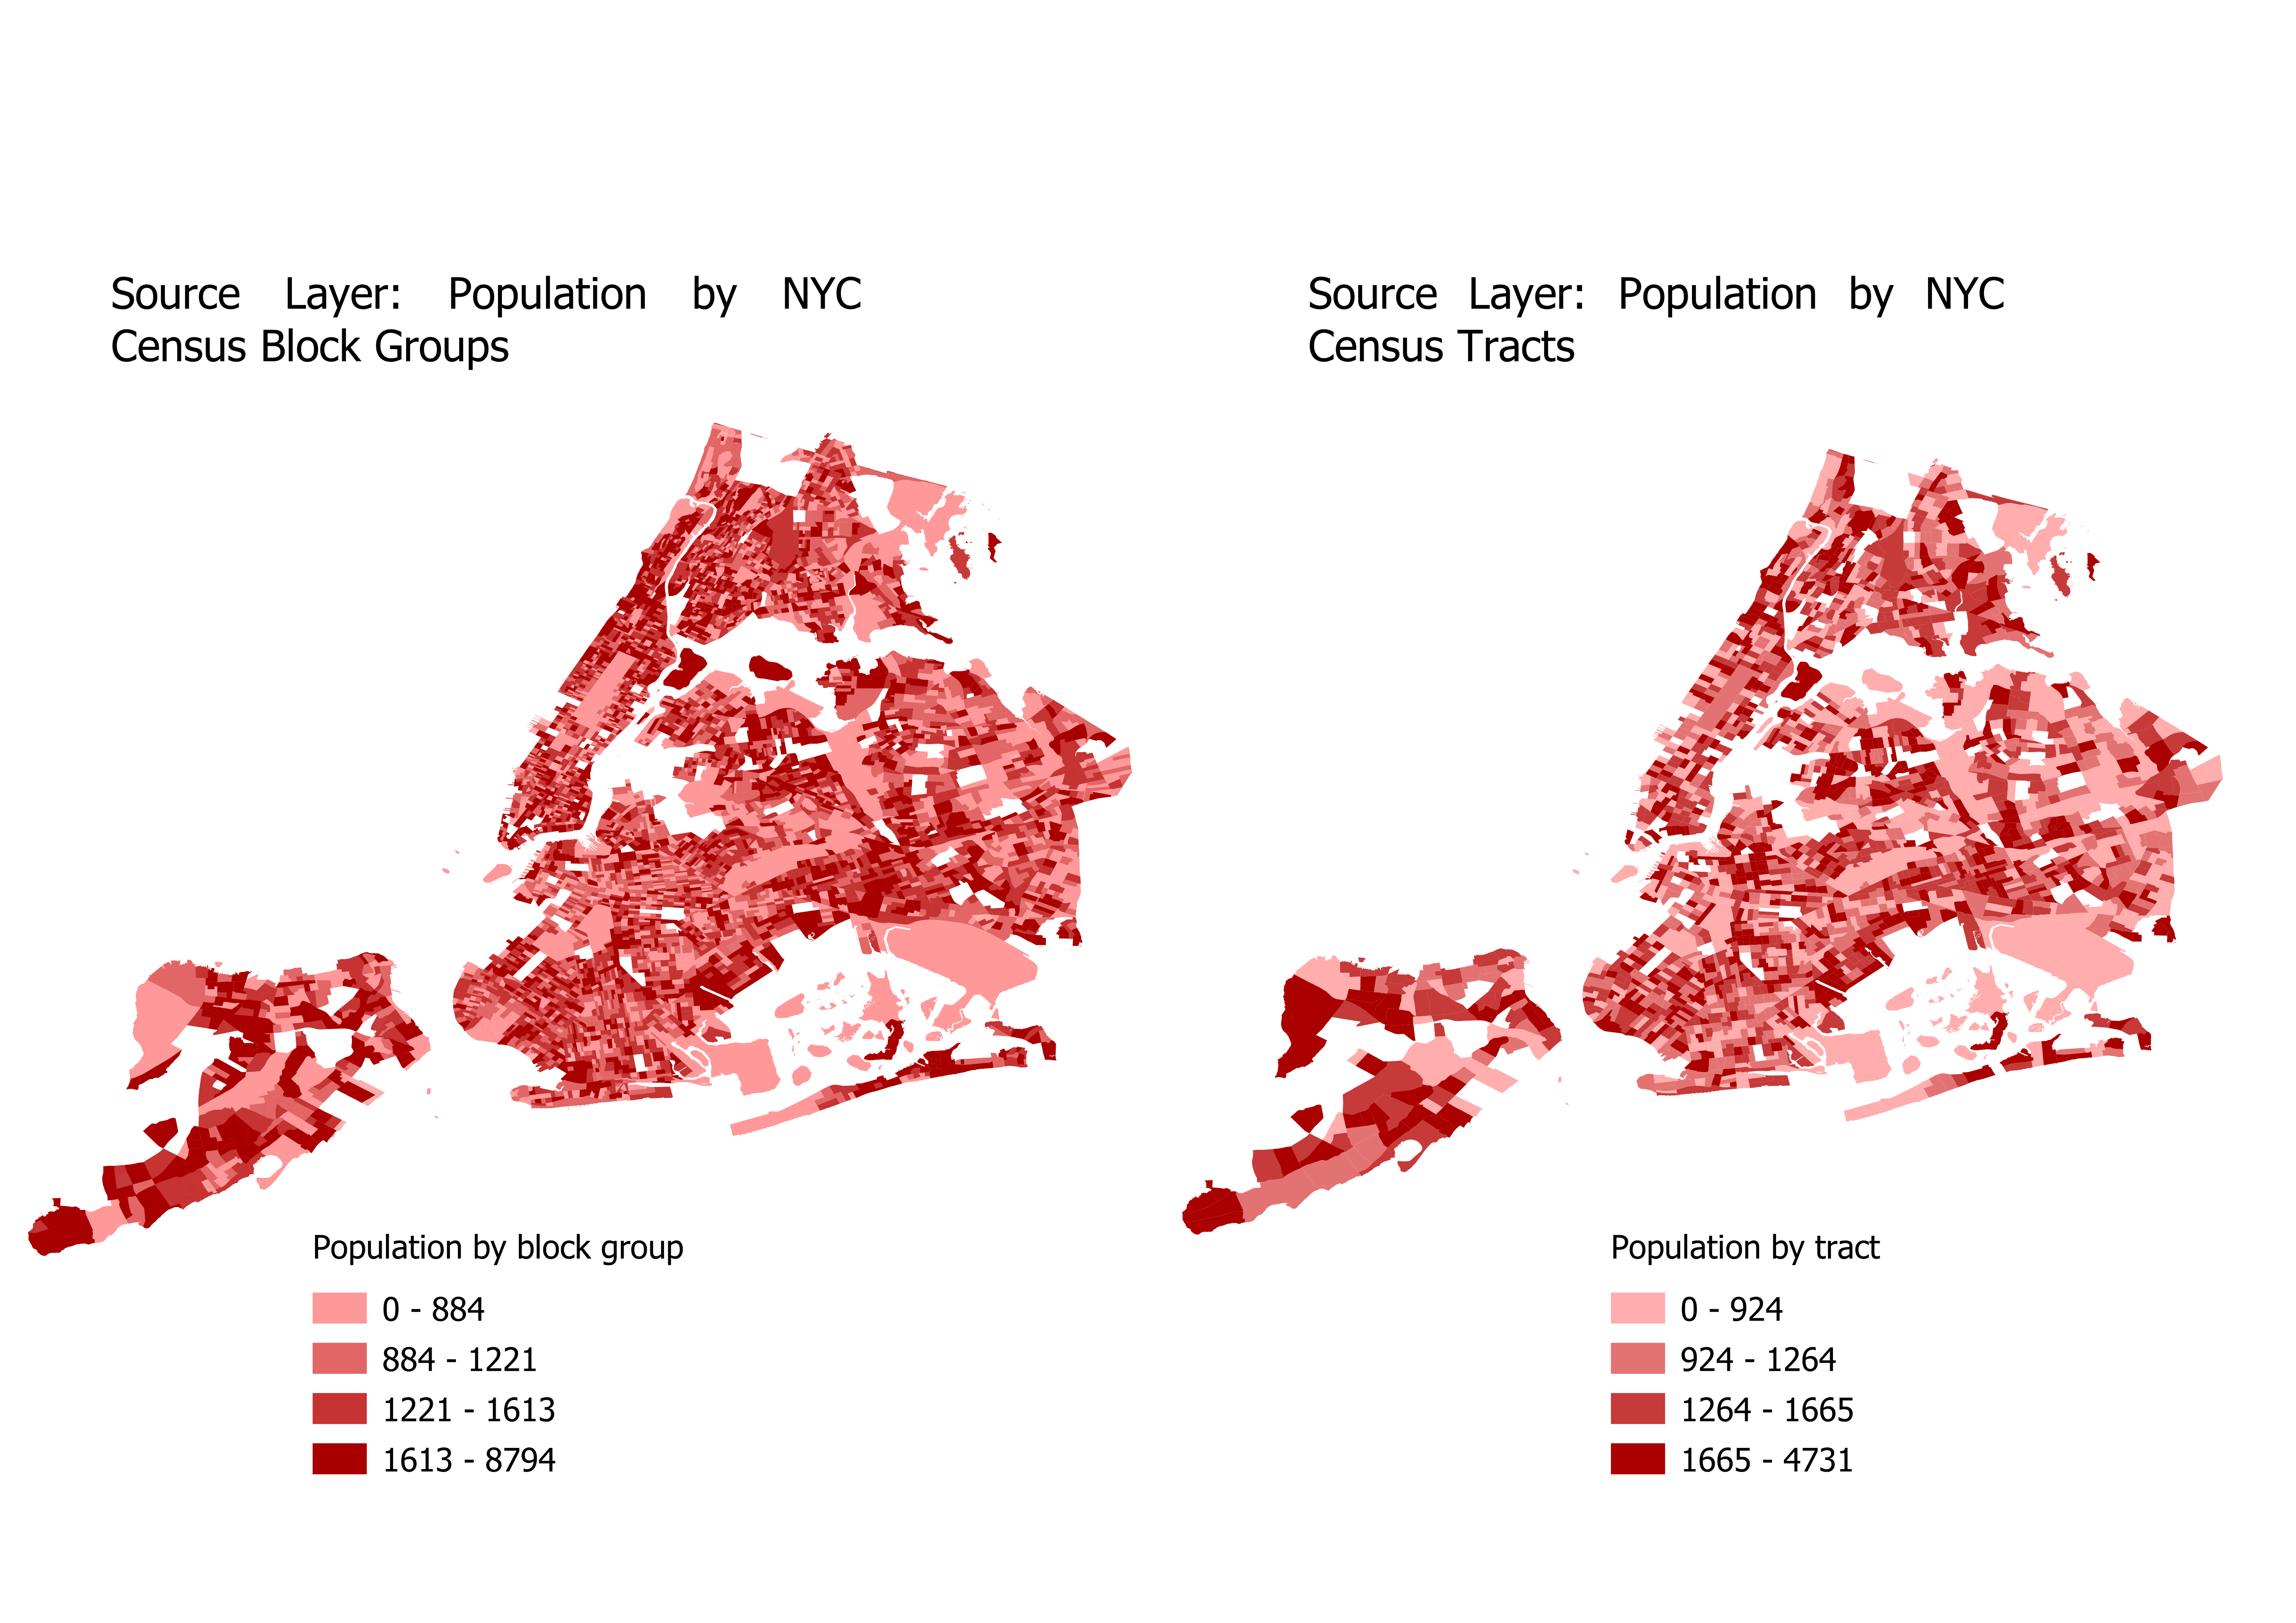
For our inputs, the columns that we are interpolating (population) needs to have the same column name in both source DataFrames (tracts and block groups). Other than that condition, the inputs for CEDS are very similar to the parcel method.
pypolate.expert(tracts.df, block_group.df, parcels.df, 'UnitsTotal', 'UnitsRes', 'BldgArea', 'ResArea', [population])
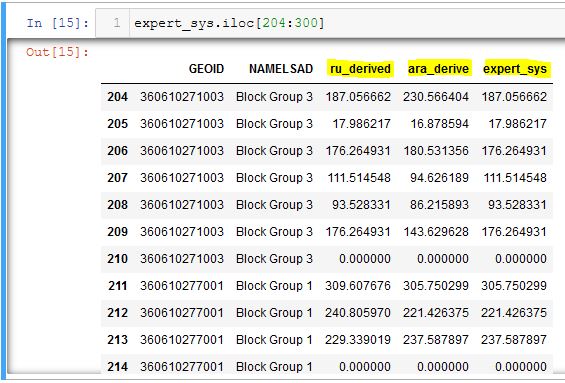
The mapped output of these inputs should look similar to this (the field expert_sys is mapped here):
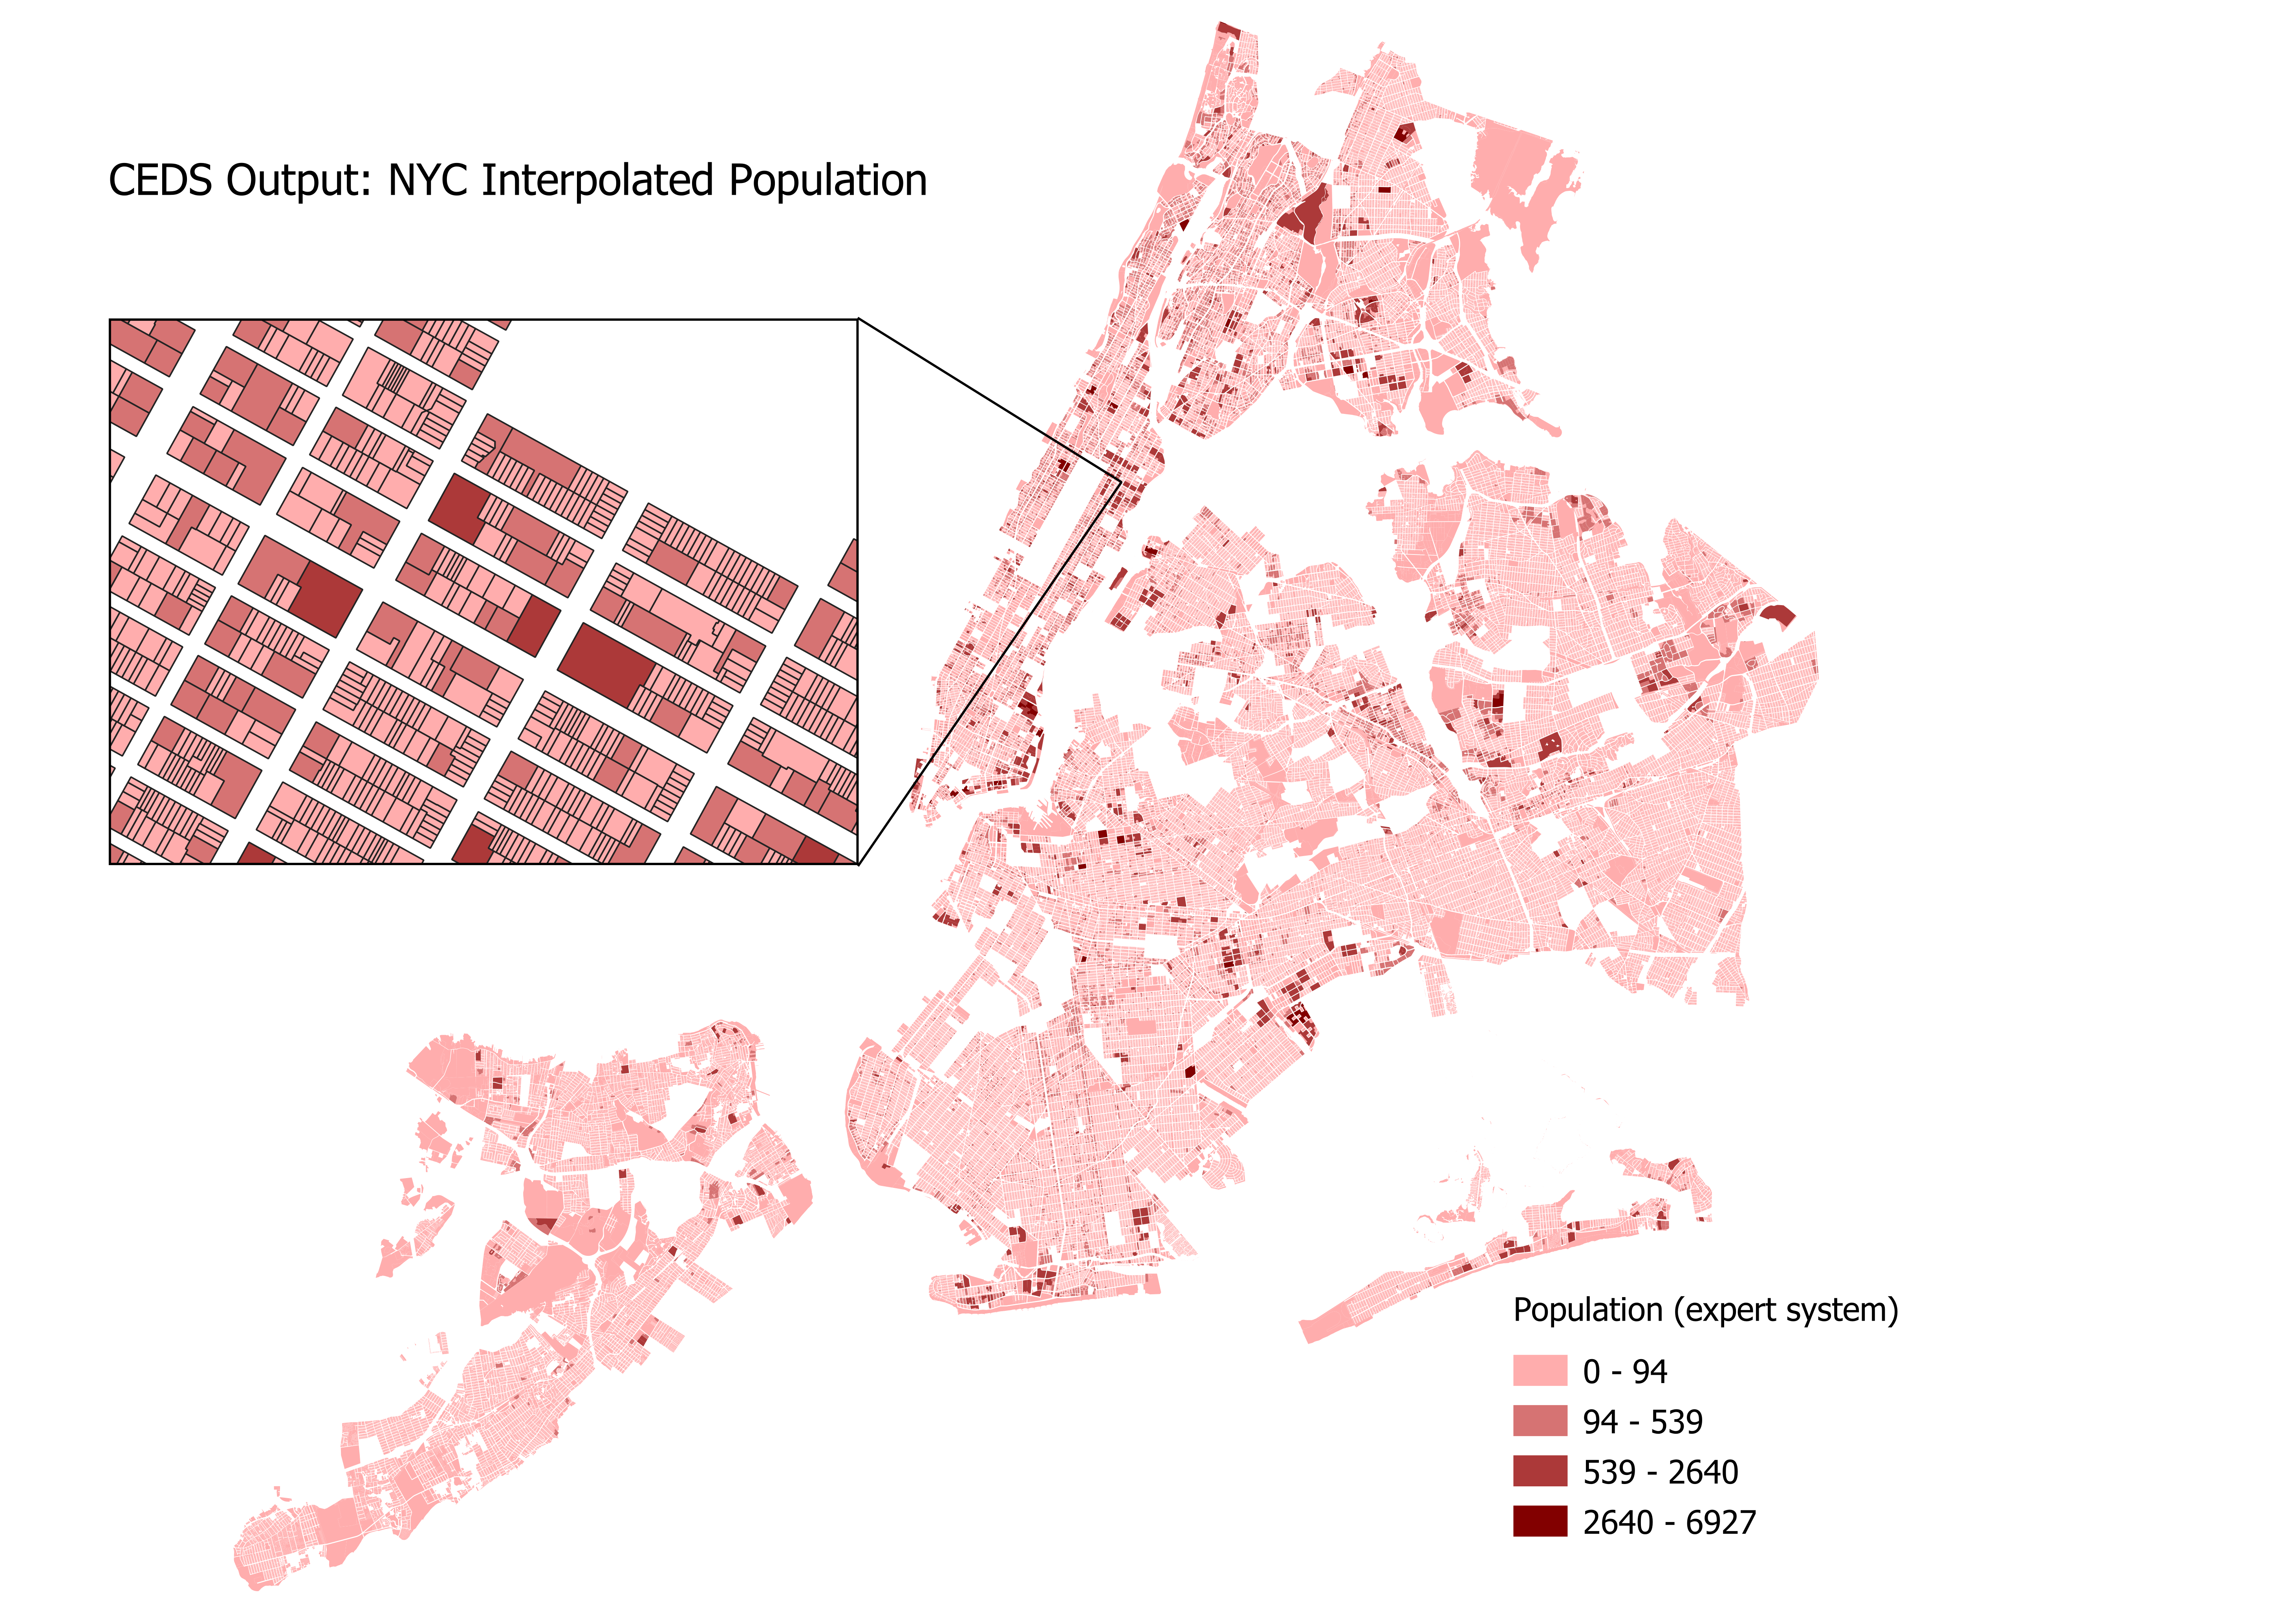
The dataframe that results from the CEDS method contains both the ru_derived and ara_derived interpolations for population, as well as a new field named expert_sys. As seen in the dataframe below, CEDS determines whether to use ru_derived or ara_derived to measure population, on a census block group basis. In Block Group 3 of GEOID 360610271003 CEDS chooses the ru_derived population, then chooses the ara_derived population for block group 1 of GEOID 360610277001.


Download files
Download the file for your platform. If you're not sure which to choose, learn more about installing packages.
Source Distribution
Built Distribution
Filter files by name, interpreter, ABI, and platform.
If you're not sure about the file name format, learn more about wheel file names.
Copy a direct link to the current filters
File details
Details for the file pypolate-0.0.5.tar.gz.
File metadata
- Download URL: pypolate-0.0.5.tar.gz
- Upload date:
- Size: 17.1 kB
- Tags: Source
- Uploaded using Trusted Publishing? No
- Uploaded via: twine/0.0.0 pkginfo/1.7.1 requests/2.25.1 setuptools/58.0.4 requests-toolbelt/0.9.1 tqdm/4.62.3 CPython/3.8.5
File hashes
| Algorithm | Hash digest | |
|---|---|---|
| SHA256 |
682f752a20098cad147bd5df1a7290d7423da6a35e2f7515b69cdafff51972af
|
|
| MD5 |
b08dfa9799b07bda6190f313b81a24d2
|
|
| BLAKE2b-256 |
1512caa3565f1497ec31b9676de48c1ccac07ead18aed1034c7876ae20ad26e3
|
File details
Details for the file pypolate-0.0.5-py3-none-any.whl.
File metadata
- Download URL: pypolate-0.0.5-py3-none-any.whl
- Upload date:
- Size: 19.5 kB
- Tags: Python 3
- Uploaded using Trusted Publishing? No
- Uploaded via: twine/0.0.0 pkginfo/1.7.1 requests/2.25.1 setuptools/58.0.4 requests-toolbelt/0.9.1 tqdm/4.62.3 CPython/3.8.5
File hashes
| Algorithm | Hash digest | |
|---|---|---|
| SHA256 |
210af075426aeae674fb9984e64656ab0a0e73fc7de97a656c6eb54c082cc3e9
|
|
| MD5 |
d233b8b546acf654f643bc3cab70beaf
|
|
| BLAKE2b-256 |
576ffc3425be6634436d5eab23d3538f0bfe0479e5ec6e6c63d9a7b4fcc57250
|


