Pytri, redux


Project description
pytri v2
A Pytri redux, using the latest available THREE.js bindings and GPU-offloaded rendering of large scenes.
WARNING: pytri is currently untested. Use at your own risk.
Installation
pip install pytri
# or:
# pip3 install git+https://github.com/aplbrain/pytri
Getting Started
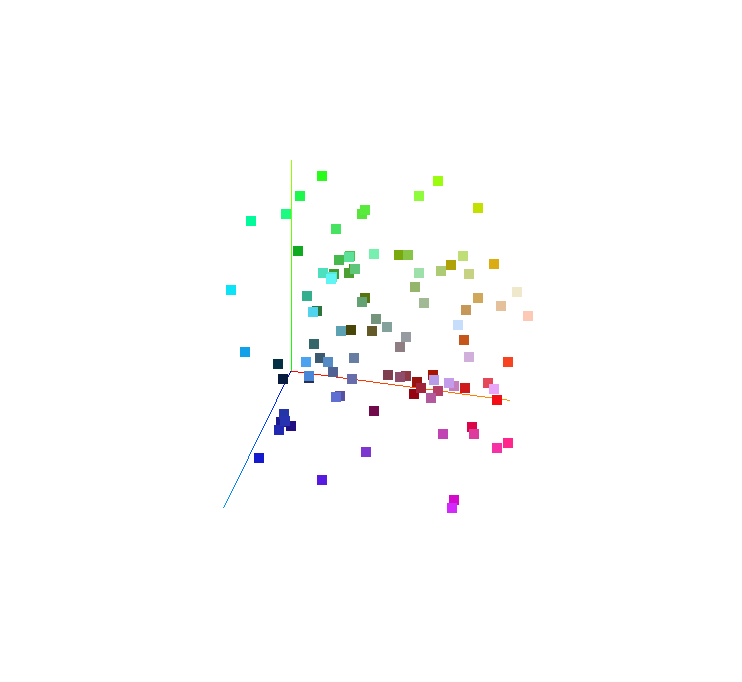
Let's plot some scatterplot data in 3D. In your favorite Jupyter notebook or binder application, import pytri:
from pytri import Figure
We can now generate some sample data:
import numpy as np

fig = Figure()

xs = np.random(0, 100)
ys = np.random(0, 100)
zs = np.random(0, 100)

fig.scatter(xs, ys, zs)

fig.show()
Examples
Render a NetworkX Graph
Here's a crazy dense randomly-arranged graph with over a million edges. (You'll find the slowest part of this process is just generating that graph!)
This graph renders in realtime (60FPS) in Pytri.
import networkx as nx
g = nx.fast_gnp_random_graph(50_000, 0.001)
pos = {k: [vv * 500 for vv in v] for k, v in nx.random_layout(g, dim=3).items()}

f = Figure()
f.axes()
f.graph(g, pos=pos, edge_width=1, node_size=10)

f.show()
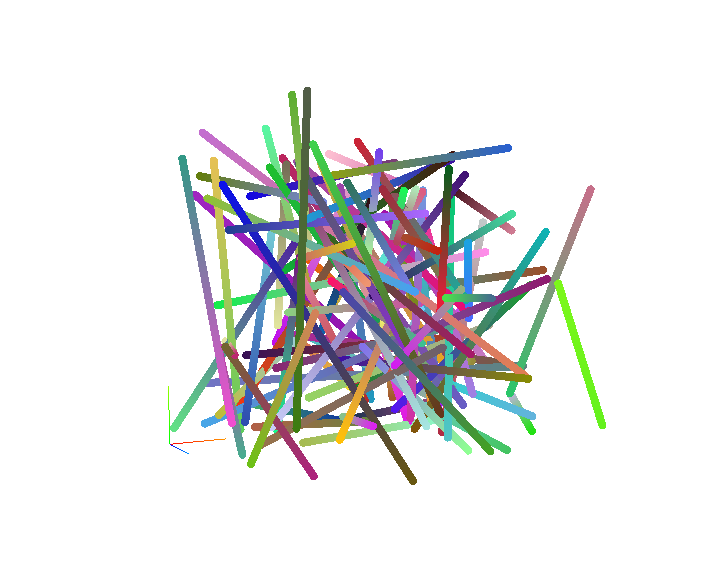
Random color-changing edges
These edges are a different color on the left edge than on the right edge:
f = Figure()
f.axes()
f.lines(
    # 100 lines on the interval 0-100
    np.random.random((100, 2, 3)) * 100,
    # 200 colors, start/stop for each line
    colors=np.random.random((100, 2, 3)),
    width=4
)
f.show()
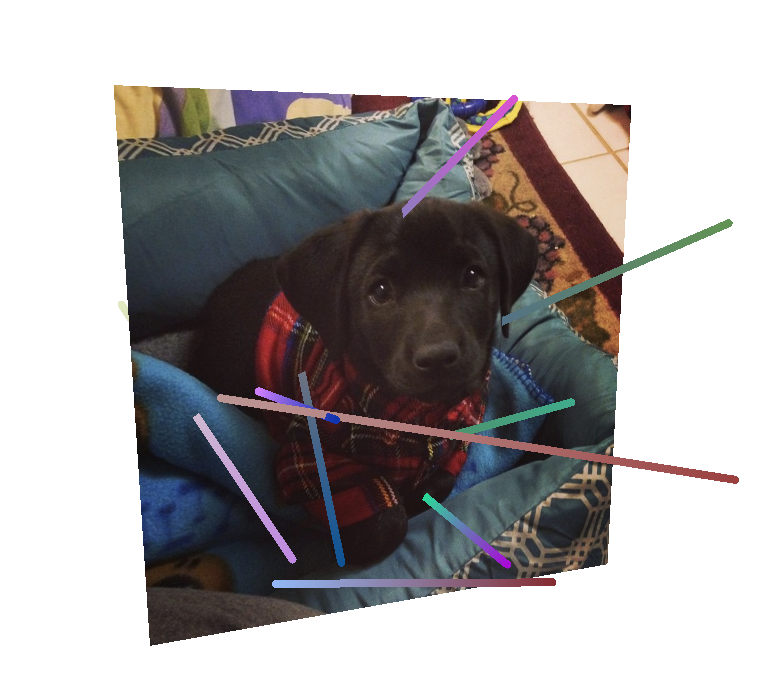
Lines and an image pulled from the internet
f.imshow(
    "https://i.imgur.com/VK8Tp5q.jpeg",
    width=100, height=100,
    rotation=(0, 3.14/2, 0)
)
f.show()
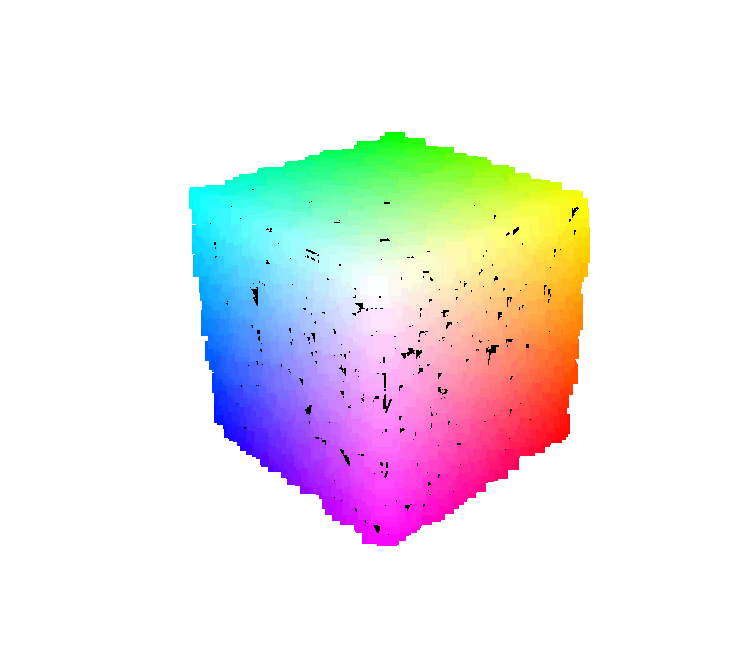
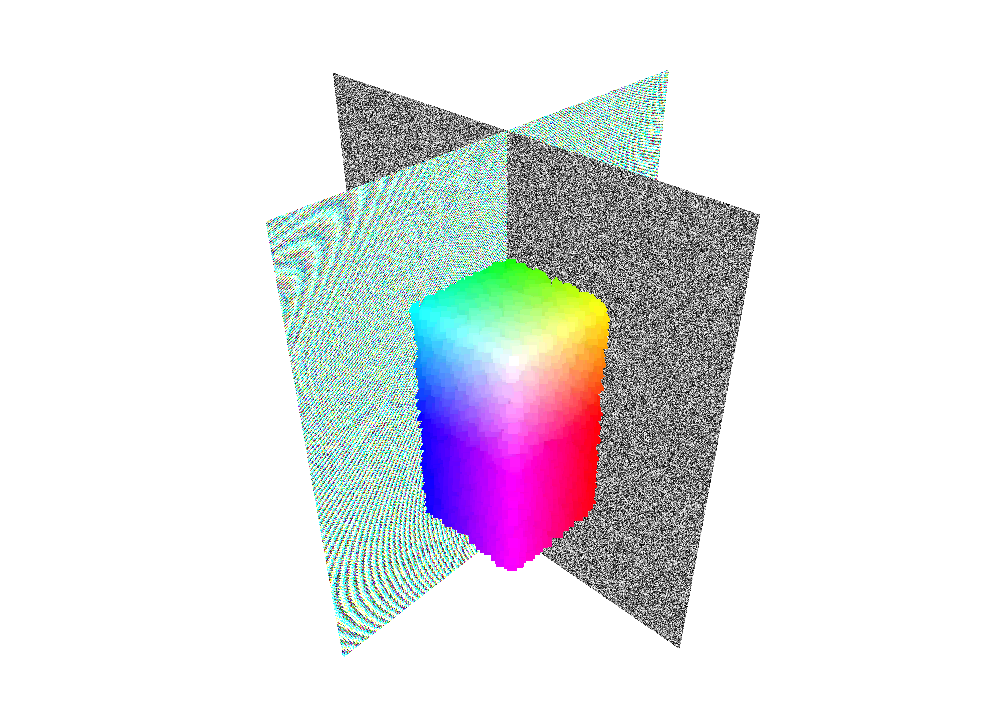
Rendering numpy arrays in RGB or Greyscale
f.scatter(np.random.randint(-50, 50, (1_00_000,3)))
f.imshow(
    # 3 dimensions, interpreted as RGB
    np.random.random((1000, 1000, 3)),
    width=200, height=200,
    rotation=(0, 3.14/2, 0)
)
f.imshow(
    # 2 dimensions, interpreted as grayscale
    np.random.random((1000, 1000)),
    width=200, height=200,
    # omitting rotation, the plane faces "up" along Z
)
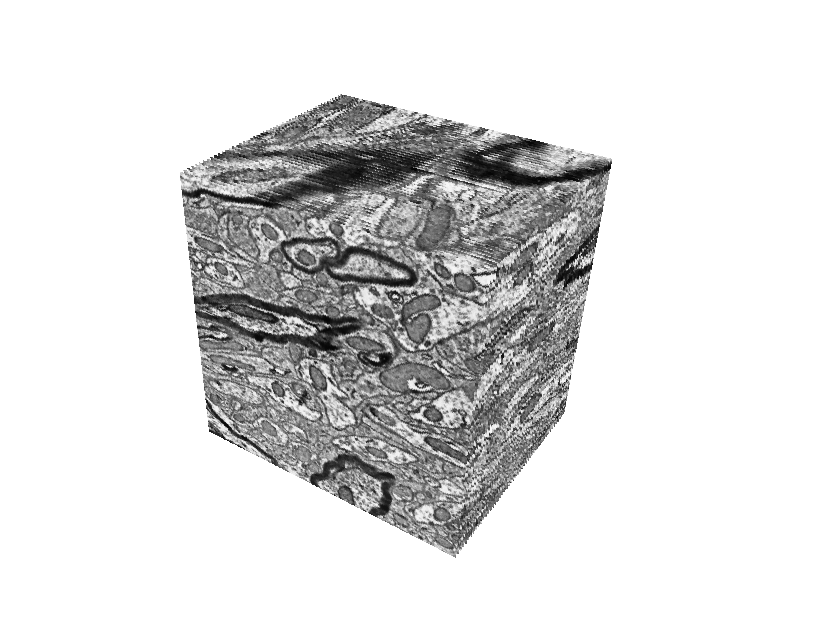
One way to (cheat) render a volume
from pytri import Figure
import intern

morgan2020 = intern.array("bossdb://morgan2020/lgn/em", resolution=2)

em_excerpt = morgan2020[1000:1050, 25000:25000+300, 25000:25000+300]

coords = []
for z in range(small.shape[0]):
    for y in range(small.shape[1]):
        for x in range(small.shape[2]):
            coords.append((x, y, z*10))

f = Figure()
f.scatter(coords, color=[[i,i,i] for i in small.ravel()], attenuate_size=True, size=5)
f.show()
Release history Release notifications | RSS feed


Download files
Download the file for your platform. If you're not sure which to choose, learn more about installing packages.
Source Distribution
File details
Details for the file pytri-2.0.1.tar.gz.
File metadata
- Download URL: pytri-2.0.1.tar.gz
- Upload date:
- Size: 21.0 kB
- Tags: Source
- Uploaded using Trusted Publishing? No
- Uploaded via: twine/3.2.0 pkginfo/1.6.1 requests/2.23.0 setuptools/41.2.0 requests-toolbelt/0.9.1 tqdm/4.61.0 CPython/3.7.7
File hashes
| Algorithm | Hash digest | |
|---|---|---|
| SHA256 |
63c2c5348c6c9bd6c8b447b6c7b15d626f4e06536e357d4be9775c0bb665ef51
|
|
| MD5 |
40b47ea450b4a43db5390f6224c8c4da
|
|
| BLAKE2b-256 |
0faba5c6b4796a56d1406aa7506c60ab8855654bb3e75cd1da26c7d461f5f285
|


