A Quick Histogram drawer for `ROOT::TTree` for smoother HEP analysis!
Project description
QHist
QHist -- A Quick Histogram drawer for ROOT::TTree for smoother HEP analysis!
Examples (click arrow to view output):
Simple draw from tree and parameter (branch name)
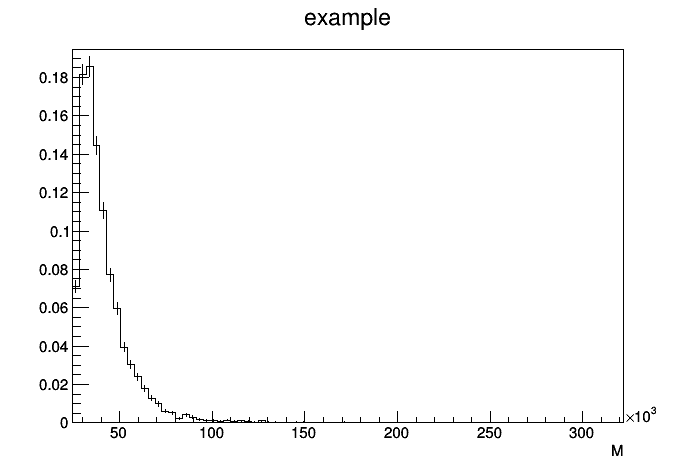
>>> h1 = QHist()
>>> h1.trees = t1
>>> h1.params = 'M'
>>> h1.draw()
Overlaid comparison between branches, compact syntax
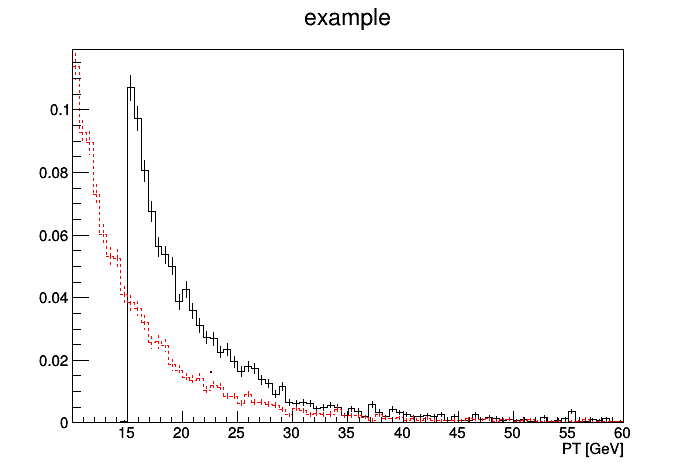
>>> QHist(trees=t1, params=['mu_PT/1e3','pi_PT/1e3'], xlabel='PT [GeV]', xmax=60).draw()
Compare between trees, with filtering, and reusable via templating.
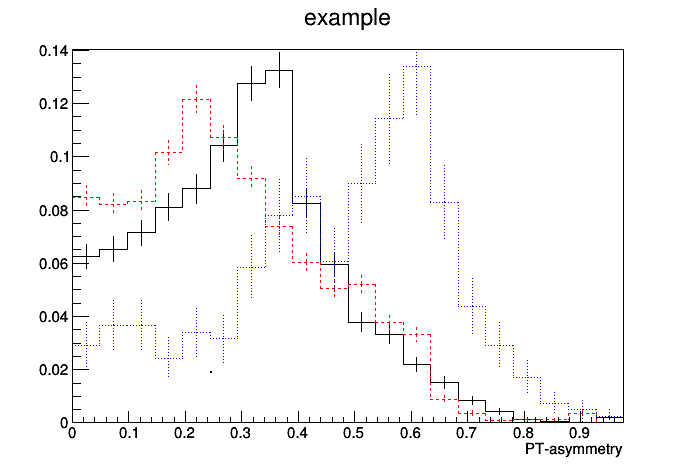
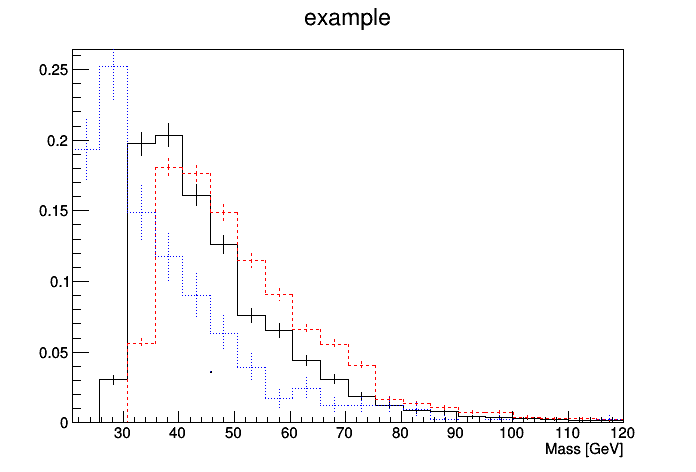
>>> H = QHist(trees=[t1, t2, t3], filters=['mu_PT>20e3'])
>>> H(params='APT'  , xmin=0  , xlabel='PT-asymmetry').draw()
>>> H(params='M/1e3', xmax=120, xlabel='Mass [GeV]').draw()
Installation & dependencies
It's available from pip install qhist.
The package requires an existing installation of PyROOT.
Disclaimer
This packacge was written and used during my PhD in 2013-2017 at EPFL (Lausanne) and LHCb collaboration (CERN), for the work in Z->tau tau cross-section measurement and H->mu tau searches at LHCb (8TeV). I hope it can be of a good use for future analysis...
Introduction: TPC & comparison stack
To draw a histogram in ROOT, generally a triplet of information
(tree, param, cut) is needed. I call this TPC. The general command is:
tree->Draw("param", "cut")
In QHist, this is reorganized as:
h = QHist()
h.trees  = tree     # mandatory <ROOT.TTree>
h.params = "param"  # mandatory <string>
h.cuts   = "cut"    # optional  <string>
h.draw()
The instance of QHist can be considered as a struct of information to
be attached onto before the call draw().
Once draw() is called, the output will be saved automatically
(see section below for more detail).
The QHist instance will be frozen and should not be used again.
By default, there's no need to explicitly give the axis information (min, max, number of bins), this is handle automatically.
Comparison stack means attaching more elements (list) to the desired field. For example, attaching more params from the same tree can be used to compare between branches:
h = QHist()
h.trees  = tree
h.params = 'muon_PT', 'pion_PT', 'kaon_PT'
h.draw()
or multiple trees of same param (branch):
h = QHist()
h.trees  = t1, t2, t3
h.params = 'tau_M'
h.draw()
or comparing different cuts operating on the same tree's branch:
h = QHist()
h.trees  = t1
h.params = 'mu_PT'
h.cuts   = 'mu_Q > 0', 'mu_Q < 0'
h.draw()
Note that in all cases of stack above, the axis information also handle automatically using sensible default (i.e., axis min is the minimum of all entries, etc.)
It's forbidden to assign multiple variables on more than one of the TPC field at once.
In case one wants to stack a branch of one tree, against another branch of
another tree, a more advance field tpc should be used instead:
h = QHist()
h.tpc = [ (t1, p1, c1), (t2, p2, c2) ]
h.draw()
Note that in this case, a complete triplet TPC should be given in order to
avoid ambiguity of missing component. If this mode of assignment is used,
the simpler fields (trees, params, cuts) are disabled, and vice-versa.
In many case, this style of complex field can be avoided by using
TTree.SetAlias appropriately, for example:
t1.SetAlias('some_figure_of_merit1', 'FOM')
t2.SetAlias('some_figure_of_merit2', 'FOM')
h = QHist()
h.trees = t1, t2
h.params = 'FOM'
h.draw()
Features
Compact syntax
The compact syntax passes the arguments into the constructor instead of assignment on the instance. For example, these two instances are completely identical:
## expended version
h1 = QHist()
h1.trees = t1
h1.params = 'mu_PT'

## compact version
h2 = QHist(trees=t1, params='mu_PT')
The usage of compact syntax becomes more evident in templating, see the section below.
(safe) static assignment
All attributes are static, in a sense that once it's assigned, it can no
longer be changed. This ensures that you get the histogram you wanted,
with no interference:
>>> h = QHist(cuts='c1')
>>> h.cuts = 'c2'
Traceback (most recent call last):
...
AttributeError: Attribute "cuts" already set to ('c1',)
Also no-ducktyping, so that you're confident that you're using the correct field:
>>> QHist(cut='c1')
Traceback (most recent call last):
...
AttributeError: 'QHist' object has no attribute 'cut'
It's also type-safe: each field expect the correct argument type.
>>> QHist(trees=42, params=None)
Traceback (most recent call last):
...
TypeError: Required type (<class 'ROOT.TTree'>,)...
The list of fields are the following:
| Category | Fields |
|---|---|
| Core | trees, params, cuts, tpc |
| Computation | filters, normalize, option, postproc |
| Axis | xmin, xmax, xbin, xlog, xlabel,ymin, ymax, ybin, ylog, ylabel,zmin, zmax, zbin, zlog, zlabel, |
| Styles | st_code, st_color, st_line, st_marker, st_fill |
| Output | name, title, prefix, suffix, batch, auto_name |
| Others | legends, comment |
In addition, calling print on the qhist instance will show values in all fields.
-------------------qhist.v3.lifecycle.QHist @ 0x7fce7bca4bb0--------------------
        KEY       |   VALUE  ( * differs from default )
anchors           | * ---------------------qhist.v3.anchors.Anchors @ 0x10ee70cf8---------------------
                  |           KEY       |   VALUE  ( * differs from default )
                  |   canvas            |   None
                  |   debug             |   None
                  |   debugpad          |   None
                  |   legend            |   None
                  |   legendpad         |   None
                  |   mainpad           |   None
                  |   stack             |   None
                  |   --------------------------------------------------------------------------------
auto_name         |   None
batch             |   None
comment           |   ''
cuts              |   []
debug_messages    | *
dim               |   0
filename          |   None
filters           |   []
guessname         |   None
has_name          |   False
height_debug_conso|   60
height_legend_cons|   15
is_advance_stack  |   False
is_profile        |   False
is_simple_stack   |   False
legends           |   None
name              | * temp_20180406_155210991668
normalize         |   ()
option            |   ''
params            |   []
postproc          |   None
prefix            |   None
st_code           |   None
st_color          |   None
st_fill           |   None
st_line           |   None
st_marker         |   None
stats             |    len=0 nbin=None X=[None, None]
suffix            |   None
timestamp         | * 20180406_155210991668
title             | * temp_20180406_155210991668
tpc               |   []
trees             |   []
wrapper           |   EXCEPTION
xarr              |   None
xbin              |   None
xlabel            |   ''
xlog              |   None
xmax              |   None
xmin              |   None
yarr              |   None
ybin              |   None
ylabel            |   ''
ylog              |   None
ymax              |   None
ymin              |   None
zbin              |   None
zlabel            |   ''
zlog              |   None
zmax              |   None
zmin              |   None
--------------------------------------------------------------------------------
Different histogram types
QHist support several of histogram types following the same syntax as TTree::Draw:
| Type | ROOT.TTree.Draw |
QHist |
|---|---|---|
TH1 |
tree.Draw('param') |
h.params = 'param' |
TH2 |
tree.Draw('Y:X') |
h.params = 'Y:X' |
TH3 |
tree.Draw('X:Y:Z') |
h.params = 'X:Y:Z' |
TProfile |
tree.Draw('Y:X', '', 'prof') |
h.params = 'Y:X', h.option = 'prof' |
However, comparison stacking is only supported in TH1, TProfile,
and partially for TH2.
Cosmetic controls
Axis
The axis control used to be buried deep in each TAxis instance,
and not so easy to change without good understanding of drawing lifecycle.
For QHist, the following fields are exposed. They are normally tried to be
determined automatically, but the user can always set it explicitly:
h = QHist()
h.xmin = 20         # (float) axis minimum
h.xmax = 100        # (float) axis maximum
h.xbin = 10         # (int)   number of bins on axis
h.xlog = True       # (bool)  should the axis be on log scale or not.
h.xlabel = 'mass'   # (str)   Label on the axis.
There are same fields for Y-axis (ymin, ymax, ...) and Z-axis (zmin, zmax, ...).
This unifies the usage whether the histogram is TH1 or TH2.
Legends
By default, the legends are tried to be determined from the given stack. Otherwise it can be set explicitly from list of string, with the same number as stacking entries.
h = QHist(trees=[t1,t2])
h.legends = 'Z -> tautau', 'Z -> mumu'
Styling: (Line, Marker)-(Width, Size, Color, Style)
QHist exposes the following boolean-attribute to control more cosmetics
-
st_color: If True, turn on the color, apply toLineColor,MarkerColor,FillColor. The color rotation followsROOT.TColor.GetColorPalette. -
st_line: If True, turn on theLineStyle. The rotation style is hard-coded for now. -
st_marker: If True, turn on theMarkerStyle. The rotation style is hard-coded for now. -
st_fill: If True, turn on theFillStyle. The rotation style is hard-coded for now.
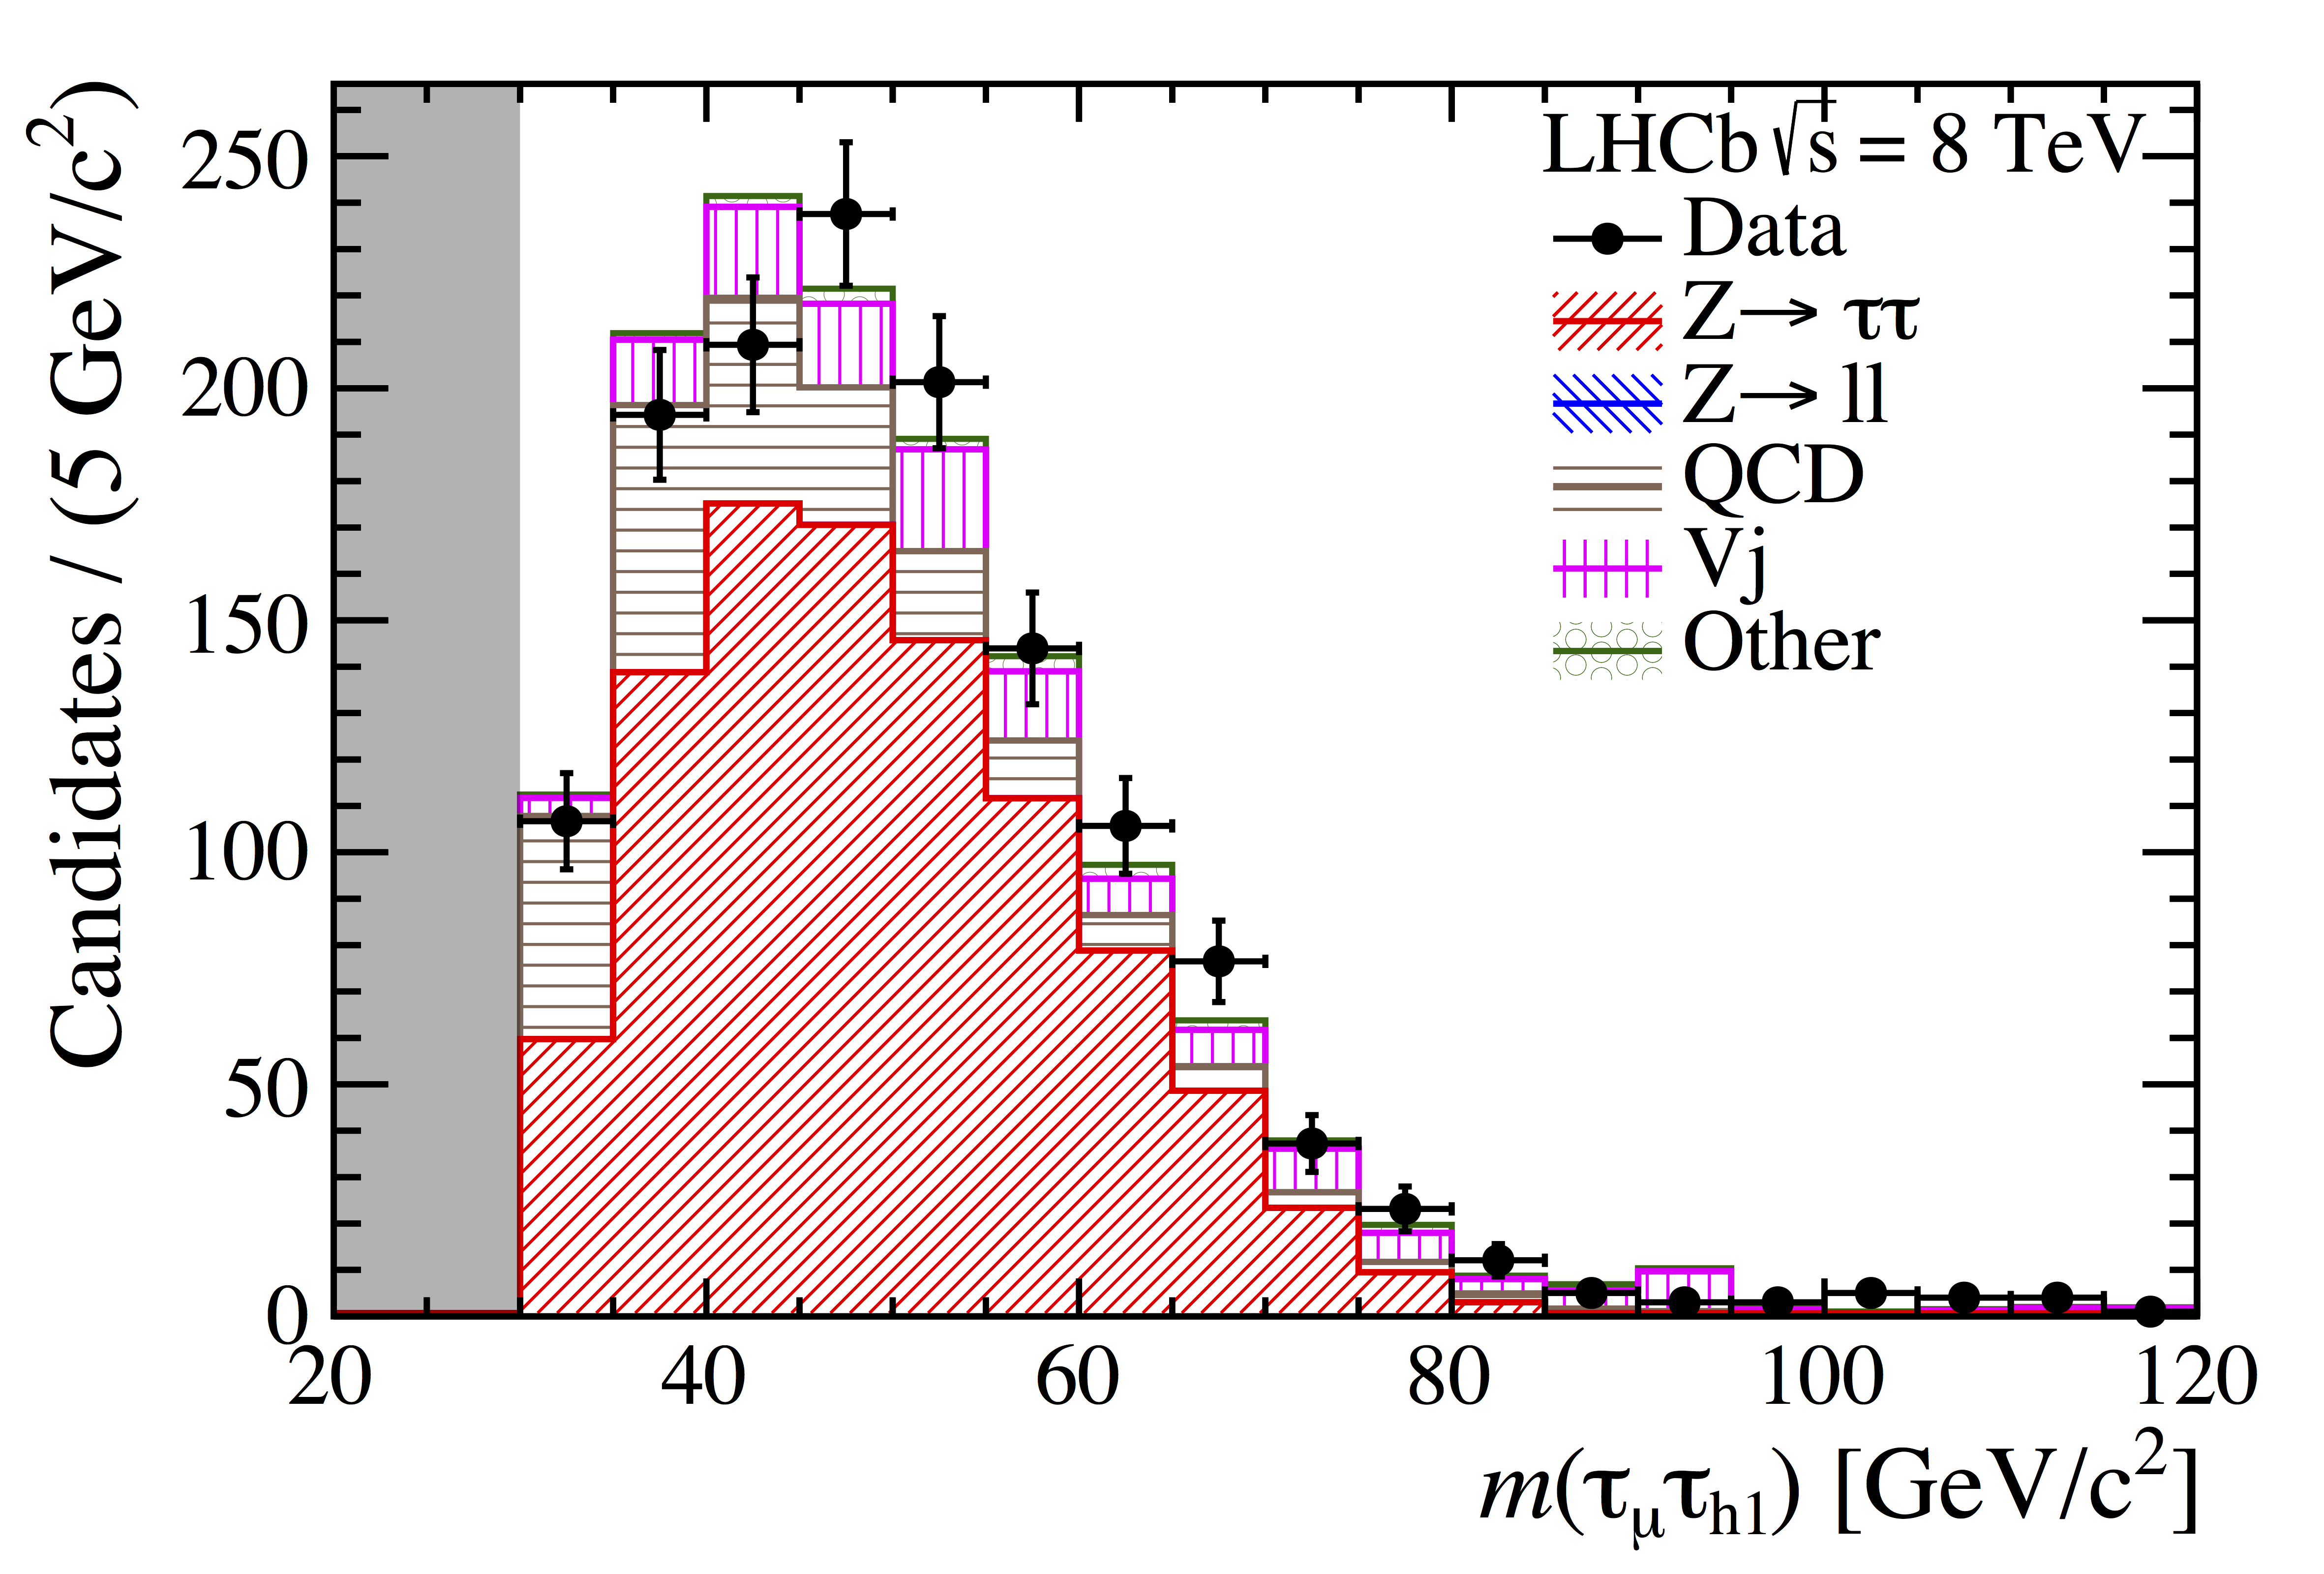
In addition, I have an experimental st_code = int to change the stacking
style.
st_code = 0: default stacking, i.e., super-imposed over each other.st_code = 1: like above, but first entry is dot-marker, others are filled.st_code = 2: Like above, but the first entry is not stacked, and it used dot-marker. Other entries are stacked and color-filled. I used this mainly to plot signal versus sum of backgrounds.
Options
String argument attached to QHist.options = 'opt' will be passed to the
third argument of TTree.Draw('param', 'cut', 'opt'). This will create the
desirable effect of that option.
Note that I have not test this extensively, just prof and colz.
filters
The field cuts is designed to be used for comparison stack.
In the case where same cuts is intended to be applied identically to all entries,
the field filters should be used:
h = QHist()
h.trees   = t1
h.params  = 'APT'
h.cuts    = 'mu_Q > 0', 'mu_Q < 0'  # comparison
h.filters = 'DPHI > 2.7'            # filtering
The general boolean operator behaves as expected:
h = QHist()
h.filters = '(mu_PT > 20) & (pi_PT > 20) & (pi_BPVIP > 0.03)'
Because the string can be long and complex with all the nested bracket,
QHist can help you more: passing the list,tuple of string acts as
a boolean-AND, whilst set acts as boolean-OR:
h = QHist()
h.filters = [
  'mu1_PT > 20',
  'mu2_PT > 20',
  {'mu1_trigger', 'mu2_trigger'},  # any muon fires trigger.
  'mu1_mu2_MASS > 40',
]
normalize
The field normalize, used to control the normalization (integral) of the
histograms, can be quite complex: its behavior depends on the type of argument:
bool:True(default) normalizes all histograms to 1, whileFalsedoes nothing.float: normalizes the histogram such that its integral equals to the given value.callable(float)->float: passing a 1-arg function receives current histogram integral as an input, and the function should return new integral as an output.
Passing multiple arguments to normalize will align each argument with the
entries in the comparison stack, so the same length is expected, for example:
h = QHist()
h.trees     = t1, t2, t3    # 3 entries
h.normalize = [40, 25, 15]  # 3 integrals for each histograms
Templating
This is the most important feature of QHist
and the reason I wrote this in the first place.
QHist provides a facility for histogram templating when you want to plot
several set of histograms with input consistency (i.e., Dont-repeat-yourself).
Each instance of QHist can be called like a constructor to create a new instance,
passing all of the fields downstream. The static nature of the fields ensure
that each descendant respects the value set in the ancestor.
## Base template
H0 = QHist(trees=[t1,t2,t3], filters='weight', prefix='signal', st_code=2)

## Base mass plot
Hmass = H0(params='mass', xmin=20, xmax=120, xlabel='mass [GeV/c^{2}]')
Hmass(name='M20', xbin=20, ylabel='Candidates / (5 GeV/c^{2})').draw()
Hmass(name='M50', xbin=50, ylabel='Candidates / (2 GeV/c^{2})').draw()

## Others
H = H0(cuts='mass_window', ylabel='Candidates')
H(params='P/1e3', xmin=90 , xmax=3e3).draw()
H(params='ETA'  , xmin=2.0, xmax=8.0).draw()
Just imagine doing this in plain ROOT, keeping consistency across all plots,
same cuts, axis, style, annotations. That is ~300 lines of code down to 10...
outputs
QHist has sensible behavior concerning the output once draw is complete:
-
First, it check if the field
nameis set, or flagauto_name = True. If not, it will save nothing. This is probably a quick interactive session. -
If
nameis set orauto_name = True, it will save 2 outputs: '.pdf' and '.root'. The subdirectory with the name of current script will be created, and the output will go there. In the subsequent call, next output will be dump into the same subdir, as well as new entry appended into the 'root' file if existed.
For example, given QHist(name='hist') in ./myscript.py file,
the output will be ./myscript/hist.pdf and ./myscript/myscript.root.
The flag auto_name will try its best to deduce an appropriate name judging
from the comparison stack. Of course, if things are complicate you should give
it an explicit name yourself.
Other notable naming fields are:
-
title: This appears as the title of the plot. By default it followsname, but setting this directly has higher priority. -
prefix,suffix: Useful in the templating, where the string in either field appears as prefix/suffix of the name/title output.
User-defined post-processing & anchors
QHist provides the way of drawing histograms quickly, so the freedom may seem
limited if the user intended to draw something more complicate, or modify
the resultant plots, fine-tune the color, annotating with more labels, etc.
The field postproc provide a solution where the user-defined action can be
done before the output stage. It accept a function with one argument,
representing the QHist instance itself. The actions inside this function will
be run before output is saved. For example:
def postproc(h):

  ## Tune legend position
  leg = h.anchors.legend
  leg.header   = 'LHCb#sqrt{s} = 8 TeV'
  leg.x1NDC    = 0.66
  leg.x2NDC    = 0.93
  leg.y1NDC    = 0.56
  leg.y2NDC    = 0.93
  leg.textSize = 0.06

  h.anchors.mainpad.RedrawAxis()
  h.anchors.mainpad.Update()

  ## Optional mask
  if 'Mnowin' in h.name:
    dt = h.prefix
    h  = h.anchors.stack
    mmin, mmax = (20,120) if dt=='emu' else (20,60) if dt in ('mumu', 'ee') else (30,120)
    ymax = h.anchors.mainpad.uymax
    box1 = ROOT.TBox(h.xaxis.xmin, 0., mmin, ymax)
    box2 = ROOT.TBox(mmax, 0., h.xaxis.xmax, ymax)
    for box in (box1, box2):
      box.ownership = False
      box.fillStyle = 1001
      box.fillColorAlpha = 1, 0.3
      box.Draw()

  ## Force no-exponent
  h.anchors.stack.xaxis.noExponent = True

## attach
h = QHist()
h.postproc = postproc
In particular, h.anchors provides collected "pointers" to important TObject
in the drawing. These fields can be accessed:
| Name | Object |
|---|---|
canvas |
TCanvas of the entire canvas. |
mainpad |
TPad of the main pad showing the histogram. |
stack |
THStack instance that holds member histograms. |
legend |
TLegend object to the legend of the pad. |
Project details
Release history Release notifications | RSS feed
Download files
Download the file for your platform. If you're not sure which to choose, learn more about installing packages.
Source Distribution
Built Distribution
Hashes for QHist-0.1.1.dev3-py2.py3-none-any.whl
| Algorithm | Hash digest | |
|---|---|---|
| SHA256 | 03795bda96204958eb9a80ba7f05b1a0e198f763aa968ec82f459b6a436f2dae |
|
| MD5 | c047ec735229958140ee822f89c0bf80 |
|
| BLAKE2b-256 | 8fe984ac48a478a0c9746168b2b3d4911466949ec3698aceb434f7abe77398b7 |


