Summarize geospatial raster datasets based on vector geometries

Project description


The rasterstats python module provides a fast and flexible tool to summarize geospatial raster datasets based on vector geometries (i.e. zonal statistics).
Raster data support
Any raster data source supported by GDAL
Support for continuous and categorical
Respects null/no-data metadata or takes argument
Vector data support
Points, Lines, Polygon and Multi-* geometries
Flexible input formats
Any vector data source supported by OGR
Python objects that are geojson-like mappings or support the geo_interface
Well-Known Text/Binary (WKT/WKB) geometries
Depends on GDAL, Shapely and numpy
Install
Using ubuntu 12.04:
sudo apt-get install python-numpy python-gdal
pip install rasterstats
Example Usage - Python
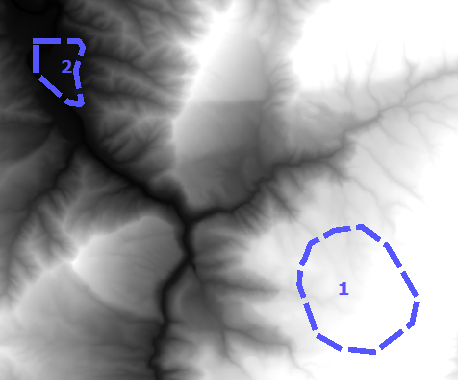
Given a polygon vector layer and a digitial elevation model (DEM) raster, calculate the mean elevation of each polygon:
>>> from rasterstats import zonal_stats
>>> stats = zonal_stats("tests/data/polygons.shp", "tests/data/elevation.tif")

>>> stats[1].keys()
    ['__fid__', 'count', 'min', 'max', 'mean']

>>> [(f['__fid__'], f['mean']) for f in stats]
    [(1, 756.6057470703125), (2, 114.660084635416666)]
Example Usage - Command Line
rasterstats includes a rasterio plugin for performing zonal statistics at the command line. Given a raster and geojson input, the rio zonalstats command will summarize the raster cell values for all features and output to geojson. In the resulting GeoJSON FeatureCollection, each Feature will have additional properties containing summary statistics of the overlapping raster cells.
For example, you could summarize the elevation (srtm5k.tif) by country (countries.json) using the following command:
$ rio zonalstats -r srtm5k.tif countries.json countries_with_elevation.geojsonOr use stdin/stdout to pipe geojson data between processes
$ ogr2ogr -f GeoJSON /vsistdout/ countries.shp | rio zonalstats -r srtm5k.tif | geojsonioFor more comprehensive documentation of the command line interface, see the docs.
Statistics
By default, the zonal_stats function will return the following statistics
min
max
mean
count
Optionally, these statistics are also available
sum
std
median
majority
minority
unique
range
percentile (see note below for details)
You can specify the statistics to calculate using the stats argument:
>>> stats = zonal_stats("tests/data/polygons.shp",
                         "tests/data/elevation.tif",
                         stats=['min', 'max', 'median', 'majority', 'sum'])

>>> # also takes space-delimited string
>>> stats = zonal_stats("tests/data/polygons.shp",
                         "tests/data/elevation.tif",
                         stats="min max median majority sum")
Note that certain statistics (majority, minority, and unique) require significantly more processing due to expensive counting of unique occurences for each pixel value.
You can also use a percentile statistic by specifying percentile_<q> where <q> can be a floating point number between 0 and 100.
User-defined Statistics
You can define your own aggregate functions using the add_stats argument. This is a dictionary with the name(s) of your statistic as keys and the function(s) as values. For example, to reimplement the mean statistic:
from __future__ import division
import numpy as np

def mymean(x):
    return np.ma.mean(x)
then use it in your zonal_stats call like so:
stats = zonal_stats(vector, raster, add_stats={'mymean':mymean})
Specifying Geometries
In addition to the basic usage above, rasterstats supports other mechanisms of specifying vector geometries.
It integrates with other python objects that support the geo_interface (e.g. Fiona, Shapely, ArcPy, PyShp, GeoDjango):
>>> import fiona

>>> # an iterable of objects with geo_interface
>>> lyr = fiona.open('/path/to/vector.shp')
>>> features = (x for x in lyr if x['properties']['state'] == 'CT')
>>> zonal_stats(features, '/path/to/elevation.tif')
...

>>> # a single object with a geo_interface
>>> lyr = fiona.open('/path/to/vector.shp')
>>> zonal_stats(lyr.next(), '/path/to/elevation.tif')
...
Or by using with geometries in “Well-Known” formats:
>>> zonal_stats('POINT(-124 42)', '/path/to/elevation.tif')
...
Feature Properties
By default, an __fid__ property is added to each feature’s results. None of the other feature attributes/proprties are copied over unless copy_properties is set to True:
>>> stats = zonal_stats("tests/data/polygons.shp",
                         "tests/data/elevation.tif"
                         copy_properties=True)

>>> stats[0].has_key('name')  # name field from original shapefile is retained
True
Rasterization Strategy
There is no right or wrong way to rasterize a vector. The default strategy is to include all pixels along the line render path (for lines), or cells where the center point is within the polygon (for polygons).
Alternatively, you can opt for the ALL_TOUCHED strategy which rasterizes the geometry by including all pixels that it touches. You can enable this specifying:
>>> zonal_stats(..., all_touched=True)
Both approaches are valid and there are tradeoffs to consider. Using the default rasterizer may miss polygons that are smaller than your cell size resulting in None stats for those geometries. Using the ALL_TOUCHED strategy includes many cells along the edges that may not be representative of the geometry and may give severly biased results in some cases.
Working with categorical rasters
You can treat rasters as categorical (i.e. raster values represent discrete classes) if you’re only interested in the counts of unique pixel values.
For example, you may have a raster vegetation dataset and want to summarize vegetation by polygon. Statistics such as mean, median, sum, etc. don’t make much sense in this context (What’s the sum of oak + grassland?).
The polygon below is comprised of 12 pixels of oak (raster value 32) and 78 pixels of grassland (raster value 33):
>>> zonal_stats(lyr.next(), '/path/to/vegetation.tif', categorical=True)

>>> [{'__fid__': 1, 32: 12, 33: 78}]
Keep in mind that rasterstats just reports on the pixel values as keys; It is up to the programmer to associate the pixel values with their appropriate meaning (e.g. oak is key 32) for reporting.
“Mini-Rasters”
Internally, we create a masked raster dataset for each feature in order to calculate statistics. Optionally, we can include these data in the output of zonal_stats using the raster_out argument:
stats = zonal_stats(vector, raster, raster_out=True)
Which gives us three additional keys for each feature:
``mini_raster`` : Numpy ndarray
``mini_raster_GT`` : Six-tuple defining the geotransform (GDAL ordering)
``mini_raster_NDV`` : Nodata value in the returned array
Keep in mind that having ndarrays in your stats dictionary means it is more difficult to serialize to json and other text formats.
Issues
Find a bug? Report it via github issues by providing
a link to download the smallest possible raster and vector dataset necessary to reproduce the error
python code or command to reproduce the error
information on your environment: versions of python, gdal and numpy and system memory
Release history Release notifications | RSS feed


Download files
Download the file for your platform. If you're not sure which to choose, learn more about installing packages.
Source Distributions
File details
Details for the file rasterstats-0.8.0.zip.
File metadata
- Download URL: rasterstats-0.8.0.zip
- Upload date:
- Size: 24.1 kB
- Tags: Source
- Uploaded using Trusted Publishing? No
File hashes
| Algorithm | Hash digest | |
|---|---|---|
| SHA256 |
5c033cea75ad794ddef4aecf2453f4608a73c82484cf415363f3d9296d599315
|
|
| MD5 |
a41685b68f5c46730f4949e6a5db9b2c
|
|
| BLAKE2b-256 |
cc6af3bfc55b941d429135ae020e81374f441ccb829170363ffa994f5974170b
|
File details
Details for the file rasterstats-0.8.0.tar.gz.
File metadata
- Download URL: rasterstats-0.8.0.tar.gz
- Upload date:
- Size: 17.2 kB
- Tags: Source
- Uploaded using Trusted Publishing? No
File hashes
| Algorithm | Hash digest | |
|---|---|---|
| SHA256 |
811a6d28f024f9a7c608596e83b36633bbc555e493fa8954dbf956cf689b4e69
|
|
| MD5 |
6d2523451b1fecbfb8f37fdfa7adcd26
|
|
| BLAKE2b-256 |
e74b60eaa6aee34d7a1582190377e59efc30a45c1c9e2b5f41e1f4bc9d469975
|


