Profile user-defined regions of code without any external tools

Project description


Mark regions using with-statements and decorators. Time region hierarchy and get detailed console report as well as Chrome Trace log.
Features
Measure only what you need. See timing for regions you’ve marked and never waste time on looking at things you’re not interested in.
Measure third party libraries. You can mark regions inside arbitrary Python package. Just don’t forget to rollback changes after you’ve done :) Again, only marked regions count. No need to see timings for unfamiliar library internals.
No need to use external tools (like kernprof) to gather profiling data. Profile from within your application and use usual command to run it.
Average region overhead is 3-10 us (Python 3.7, Intel Core i5).
Chrome Trace log generation.
Table or CSV report format.
No dependencies.
Why another Python profiler
While other profilers often focus on some particular granularity (e.g. function or single line), Region Profiler allows user to choose the size of the scope of interest each time, moving from whole function to a subset of lines to a single iteration.
Region Profiler report contains information only about user-defined regions – if we are investigating some complicated framework, we don’t need to time its internals outside of the region that we’re interested in.
In contrary to majority of existing profilers, Region Profiler does not require any special programs/switches (like kernprof) for application start. This tool is very useful for investigating bottlenecks of bigger applications, that has complicated start process (e.g. distributed NN trainer, that is run on a cluster using MPI).
Getting started
Dependencies
Python >= 3.4
Installation
You can install Region Profiler using pip:
pip install region_profiler
or from sources:
git clone https://github.com/metopa/region_profiler.git
cd region_profiler
python setup.py install
Example
Mark some code regions for profiling:
import region_profiler as rp                # <<<<<

class NeuralNet(tfe.Network):
  def __init__(self):
      ...

  def call(self, x):
      with rp.region('NN', asglobal=True):  # <<<<<
          with rp.region('layer 1'):        # <<<<<
              x = self.layer1(x)
          with rp.region('layer 2'):        # <<<<<
              x = self.layer2(x)
          with rp.region('out layer'):      # <<<<<
              x = self.out_layer(x)
          return x

@rp.func()                                  # <<<<<
def loss_fn(inference_fn, inputs, labels):
    ...

@rp.func()                                  # <<<<<
def accuracy_fn(inference_fn, inputs, labels):
    ...

with rp.region('train'):                    # <<<<<
    for step in range(num_steps):
        with rp.region('forward'):          # <<<<<
            batch_loss = loss_fn(neural_net, x_batch, y_batch)
            batch_accuracy = accuracy_fn(neural_net, x_batch, y_batch)
        with rp.region('backward'):         # <<<<<
            optimizer.apply_gradients(grad(neural_net, x_batch, y_batch))
Enable profiling by calling region_profiler.install:
if __name__ == '__main__':
    rp.install(chrome_trace_file='trace.json')
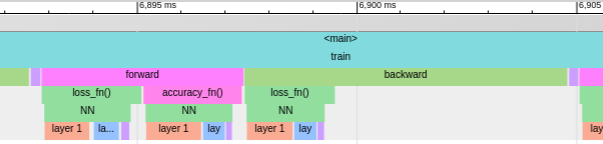
See console report and flame graph in Chrome Trace Viewer:
name                    total  % of total
-------------------  --------  ----------
<main>                12.44 s     100.00%
. train               11.64 s      93.51%
. . backward          7.229 s      58.10%
. . . loss_fn()       2.079 s      16.71%
. . forward           4.142 s      33.29%
. . . loss_fn()       2.134 s      17.15%
. . . accuracy_fn()   1.937 s      15.56%
. . fetch_next       225.2 ms       1.81%
. NN                  5.389 s      43.32%
. . layer 1           3.295 s      26.48%
. . layer 2           1.544 s      12.41%
. . out layer        444.0 ms       3.57%
Documentation
You can find complete API reference here.
The main API consists of these functions:
- region_profiler.install()
This function should be called once to enable profiling and pass some options to the profiler.
- region_profiler.region()
This function returns a context manager that is used to mark a profiling region. Allowed parameters:
name - region name. If omitted, an automatic name in format func() <filename.py:lineno> is used.
as_global - mark region as global.
- region_profiler.func()
Function decorator that wraps the marked function in a region. Allowed parameters:
name - region name. If omitted, an automatic name in format func() is used.
as_global - mark region as global.
- region_profiler.iter_proxy()
Iterable object wrapper. Measures time spent in __next__ on each iteration. This wrapper is useful, when iterating over things like DataLoader. Allowed parameters:
name - region name. If omitted, an automatic name in format func() <filename.py:lineno> is used.
as_global - mark region as global.
License
MIT © Viacheslav Kroilov <slavakroilov@gmail.com>


Download files
Download the file for your platform. If you're not sure which to choose, learn more about installing packages.
Source Distribution
Built Distribution
Filter files by name, interpreter, ABI, and platform.
If you're not sure about the file name format, learn more about wheel file names.
Copy a direct link to the current filters
File details
Details for the file region_profiler-0.9.3.tar.gz.
File metadata
- Download URL: region_profiler-0.9.3.tar.gz
- Upload date:
- Size: 15.5 kB
- Tags: Source
- Uploaded using Trusted Publishing? No
- Uploaded via: twine/1.13.0 pkginfo/1.5.0.1 requests/2.21.0 setuptools/39.1.0 requests-toolbelt/0.9.1 tqdm/4.31.1 CPython/3.6.7
File hashes
| Algorithm | Hash digest | |
|---|---|---|
| SHA256 |
97adaca10647b44940e5bc1592f7d94494db6ab47691ff17ff7c88dd15b64c02
|
|
| MD5 |
e9a3ff7443df6b7cefed133b0c0a30c3
|
|
| BLAKE2b-256 |
e16b9117d89b1b75af2bc32993ccf693934d0a29533a5a1c704458921fb1e5db
|
File details
Details for the file region_profiler-0.9.3-py3-none-any.whl.
File metadata
- Download URL: region_profiler-0.9.3-py3-none-any.whl
- Upload date:
- Size: 19.6 kB
- Tags: Python 3
- Uploaded using Trusted Publishing? No
- Uploaded via: twine/1.13.0 pkginfo/1.5.0.1 requests/2.21.0 setuptools/39.1.0 requests-toolbelt/0.9.1 tqdm/4.31.1 CPython/3.6.7
File hashes
| Algorithm | Hash digest | |
|---|---|---|
| SHA256 |
e9fb0eafff4a3690f64caa648d001dc95ba3a2cc4f81d4a10ecb71571d979093
|
|
| MD5 |
a2615b90cb0945ab983cb72ed7b33d26
|
|
| BLAKE2b-256 |
560c2ab4d71cc17e518d6ec1273440a59eadd073288ace86ec4dc69916c3e58e
|


