A plotter for reinforcement learning (RL)

Project description
rl-plotter


This is a simple tool which can plot learning curves easily for reinforcement learning (RL)
Installation
from PIP
pip install rl_plotter
from source
python setup.py install
Usage
1. add basic logger
Add our logger in your code of evaluation (Recommend)
from rl_plotter.logger import Logger
logger = Logger(exp_name="your_exp_name", env_name, seed, locals())
····
logger.update(score=evaluation_score_list, total_steps=current_training_steps)
or just use OpenAI-spinningup to log (Support)
or you can use OpenAI-baseline bench.Monitor (Not Recommend)
env = logger.monitor_env(env)
2. track other variables (Optional)
if you want to track other variables, you can use our custom_logger:
custom_logger=logger.new_custom_logger(filename, fieldnames=["variable 1", "variable 2", ..., "variable n"])
custom_logger.update(fieldvalues=variable_value_list, total_steps=current_training_steps)
3. plot the results
After the training or when you are training your agent, you can plot the learning curves in this way:
-
switch to log directory or multi log’s parent directory (default: ./)
-
run command to plot:
rl_plotter --save --show
You can also use seaborn kernel to get the same plot style as OpenAI-spinningup:
rl_plotter_spinup --save --show
Example
1. commonly used commands
rl_plotter --save --show --filter HalfCheetah
rl_plotter --save --show --filter Ant --avg_group --shaded_std
rl_plotter --save --show --filter Swimmer --avg_group --shaded_std --shaded_err
rl_plotter --save --show --filter Walker2d --filename progress.txt --xkey TotalEnvInteracts --ykey AverageEpRet
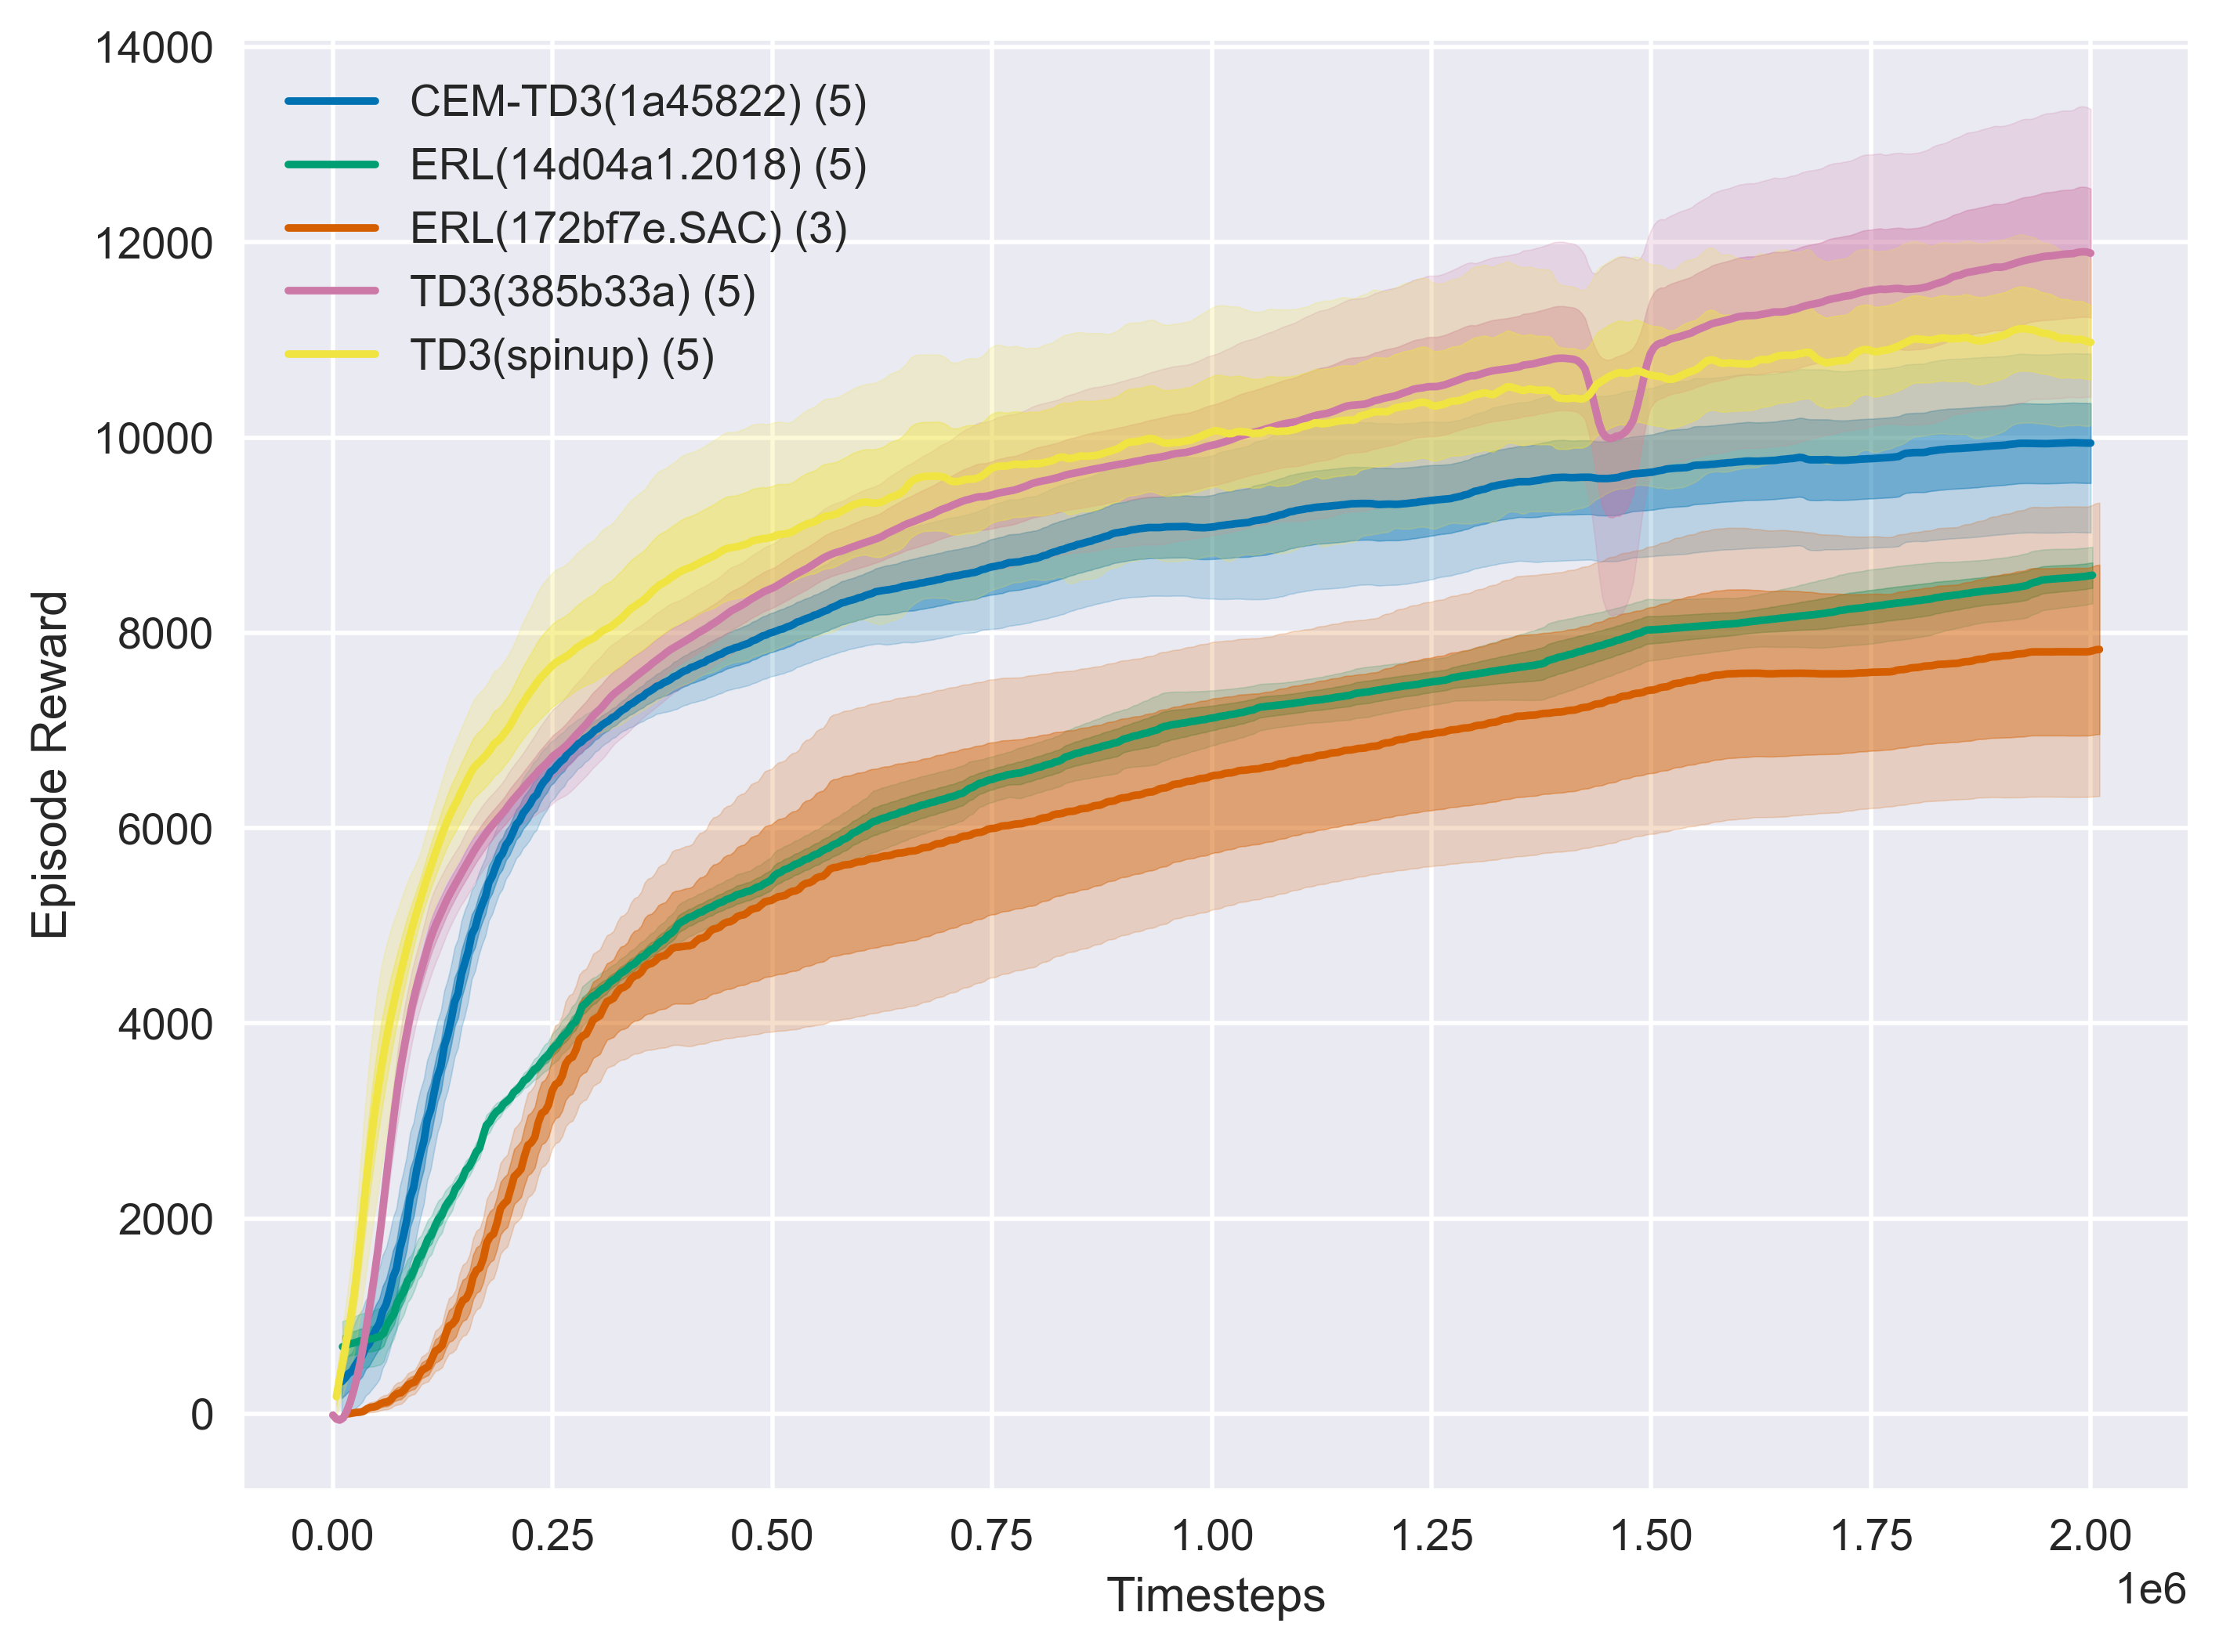
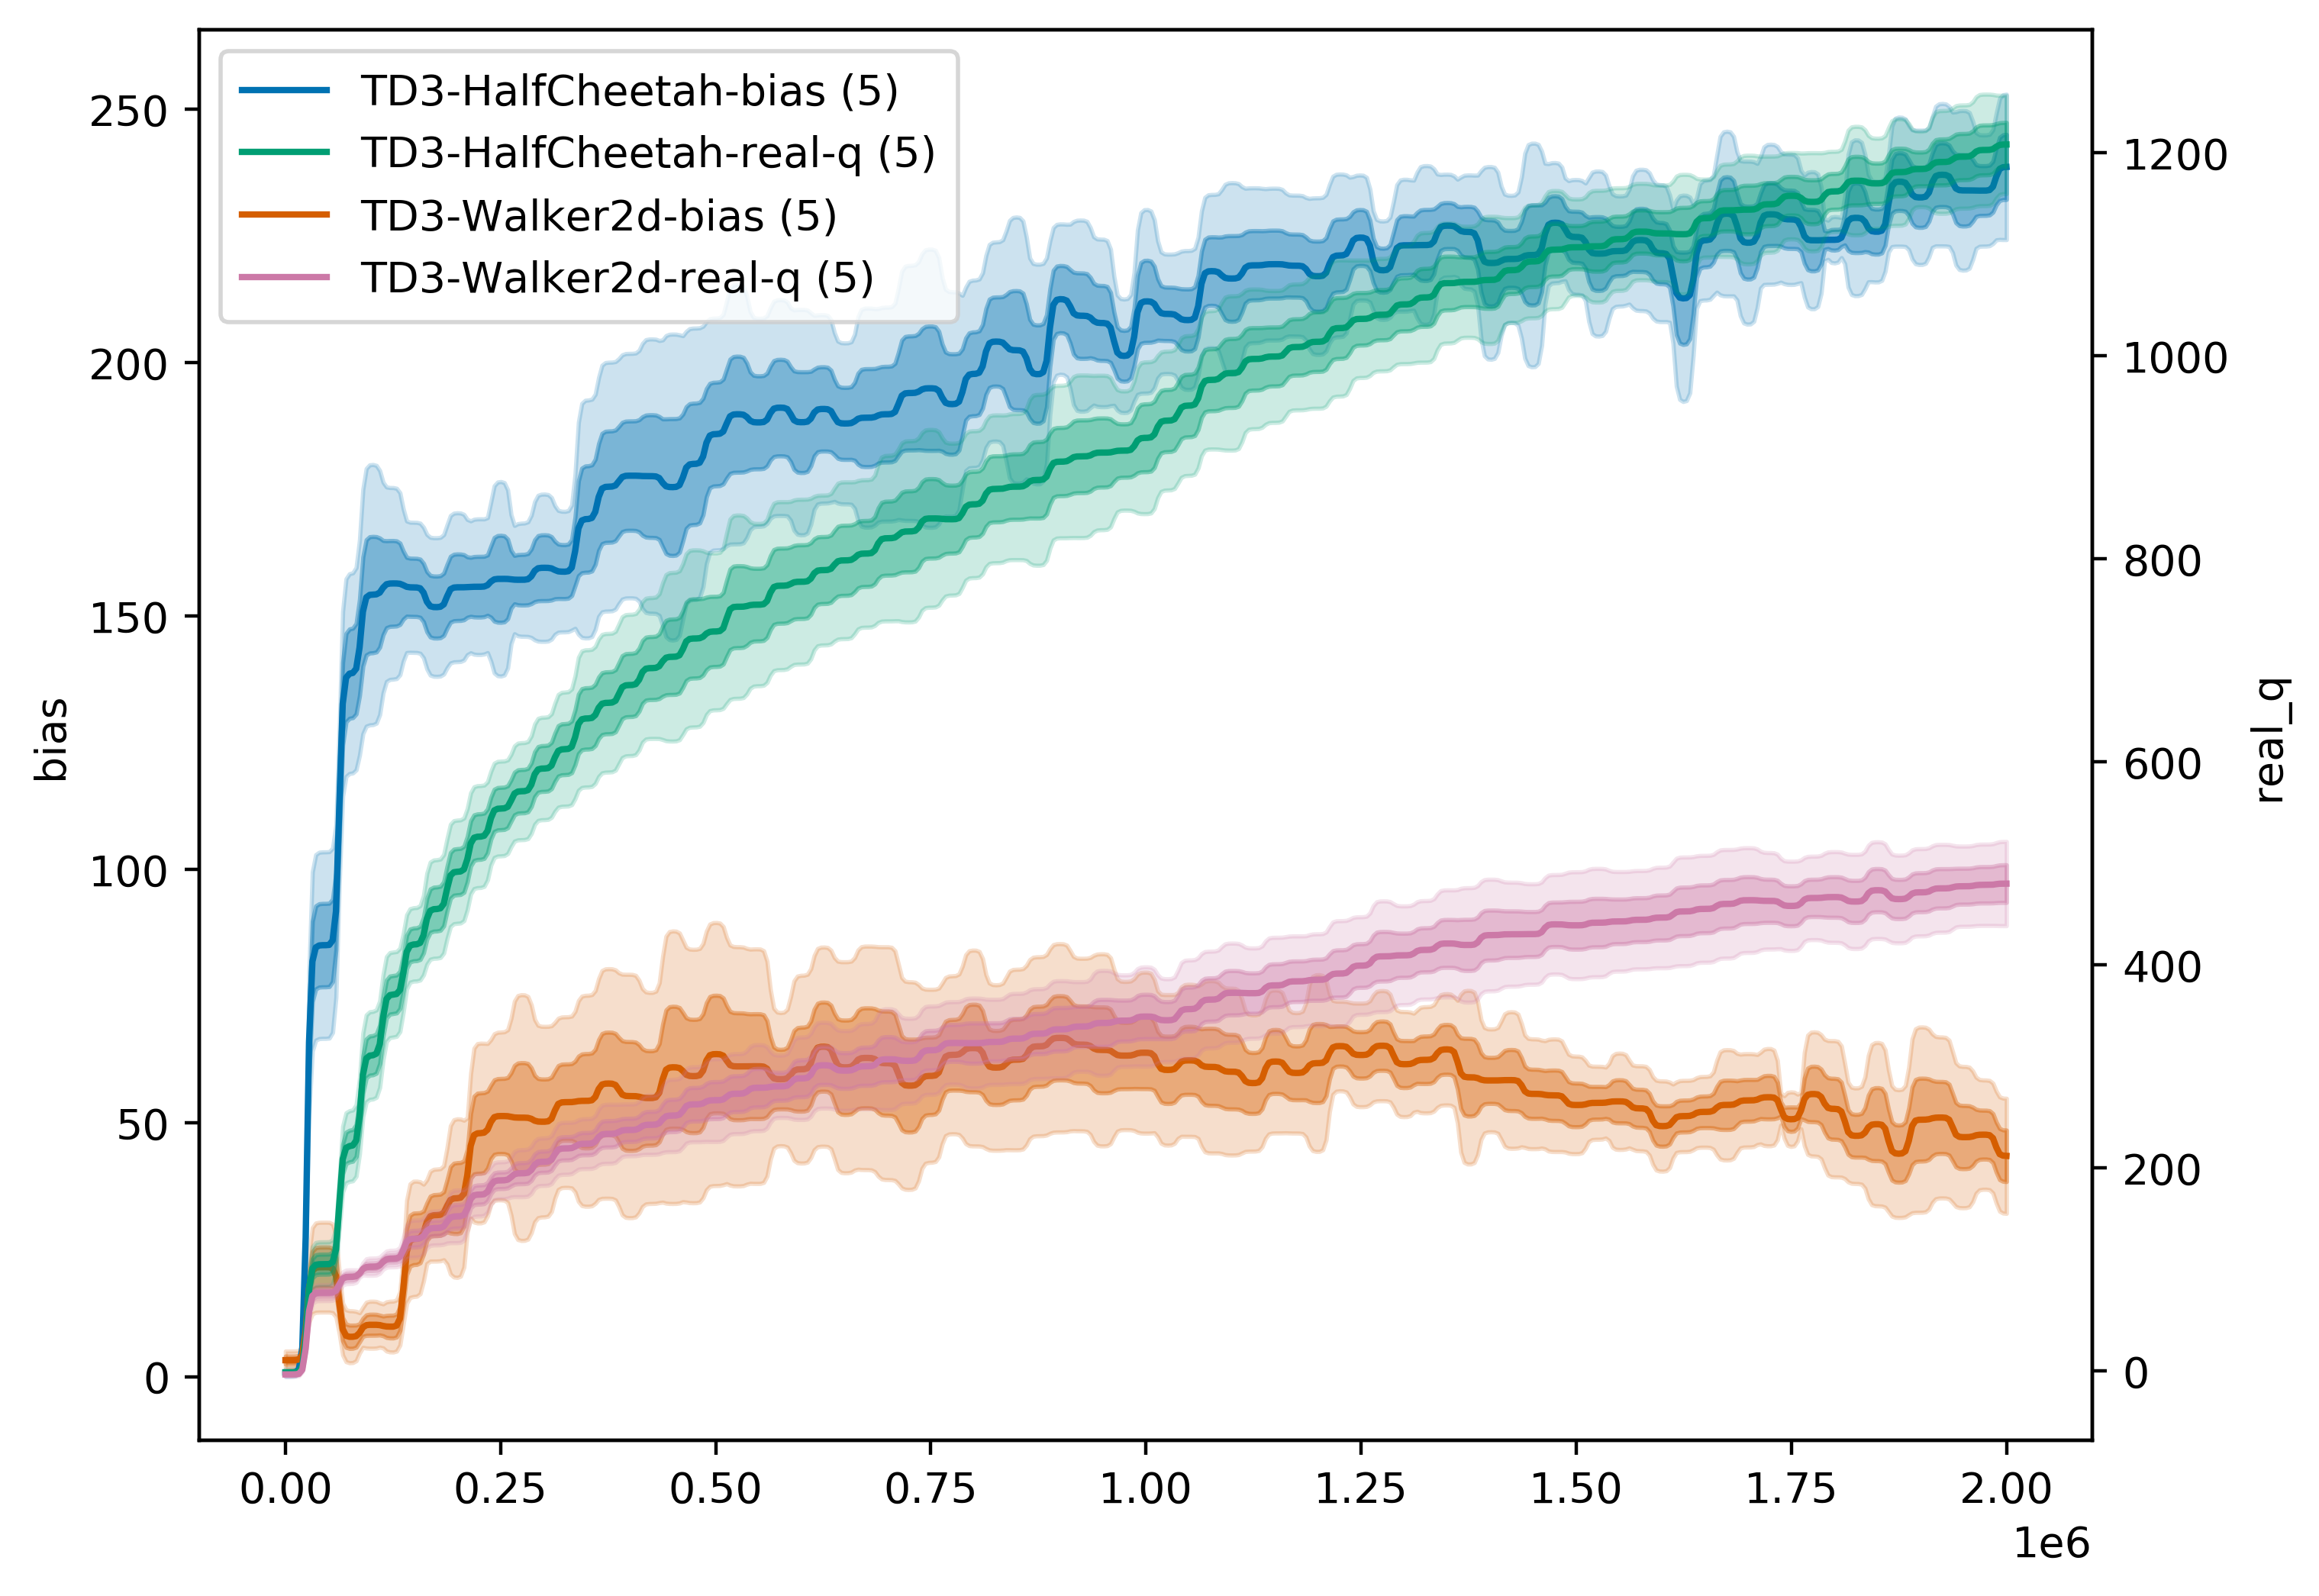
2. practical examples
rl_plotter --show --save --avg_group --shaded_err --shaded_std
rl_plotter --show --save --avg_group --shaded_err --shaded_std --filename q --filters Walker HalfCheetah --ykey bias real_q --yduel --style default --smooth 0
3. more specific usage
you can find all parameters which can custom the style of your curves using help
rl_plotter --help
optional arguments:
-h, --help            show this help message and exit
--fig_length          matplotlib figure length (default: 8)
--fig_width           matplotlib figure width (default: 6)
--style               matplotlib figure style (default: seaborn)
--title               matplotlib figure title (default: None)
--xlabel              matplotlib figure xlabel
--xkey                x-axis key in csv file (default: l)
--ykey                y-axis key in csv file (support multi) (default: r)
--yduel               duel y axis (use if has two ykeys)
--ylabel              matplotlib figure ylabel
--smooth              smooth radius of y axis (default: 10)
--resample            if not zero, size of the uniform grid in x direction
                      to resample onto. Resampling is performed via
                      symmetric EMA smoothing (see the docstring for
                      symmetric_ema). Default is zero (no resampling). Note
                      that if average_group is True, resampling is
                      necessary; in that case, default value is 512.
                      (default: 512)
--smooth_step         when resampling (i.e. when resample > 0 or
					  average_group is True), use this EMA decay parameter
                      (in units of the new grid step). See docstrings for
                      decay_steps in symmetric_ema or one_sided_ema functions.
                      (default: 1.0)
--avg_group           average the curves in the same group and plot the mean
--shaded_std          shaded region corresponding to standard deviation of the group
--shaded_err          shaded region corresponding to error in mean estimate of the group
--legend_loc          location of legend
--legend_outside      place the legend outside of the figure
--borderpad           borderpad of legend (default: 0.5)
--labelspacing        labelspacing of legend (default: 0.5)
--no_legend_group_num don't show num of group in legend
--time                enable this will activate parameters about time
--time_unit           parameters about time, x axis time unit (default: h)
--time_interval       parameters about time, x axis time interval (default: 1)
--xformat             x-axis format
--xlim                x-axis limitation (default: None)
--log_dir             log dir (default: ./)
--filters             filter of dirname
--filename            csv filename
--show                show figure
--save                save figure
--dpi                 figure dpi (default: 400)
Features
- custom logger, style, key, label, x-axis formatter, and so on ...
- filter of directory name
- multi-experiment plotter
- multiple plotting kernels (native matplotlib plotting or seaborn plotting)
- compatible with OpenAI-baseline monitor and OpenAI-spinningup
- corresponding color for specific experiment
- multi y key & duel y legend
Citing the Project
If using this repository for your research or publication, please cite:
@misc{rl-plotter,
  author = {Xiaoyu Gong},
  title = {RL-plotter: A plotter for reinforcement learning},
  year = {2020},
  publisher = {GitHub},
  journal = {GitHub repository},
  howpublished = {\url{https://github.com/gxywy/rl-plotter}},
}
Acknowledgment
The core of this tool is inspired by baselines/plot_util.py
Release history Release notifications | RSS feed


Download files
Download the file for your platform. If you're not sure which to choose, learn more about installing packages.
Source Distribution
Built Distribution
Filter files by name, interpreter, ABI, and platform.
If you're not sure about the file name format, learn more about wheel file names.
Copy a direct link to the current filters
File details
Details for the file rl_plotter-2.4.0.tar.gz.
File metadata
- Download URL: rl_plotter-2.4.0.tar.gz
- Upload date:
- Size: 14.9 kB
- Tags: Source
- Uploaded using Trusted Publishing? No
- Uploaded via: twine/2.0.0 pkginfo/1.5.0.1 requests/2.23.0 setuptools/54.1.2 requests-toolbelt/0.9.1 tqdm/4.47.0 CPython/3.7.3
File hashes
| Algorithm | Hash digest | |
|---|---|---|
| SHA256 |
01eece650a0a1678374b5ce60541cbaa28a461f561fc0d533899c6f457075e5b
|
|
| MD5 |
e3171c5cffaebf89fa5278711966f64e
|
|
| BLAKE2b-256 |
0540382e80f2e30a27b9f0383806f600520c6d69fe2833573e9aa879e8b7b51f
|
File details
Details for the file rl_plotter-2.4.0-py3-none-any.whl.
File metadata
- Download URL: rl_plotter-2.4.0-py3-none-any.whl
- Upload date:
- Size: 22.6 kB
- Tags: Python 3
- Uploaded using Trusted Publishing? No
- Uploaded via: twine/2.0.0 pkginfo/1.5.0.1 requests/2.23.0 setuptools/54.1.2 requests-toolbelt/0.9.1 tqdm/4.47.0 CPython/3.7.3
File hashes
| Algorithm | Hash digest | |
|---|---|---|
| SHA256 |
12b497334b4f29e5ab6e85077d59784cb82d96c21d0ebaaff6ee904c4876b73d
|
|
| MD5 |
ec429aef20ba81d14cb31c5a877526f1
|
|
| BLAKE2b-256 |
298c68582409f9b959a7efa8a2d2af20629af1c024301ab0e29e476bf6b7c4bf
|


