Create synthetic sequence data.

Project description
sequgen
Purpose
Programmatically generate synthetic sequence data such as time series, strings, DNA, etc. Sequence data generation is fully controlled by the user. sequgen does not build models from real-world sequence data.
Badges
| fair-software.nl recommendations | |
|---|---|
| (1/5) code repository |  |
| (2/5) license |  |
| (3/5) community registry |  |
| (4/5) citation |  |
| (5/5) checklist |  |
| overall |  |
| Other best practices | |
| Documentation |  |
| Supported Python versions |  |
| Code quality |  |
| Code coverage of unit tests |  |
| GitHub Actions | |
| Citation metadata consistency |  |
| Unit tests |  |
Install
pip3 install sequgen
Usage example
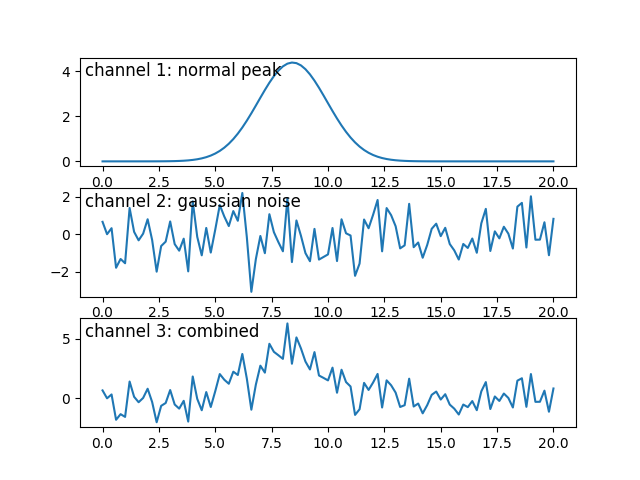
This usage example involves generating time series data. We generate a time series with three channels: 1. a normal distribution, 2. Gaussian noise, and 3. the combination (sum) of the first two channels. The normal distribution is positioned between 8 and 12 on an abstract time axis of 100 intervals starting at 0 and ending at 20. The standard deviation of the distribution is a value between 1 and 2 and its peak has a height between 4 and 5. For the Gaussian noise we use the default values (standard deviation 1 and average value 0). The third channel is defined as the sum of the other two channels. After creating the three channels, graphs with their values are plotted:
from matplotlib import pyplot as plt
import numpy
from sequgen.deterministic.normal_peak import normal_peak
from sequgen.stochastic.gaussian import gaussian
from sequgen.parameter_space import ParameterSpace
from sequgen.dimension import Dimension

time_axis = numpy.linspace(start=0, stop=20, num=101)
parameter_space_0 = ParameterSpace([
    Dimension("location", 8, 12),
    Dimension("stddev", 1, 2),
    Dimension("height", 4, 5),
])

channel_1 = normal_peak(time_axis, **parameter_space_0.sample())
channel_2 = gaussian(time_axis)
channel_3 = channel_1 + channel_2
channels = { "channel 1: normal peak": channel_1,
             "channel 2: gaussian noise": channel_2,
             "channel 3: combined": channel_3 }

i = 0
for title, channel in channels.items():
    plt.subplot(len(channels), 1, i+1)
    plt.plot(time_axis, channel)
    plt.title(title, y=0.75, x=0.01, loc="left")
    i += 1
plt.show()
And these are the results:
You can find more usage examples in the notebooks repository on GitHub: https://github.com/sequgen/notebooks.
Contributing
For developer documentation, go to the developer's README.
If you want to contribute to the development of sequgen, have a look
at the contribution guidelines.
Credits
This package was created with Cookiecutter and the NLeSC/python-template.
Release history Release notifications | RSS feed


Download files
Download the file for your platform. If you're not sure which to choose, learn more about installing packages.
Source Distribution
Built Distribution
Filter files by name, interpreter, ABI, and platform.
If you're not sure about the file name format, learn more about wheel file names.
Copy a direct link to the current filters
File details
Details for the file sequgen-0.2.0.tar.gz.
File metadata
- Download URL: sequgen-0.2.0.tar.gz
- Upload date:
- Size: 14.3 kB
- Tags: Source
- Uploaded using Trusted Publishing? No
- Uploaded via: twine/3.4.1 importlib_metadata/3.10.0 pkginfo/1.7.0 requests/2.25.1 requests-toolbelt/0.9.1 tqdm/4.60.0 CPython/3.8.5
File hashes
| Algorithm | Hash digest | |
|---|---|---|
| SHA256 |
214f976d5b8330e5fc200a1c5f12933b8fecce68f2b32c2718412d9c72747379
|
|
| MD5 |
0f64f82dfecbd9069bd2706a8ad62bb9
|
|
| BLAKE2b-256 |
8a25bbcdfe1e8790c0899df9984412047392ea0eb538ce0f604f236ed4e4436d
|
File details
Details for the file sequgen-0.2.0-py3-none-any.whl.
File metadata
- Download URL: sequgen-0.2.0-py3-none-any.whl
- Upload date:
- Size: 14.9 kB
- Tags: Python 3
- Uploaded using Trusted Publishing? No
- Uploaded via: twine/3.4.1 importlib_metadata/3.10.0 pkginfo/1.7.0 requests/2.25.1 requests-toolbelt/0.9.1 tqdm/4.60.0 CPython/3.8.5
File hashes
| Algorithm | Hash digest | |
|---|---|---|
| SHA256 |
94e9f6041ad2a5e4a9e358930fabd69149f33a0d8740b1450645140eeca483c0
|
|
| MD5 |
8b14b1bb1131da9b5c33078029f747ac
|
|
| BLAKE2b-256 |
695c7b6c125c2938910c2a08f18bfbcf64c6afd2805722d1898495070ade5ddb
|


