Search records of pandas dataframe from plot.

Project description
概要
散布図または箱ひげ図からデータを抽出することができます
関数を呼び出すと、tkウィンドウが立ち上がります
ウィンドウに表示された図上をドラッグすることで範囲を指定でき、
範囲内にプロットされているデータをDataFrameで受け取ることができます
jupyter notebook上で使うことを想定しています
インストール
$ pip install sfplot使い方
サンプルデータにirisデータセットを利用します
from sklearn.datasets import load_iris
import seaborn as sns
iris_dataset = sns.load_dataset('iris')
iris_dataset.head(10)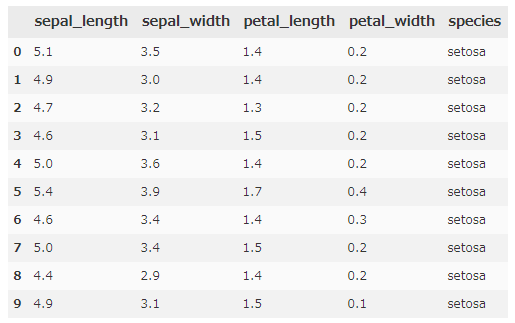
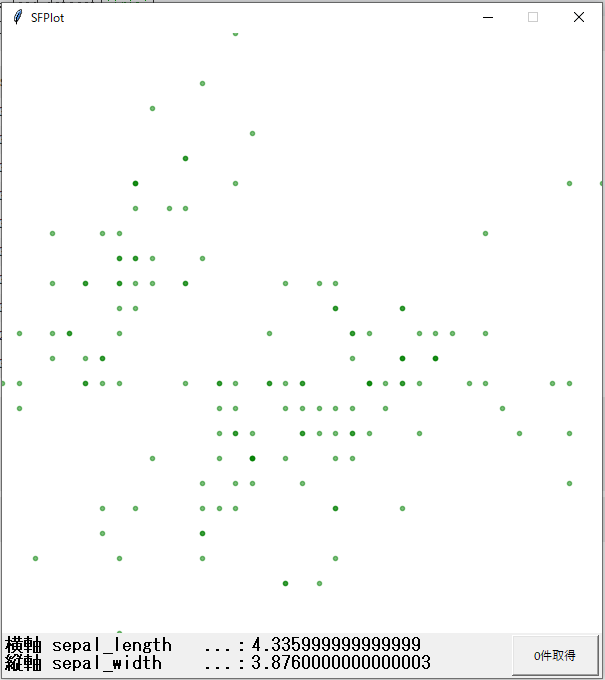
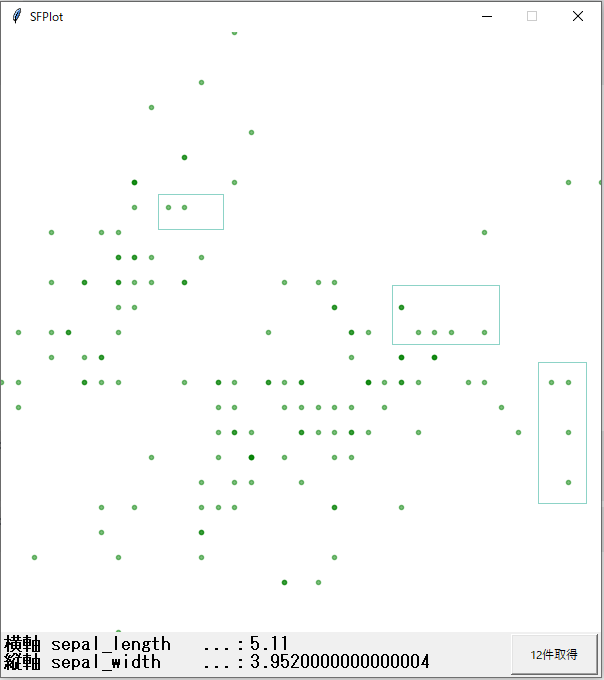
対散布図からデータを抽出
- pandas DataFrameと、散布図にしたいカラム名を引数にしてSearchFromPlotを起動します引数x,yには数値(int, float)型のカラムのみ指定可能です
import sfplot search_result_df = sfplot.scatter(iris_dataset, x='sepal_length', y='sepal_width') - ウィンドウが起動します
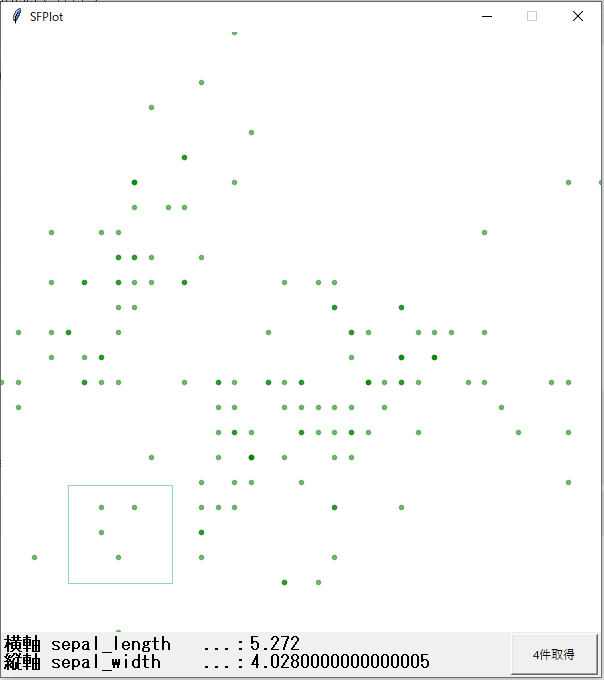
- 取得したいデータの範囲をドラッグします
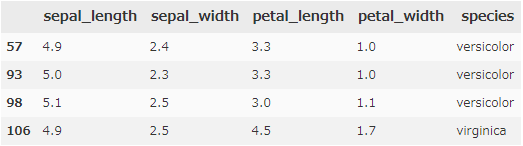
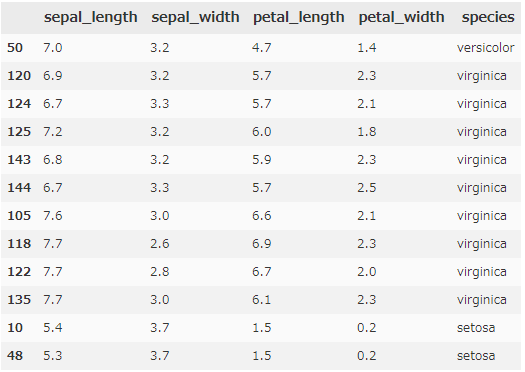
- 「4件取得」と書かれたボタンを押下すると、ウィンドウが閉じ、選択範囲内のレコードを抽出したDataFrameを返却します
search_result_df - 一度に複数回範囲を選択することも可能です
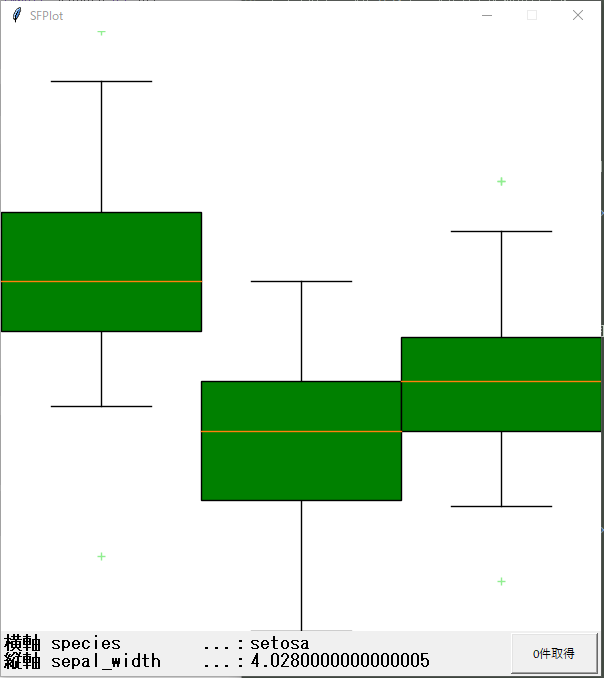
箱ひげ図からデータを抽出
- pandas DataFrameと、箱ひげ図にしたいカラム名を引数にしてSearchFromPlotを起動します引数xにはobject型のカラム、引数yには数値(int, float)型のカラムのみ指定可能です
search_result_df = sfplot.boxplot(iris_dataset, x='species', y='sepal_width') - ウィンドウが起動します
操作方法は対散布図と同様です
Release history Release notifications | RSS feed

Download files
Download the file for your platform. If you're not sure which to choose, learn more about installing packages.
Source Distribution
sfplot-0.0.1.tar.gz
(7.9 kB
view details)
Built Distribution
Filter files by name, interpreter, ABI, and platform.
If you're not sure about the file name format, learn more about wheel file names.
Copy a direct link to the current filters
File details
Details for the file sfplot-0.0.1.tar.gz.
File metadata
- Download URL: sfplot-0.0.1.tar.gz
- Upload date:
- Size: 7.9 kB
- Tags: Source
- Uploaded using Trusted Publishing? No
- Uploaded via: twine/1.13.0 pkginfo/1.5.0.1 requests/2.20.1 setuptools/40.6.2 requests-toolbelt/0.9.1 tqdm/4.31.1 CPython/3.6.7
File hashes
| Algorithm | Hash digest | |
|---|---|---|
| SHA256 |
53619bf2a11ea947c33414bc4fce1f7284fbbe6348a58987295693455ddecf2a
|
|
| MD5 |
2cef40dc7b097bebd29345228627270d
|
|
| BLAKE2b-256 |
21d97cbe63535cb7a93c87d59a2fbb471654406a5bf248b99aee31f26afe45ac
|
File details
Details for the file sfplot-0.0.1-py3-none-any.whl.
File metadata
- Download URL: sfplot-0.0.1-py3-none-any.whl
- Upload date:
- Size: 9.0 kB
- Tags: Python 3
- Uploaded using Trusted Publishing? No
- Uploaded via: twine/1.13.0 pkginfo/1.5.0.1 requests/2.20.1 setuptools/40.6.2 requests-toolbelt/0.9.1 tqdm/4.31.1 CPython/3.6.7
File hashes
| Algorithm | Hash digest | |
|---|---|---|
| SHA256 |
95a7cf8e4e986ca8a3995154357bdf2a55e2705e9ca0e079c501ec74449a2af8
|
|
| MD5 |
52438e05bd8d48ec93cc71d55c822c54
|
|
| BLAKE2b-256 |
73f0eeeea9bebc881b5b199d75e5e6caff86529be469cb555295948fd3e3381d
|


