Shapley Interactions for Machine Learning
Verified details
These details have been verified by PyPIProject links
GitHub Statistics
Maintainers


Project description
shapiq: Shapley Interactions for Machine Learning 


An interaction may speak more than a thousand main effects.
Shapley Interaction Quantification (shapiq) is a Python package for (1) approximating any-order Shapley interactions, (2) benchmarking game-theoretical algorithms for machine learning, (3) explaining feature interactions of model predictions. shapiq extends the well-known shap package for both researchers working on game theory in machine learning, as well as the end-users explaining models. SHAP-IQ extends individual Shapley values by quantifying the synergy effect between entities (aka players in the jargon of game theory) like explanatory features, data points, or weak learners in ensemble models. Synergies between players give a more comprehensive view of machine learning models.
🛠️ Install
shapiq is intended to work with Python 3.12 and above.
Installation can be done via uv :
uv add shapiq
or via pip:
pip install shapiq
👀 Upcoming
See what’s on the horizon for the library in our GitHub Project Board. We plan and track upcoming features, improvements, and maintenance tasks there including new explainers, performance optimizations, and expanded model support.
⭐ Quickstart
You can explain your model with shapiq.explainer and visualize Shapley interactions with shapiq.plot.
If you are interested in the underlying game theoretic algorithms, then check out the shapiq.approximator and shapiq.games modules.
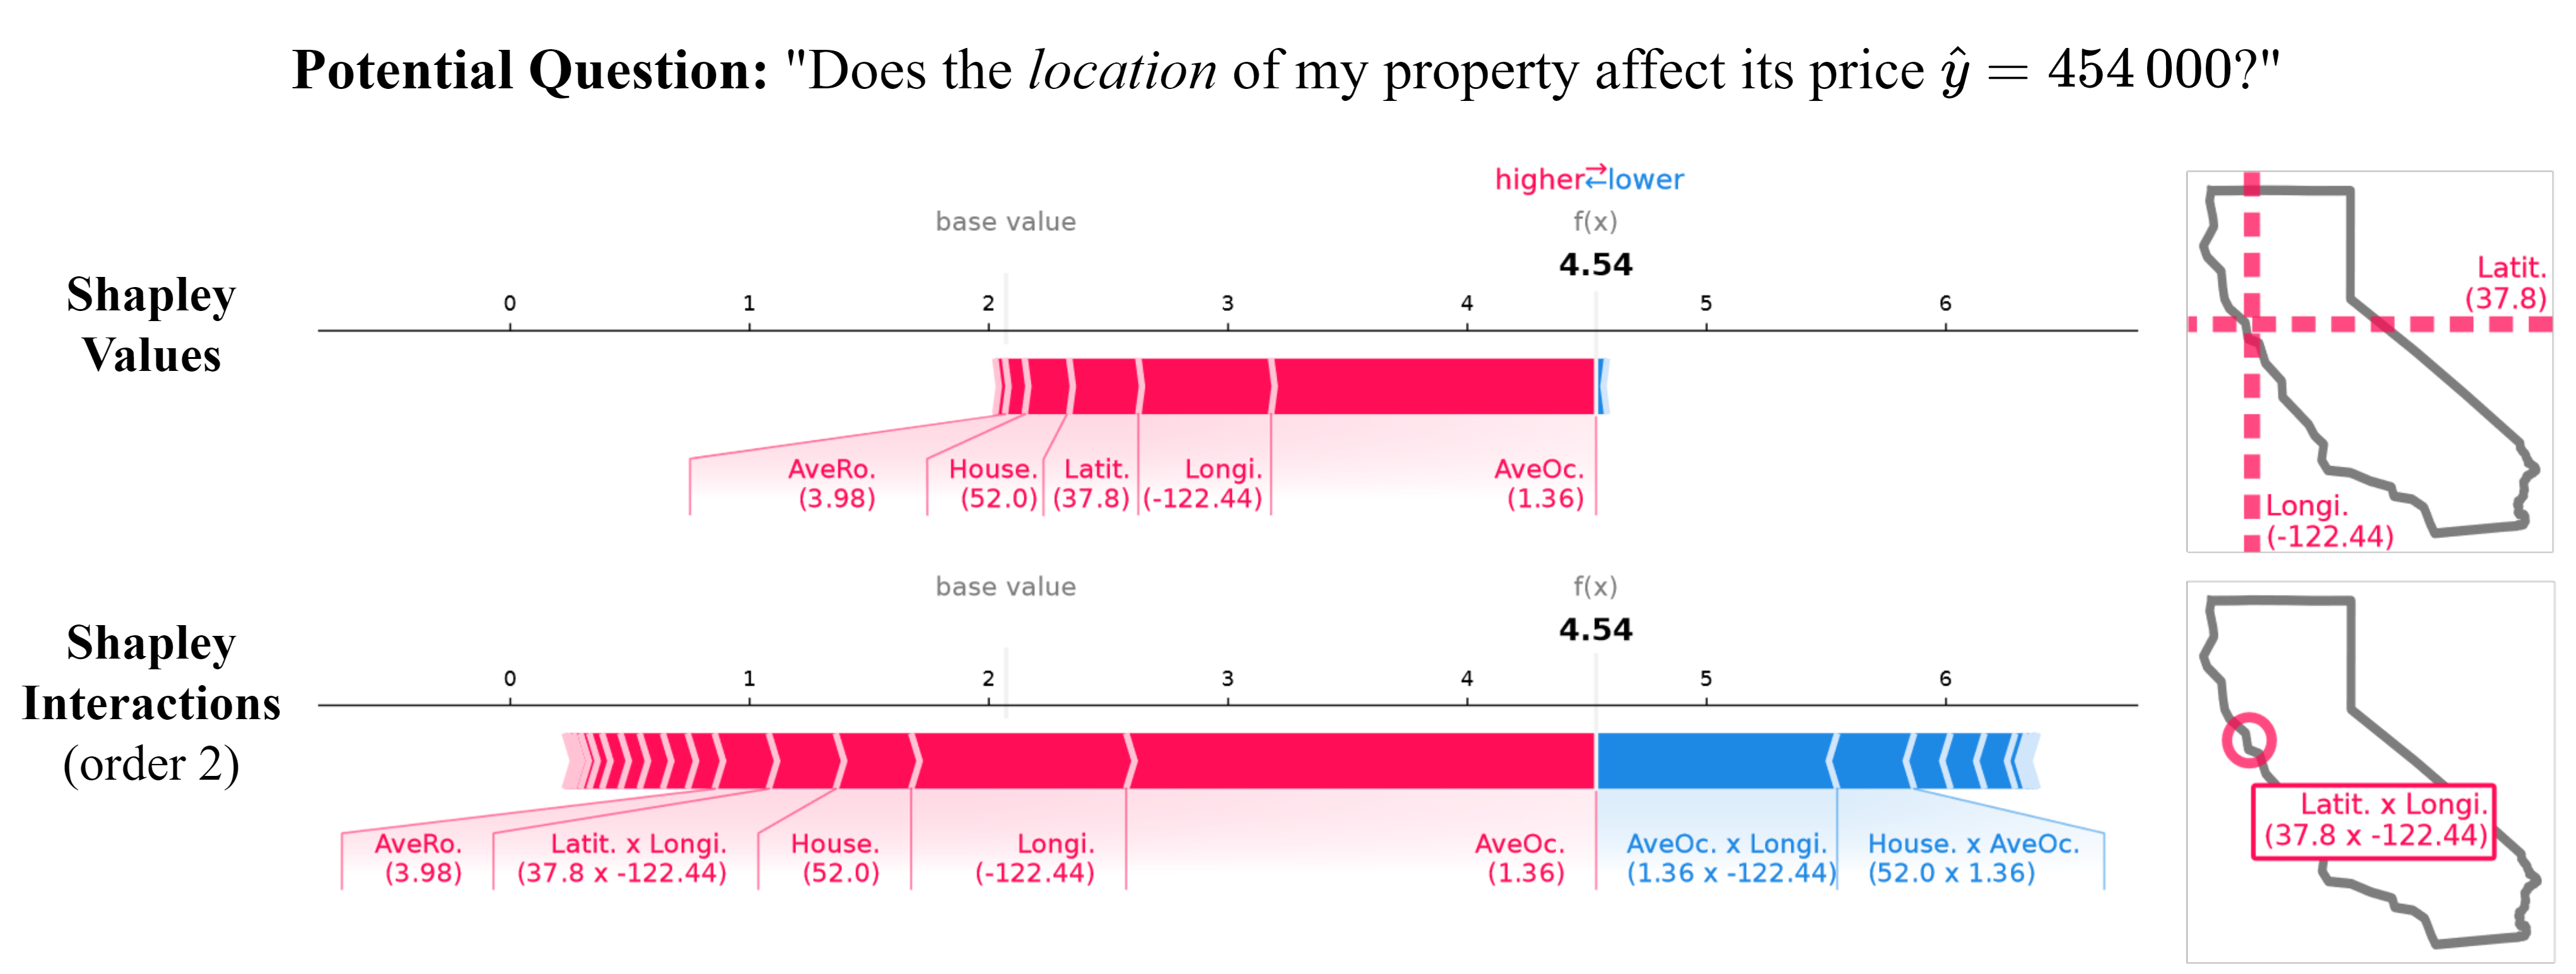
Compute any-order feature interactions
Explain your models with Shapley interactions:
Just load your data and model, and then use a shapiq.Explainer to compute Shapley interactions.
import shapiq
# load data
X, y = shapiq.load_california_housing(to_numpy=True)
# train a model
from sklearn.ensemble import RandomForestRegressor
model = RandomForestRegressor()
model.fit(X, y)
# set up an explainer with k-SII interaction values up to order 4
explainer = shapiq.TabularExplainer(
    model=model,
    data=X,
    index="k-SII",
    max_order=4
)
# explain the model's prediction for the first sample
interaction_values = explainer.explain(X[0], budget=256)
# analyse interaction values
print(interaction_values)

>> InteractionValues(
>>     index=k-SII, max_order=4, min_order=0, estimated=False,
>>     estimation_budget=256, n_players=8, baseline_value=2.07282292,
>>     Top 10 interactions:
>>         (0,): 1.696969079  # attribution of feature 0
>>         (0, 5): 0.4847876
>>         (0, 1): 0.4494288  # interaction between features 0 & 1
>>         (0, 6): 0.4477677
>>         (1, 5): 0.3750034
>>         (4, 5): 0.3468325
>>         (0, 3, 6): -0.320  # interaction between features 0 & 3 & 6
>>         (2, 3, 6): -0.329
>>         (0, 1, 5): -0.363
>>         (6,): -0.56358890
>> )
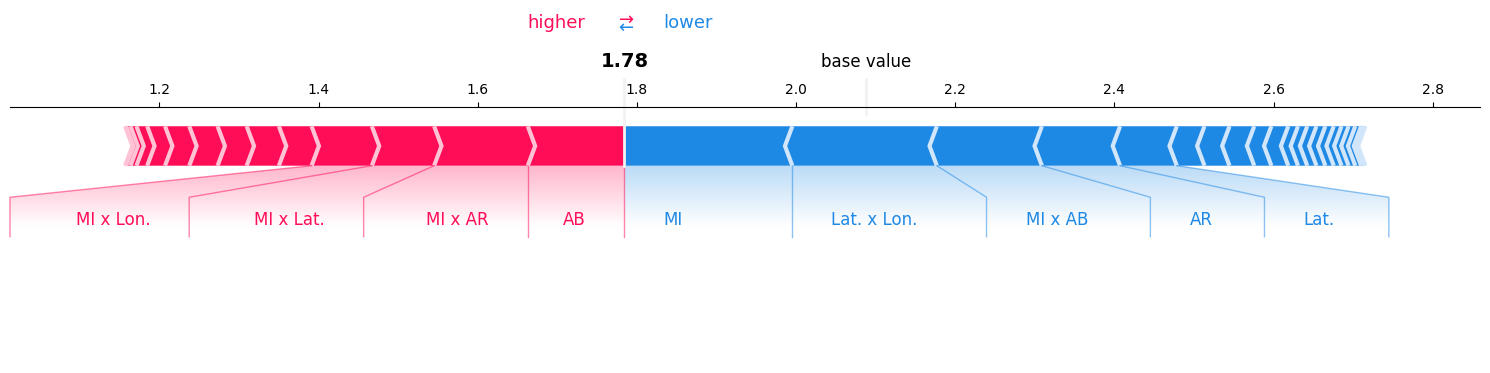
Compute Shapley values like you are used to with SHAP
If you are used to working with SHAP, you can also compute Shapley values with shapiq the same way:
You can load your data and model, and then use the shapiq.Explainer to compute Shapley values.
If you set the index to 'SV', you will get the Shapley values as you know them from SHAP.
import shapiq

data, model = ...  # get your data and model
explainer = shapiq.Explainer(
    model=model,
    data=data,
    index="SV",  # Shapley values
)
shapley_values = explainer.explain(data[0])
shapley_values.plot_force(feature_names=...)
Once you have the Shapley values, you can easily compute Interaction values as well:
explainer = shapiq.Explainer(
    model=model,
    data=data,
    index="k-SII",  # k-SII interaction values
    max_order=2     # specify any order you want
)
interaction_values = explainer.explain(data[0])
interaction_values.plot_force(feature_names=...)
Use ProxySPEX (Proxy SParse EXplainer) 
For large-scale use-cases you can also check out the 👓ProxySPEX approximator.
# load your data and model with large number of features
data, model, n_features = ...

# use the ProxySPEX approximator directly
approximator = shapiq.ProxySPEX(n=n_features, index="FBII", max_order=2)
fbii_scores = approximator.approximate(budget=2000, game=model.predict)

# or use ProxySPEX with an explainer
explainer = shapiq.Explainer(
    model=model,
    data=data,
    index="FBII",
    max_order=2,
    approximator="proxyspex"  # specify ProxySPEX as approximator
)
explanation = explainer.explain(data[0])
Visualize feature interactions
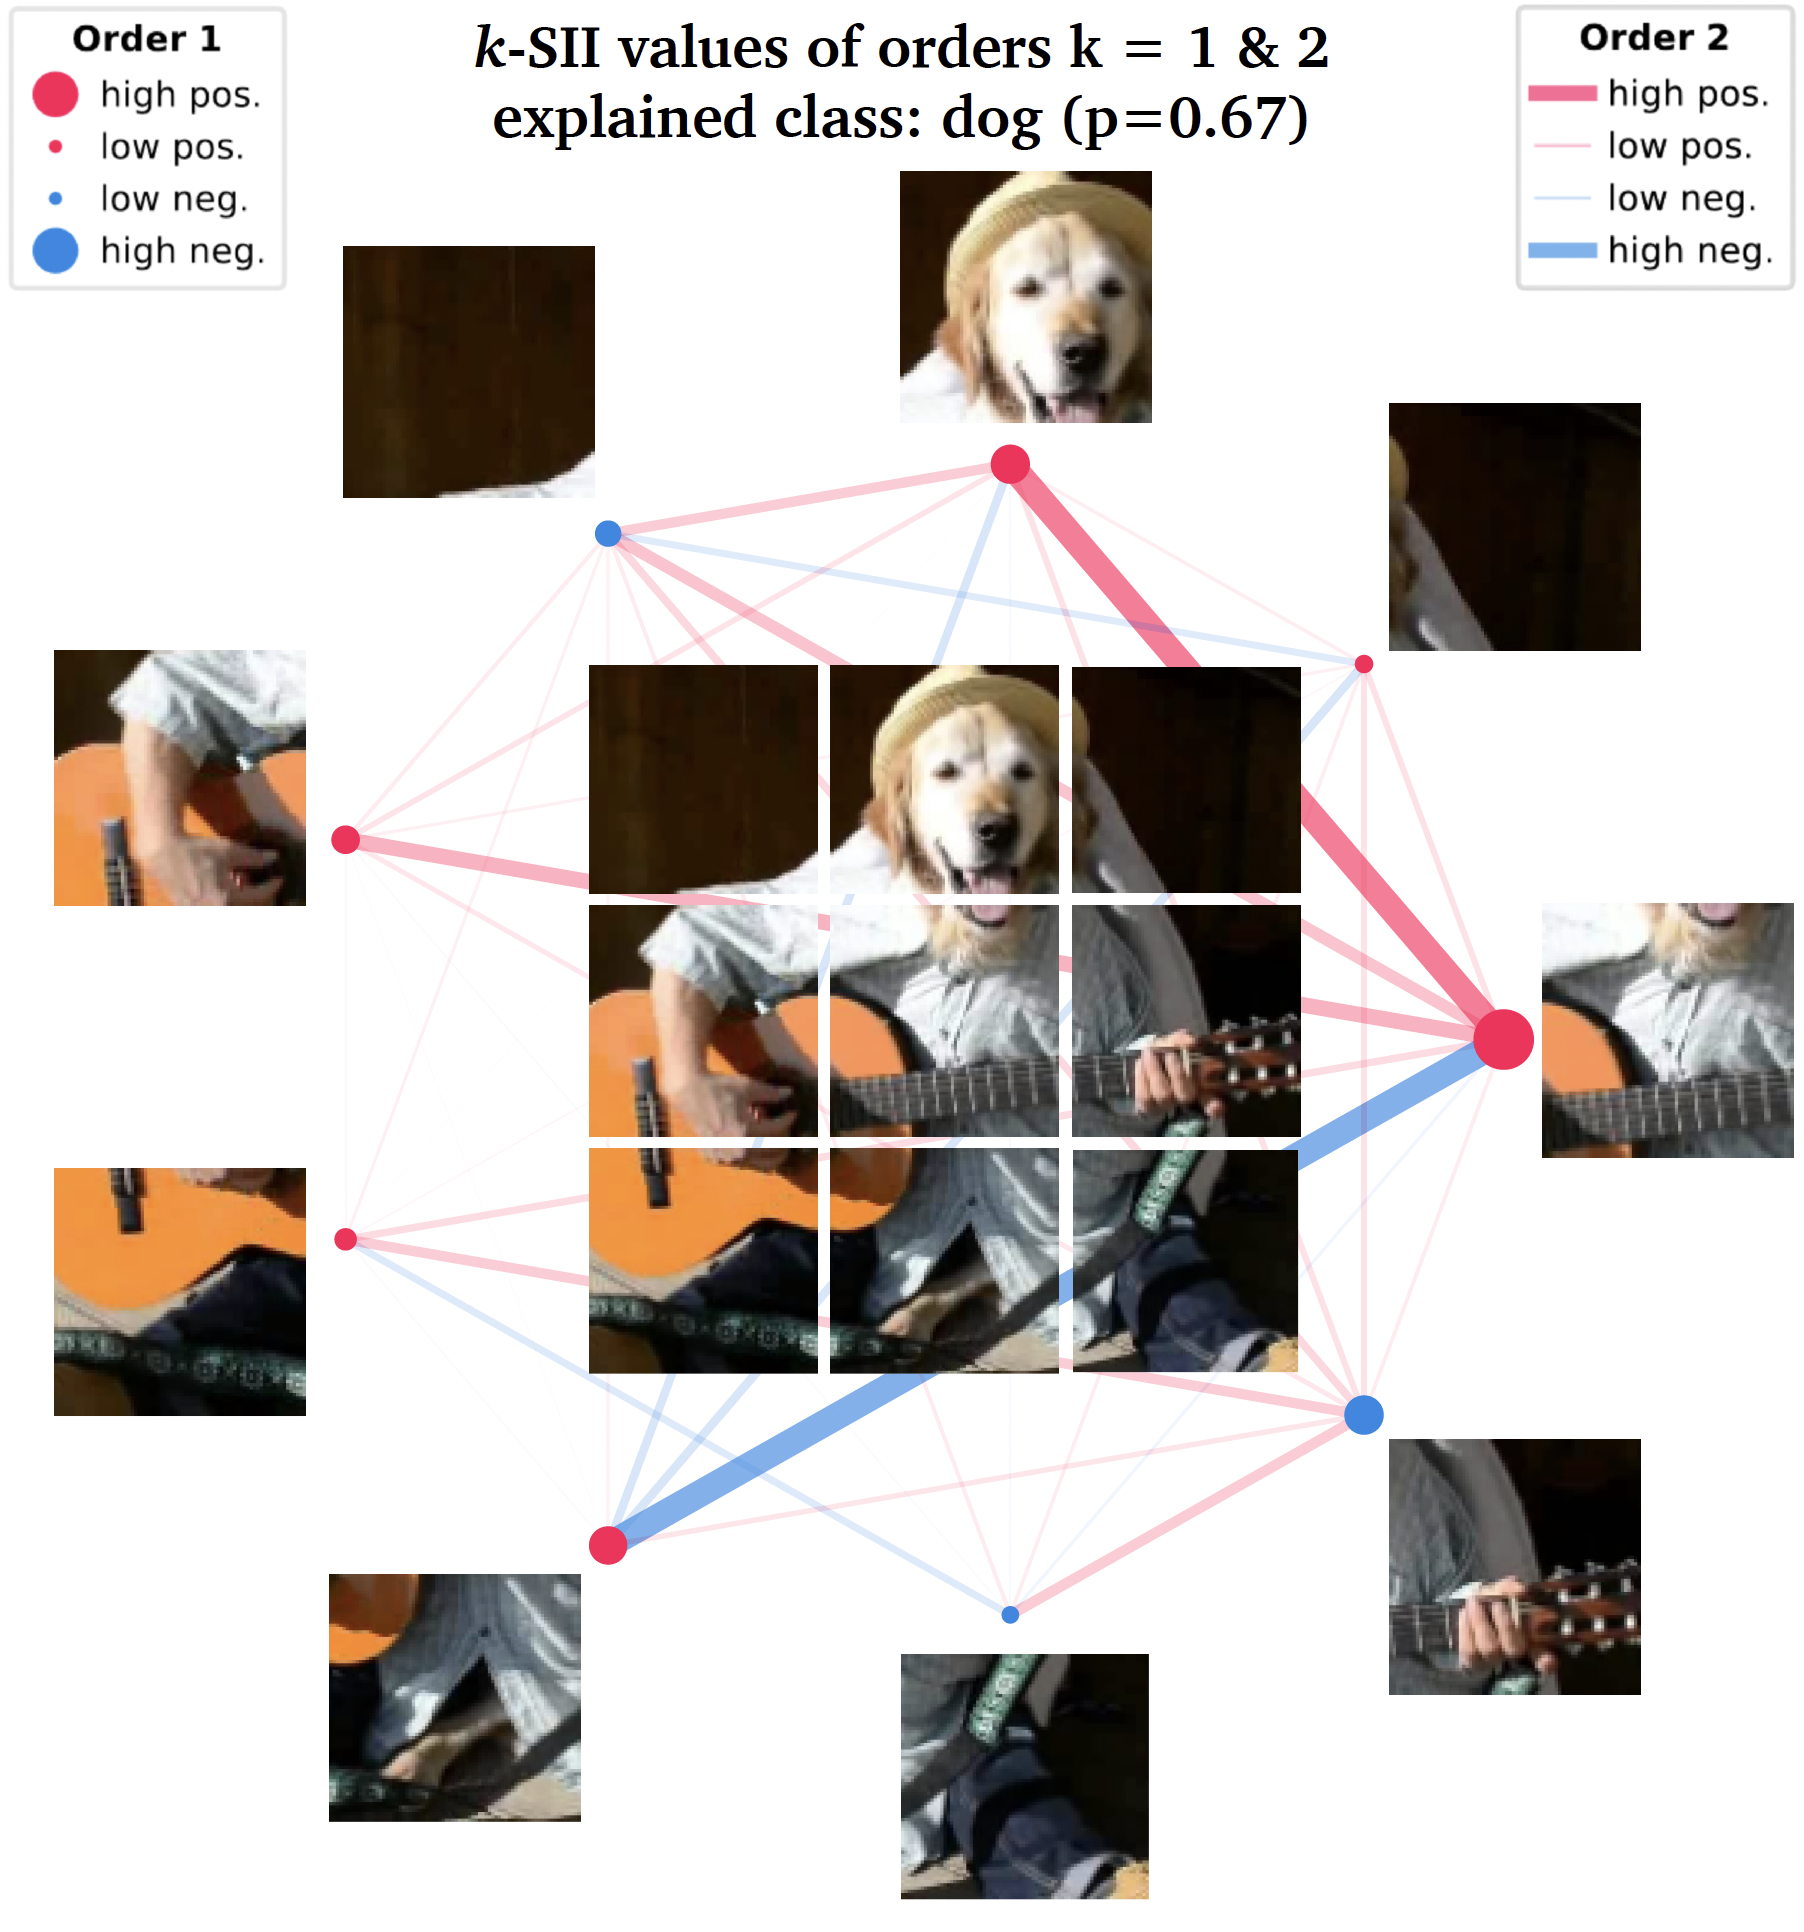
A handy way of visualizing interaction scores up to order 2 are network plots. You can see an example of such a plot below. The nodes represent feature attributions and the edges represent the interactions between features. The strength and size of the nodes and edges are proportional to the absolute value of attributions and interactions, respectively.
shapiq.network_plot(
    first_order_values=interaction_values.get_n_order_values(1),
    second_order_values=interaction_values.get_n_order_values(2)
)
# or use
interaction_values.plot_network()
The pseudo-code above can produce the following plot (here also an image is added):
Explain TabPFN
With shapiq you can also explain TabPFN by making use of the remove-and-recontextualize explanation paradigm implemented in shapiq.TabPFNExplainer.
import tabpfn, shapiq
data, labels = ...                    # load your data
model = tabpfn.TabPFNClassifier()     # get TabPFN
model.fit(data, labels)               # "fit" TabPFN (optional)
explainer = shapiq.TabPFNExplainer(   # setup the explainer
    model=model,
    data=data,
    labels=labels,
    index="FSII"
)
fsii_values = explainer.explain(data[0])  # explain with Faithful Shapley values
fsii_values.plot_force()               # plot the force plot
📖 Documentation with tutorials
The documentation of shapiq can be found at https://shapiq.readthedocs.io.
If you are new to Shapley values or Shapley interactions, we recommend starting with the introduction and the examples & tutorials.
There is a lot of great resources available to get you started with Shapley values and interactions.
💬 Citation
If you use shapiq and enjoy it, please consider citing our NeurIPS paper or consider starring this repository.
@inproceedings{Muschalik.2024b,
  title     = {shapiq: Shapley Interactions for Machine Learning},
  author    = {Maximilian Muschalik and Hubert Baniecki and Fabian Fumagalli and
               Patrick Kolpaczki and Barbara Hammer and Eyke H\"{u}llermeier},
  booktitle = {The Thirty-eight Conference on Neural Information Processing Systems Datasets and Benchmarks Track},
  year      = {2024},
  url       = {https://openreview.net/forum?id=knxGmi6SJi}
}
📦 Contributing
We welcome any kind of contributions to shapiq!
If you are interested in contributing, please check out our contributing guidelines.
If you have any questions, feel free to reach out to us.
We are tracking our progress via a project board and the issues section.
If you find a bug or have a feature request, please open an issue or help us fixing it by opening a pull request.
📜 License
This project is licensed under the MIT License.
💰 Funding
This work is openly available under the MIT license. Some authors acknowledge the financial support by the German Research Foundation (DFG) under grant number TRR 318/1 2021 – 438445824.
Built with ❤️ by the shapiq team.
Changelog
v1.5.2 (2026-06-12)
Highlights of new Features
- Added
'baseline'imputer support (BaselineImputer) to theshapiq_gamesLocalExplanationbenchmark games. - Added
ProxySHAPandProxySPEXas approximator options for theTabularExplainer,TabPFNExplainer, andAgnosticExplainerinshapiq.explainer. All three resolve approximators through the sharedsetup_approximatorconfiguration, soproxyshapandproxyspexare selectable wherever that configuration is used. - Added support for linear surrogate models and HPO-informed proxies in
ProxySHAPandRegressionMSR. The extraction route (linear coefficient read-out vs. exact tree read-out) is selected automatically from the proxy's base estimator type, and hyperparameter-search wrappers (scikit-learn'sGridSearchCV,RandomizedSearchCV,HalvingGridSearchCV, or SMAC) are fitted and theirbest_estimator_read out, for both linear and tree proxies. - Made
ProxySPEX'sproxy_modelconfigurable: it now also accepts the string tags"lightgbm"(default),"xgboost", and"tree", as well as custom tree estimators and HPO wrappers. The default remains the HPO-informed LightGBM proxy. ProxySHAP,ProxySPEX, andRegressionMSRno longer require LightGBM, XGBoost, or SMAC to be installed. When an optional backend is unavailable they warn and fall back to a scikit-learnDecisionTreeRegressor, so the proxy approximators always import and run.- Added log-space weight computation for the regression-based (
KernelSHAP,KernelSHAPIQ,RegressionFSII,RegressionFBII,kADDSHAP) and Monte Carlo (SHAPIQ,SVARMIQ) approximators, supporting Shapley approximation for feature counts beyond 1000.
Bugfix
- Fixes
InterventionalTreeExplainerrouting the explain point at float64 precision while tree thresholds and the reference data are float32. The explain point is now cast to float32 to match the model's evaluation. - Fixes
ProxySHAPandRegressionMSRalignment of sampled coalitions between the approximator and its adjustment method (random_statenow defaults to a fixed seed so both samplers reproduce identical coalitions). - Fixes
ProxySPEXpassinginitialize_dict=Trueto its sampler, which was unnecessary sinceProxySPEXdoes not return all possible interactions (nowFalse).
v1.5.1 (2026-05-30)
Bugfix
- Fixes segfaults on macOS when using shapiq alongside XGBoost or LightGBM by static-linking the OpenMP runtime instead of vendoring a dynamic
libomp.dylib. No API changes. #536
v1.5.0 (2026-05-29)
Highlights of new Features
- adds
ProxySHAPapproximator inshapiq.approximator.proxyfor proxy-model-accelerated interaction estimation - adds
RegressionMSRapproximator inshapiq.approximator.proxyfor proxy-model accelerated value estimation - refactors
shapiq.treeinto submodules:conversion/,linear/,interventional/with speedup through a C++ backend - adds
LinearTreeSHAPinshapiq.tree.linearfor fast first-order Shapley value computation - adds
InterventionalTreeExplainerinshapiq.tree.interventional - adds
KNNExplainer,WeightedKNNExplainerandThresholdNNExplainerfor nearest neighbor models - changes the default for all user-facing
Explainerclasses toindex="SV",max_order=1(Shapley values) — see Breaking Changes below - adds
shapiq.scatter_plotfor SHAP-style scatter (dependence) plots of interaction values, supporting both first-order and higher-order interactions #516
Introducing ProxySHAP #501, Preprint
Adds ProxySHAP as a new approximator that accelerates Shapley interaction estimation by fitting a lightweight proxy tree model (XGBoost by default) on sampled coalitions, computing exact interactions for the proxy via the InterventionalTreeExplainer, and then optionally correcting for the approximation error on the true model.
Adds RegressionMSR as a new approximator that accelerates Shapley value estimation by fitting a lightweight proxy tree model (XGBoost by default) on sampled coalitions, computing exact interactions for the proxy via the InterventionalTreeExplainer, and then optionally correcting for the approximation error on the true model.
Introducing Explainers for Nearest Neighbor Models
Adds three new explainers, namely KNNExplainer, WeightedKNNExplainer and ThresholdNNExplainer, which efficiently compute explanations for nearest neighbor models from the scikit-learn library.
One application of these explainers is Data Valuation, i.e. the task of evaluating the usefulness of training data points for training models.
Python Version #497
- adds support for Python 3.14 making the package compatible with the latest Python version.
- drops support for Python 3.10 and 3.11. The minimum supported Python version is now 3.12.
- drops support for Intel (x86_64) macOS. No pre-built wheels are shipped for Intel-based Macs because
numbaandllvmlite(transitive dependencies viagalois) no longer publish x86_64 macOS wheels. Apple Silicon (arm64) macOS, Linux, and Windows are unaffected.
Removed Deprecated Features
- removes
path_to_valuesparameter fromshapiq.Game, which was previously deprecated. Useshapiq.Game.load()instead. #496 - removes pickle support from
shapiq.InteractionValues. JSON is now the only supported file format. UseInteractionValues.save()andInteractionValues.load()with JSON files. #496
Breaking Changes
Explainerdefault changed to Shapley values.Explainer,TabularExplainer,TabPFNExplainer,AgnosticExplainer, andTreeExplainernow default toindex="SV",max_order=1. Previously they defaulted toindex="k-SII",max_order=2. Users relying on the previous default must pass these arguments explicitly. NN explainers andProductKernelExplainerare unaffected — they already defaulted to"SV". Approximators and computers also retain their existing defaults.
Extending shapiq-games #476
- adds standard SHAP datasets for benchmarking in
shapiq_games.benchmark.local_xai. - adds all TabArena datasets for benchmarking in
shapiq_games.benchmark.local_xai.
Four adjustment strategies are supported:
"none": use proxy interactions directly (fastest, least accurate)"msr"/"svarm"/"kernel": unbiased adjustments via established estimators
This implementation relies on C-extension routines (compute_interactions_sparse) for high-throughput coalition evaluation.
Introducing LinearTreeSHAP #501
Adds LinearTreeSHAP — an efficient implementation of the Linear TreeSHAP algorithm (Yu et al., 2022) for computing first-order Shapley values on tree-based models.
Unlike TreeSHAPIQ, which supports any-order interactions, LinearTreeSHAP is optimized exclusively for Shapley values (index="SV") and achieves higher throughput by using a dedicated C++ extension (linear_tree_shap_iterative).
It is exported from shapiq.tree.LinearTreeSHAP. For further details we refer to the paper: Yu, S., Zheng, S., Chen, H., & Li, J. (2022). Linear TreeSHAP. NeurIPS 2022.
Complete Refactor of the shapiq.tree Module #501
The internal tree infrastructure has been fully reorganized into a clean subpackage layout:
shapiq/tree/
├── base.py              — TreeModel and EdgeTree data structures
├── treeshapiq.py        — TreeSHAP-IQ: any-order interactions via Chebyshev interpolation
├── explainer.py         — TreeExplainer (main user-facing API, unchanged interface)
├── validation.py        — validate_tree_model() for sklearn / XGBoost / LightGBM
├── utils.py             — helper utilities
├── conversion/          — tree-to-internal-format converters (sklearn, XGBoost, LightGBM)
├── linear/              — LinearTreeSHAP implementation
└── interventional/      — InterventionalTreeExplainer and InterventionalGame
The conversion of the tree methods has been moved to C++ giving at least 2x up to 6x times speeup over shap tree conversion.
Documentation and Examples
- removes all Jupyter notebooks from the library and moves the examples to a Sphinx-Gallery so they are built and tested as part of the documentation. #509
Performance
- speeds up the baseline imputer by removing a Python
forloop from its hot path. #498
Refactoring of spex module
- moves
ProxySPEXfromshapiq.approximator.sparsetoshapiq.approximator.proxy. Imports fromshapiq.approximator(i.e.from shapiq.approximator import ProxySPEX) are unchanged. - removes the
"proxyspex"option fromSparse.decoder_type; it now accepts only"soft"or"hard"(default"soft"). - moves
sparse-transformandgaloisout of the core dependencies. Install withpip install shapiq[sparse]to useSPEX/Sparse. - adds a
sparseextra (sparse-transform,galois) required byshapiq.approximator.sparse. - adds a
proxyextra (xgboost,lightgbm) required byshapiq.approximator.proxy(ProxySHAP,ProxySPEX,RegressionMSR).
Bugfix
- fixes a bug in tree conversion, such that tree models with no splits are still correctly parsed. #370
- fixes
min_orderinTreeExplainerso that it now actually restricts the returnedInteractionValuesto interactions of ordermin_order..max_order(min_order=0continues to include the empty interaction at the baseline value); invalid values now raise a clearValueError. #325 - fixes tree conversion breaking when the
LC_NUMERIClocale is not set to the standard"C"value. #515 - fixes a segfault in the
ProxySHAPC++ extension code. #506 - fixes a Out Of Memory (OOM) when values is an dictionary and n_players is large. #531
v1.4.1 (2025-11-10)
Bugfix
- fixes a bug in
ProxySPEXwhere thebaseline_valuewas set to a wrong id and not the correct score of the empty coalition. #469 - fixes the build process of
shapiqto correctly exclude all test/benchmark/docs/etc. files from the built package. #464
v1.4.0 (2025-10-31)
Introducing ProxySPEX #442
Adds the ProxySPEX approximator for efficient computation of sparse interaction values using the new ProxySPEX algorithm.
ProxySPEX is a direct extension of the SPEX algorithm, which uses clever fourier representations of the value function and analysis to identify the most relevant interactions (in terms of Moebius coefficients) and transforms them into summary scores (Shapley interactions).
One of the key innovations of ProxySPEX compared to SPEX is the use of a proxy model that approximates the original value function (uses a LightGBM model internally).
Notably, to run ProxySPEX, users have to install the lightgbm package in their environment.
For further details we refer to the paper, which will be presented at NeurIPS'2025: Butler, L., Kang, J.S., Agarwal, A., Erginbas, Y.E., Yu, Bin, Ramchandran, K. (2025). ProxySPEX: Inference-Efficient Interpretability via Sparse Feature Interactions in LLMs. arxiv
Introducing ProductKernelExplainer #431
The ProductKernelExplainer is a new model-specific explanation method for machine learning models that utilize Product Kernels, such as Gaussian Processes and Support Vector Machines.
Similar to the TreeExplainer, it uses a specific computation scheme that leverages the structure of the underlying product kernels to efficiently compute exact Shapley values.
Note, this explainer is only able to compute Shapley values (not higher-order interactions yet).
For further details we refer to the paper: Mohammadi, M., Chau, S.-L., Muandet, K. Computing Exact Shapley Values in Polynomial Time for Product-Kernel Methods. arxiv
New Conditional Imputation Methods #435
Based on traditional statistical methods, we implemented two new conditional imputation methods named GaussianImputer and GaussianCopulaImputer within the shapiq.imputer module.
Both imputation methods are designed to handle missing feature imputation in a way that respects the underlying data distribution with the assumption that the data follows a multivariate Gaussian distribution (GaussianImputer) or can be represented with Gaussian copulas (GaussianCopulaImputer).
In practice, this assumption may often be violated, but these methods can still provide reasonable imputations in many scenarios and serve as a useful benchmark enabling easier research in the field of conditional imputation for Shapley value explanations.
Shapiq Statically Typechecked #430
We have introduced static type checking to shapiq using Pyright, and integrated it into our pre-commit hooks.
This ensures that type inconsistencies are caught early during development, improving code quality and maintainability.
Developers will now benefit from immediate feedback on type errors, making the codebase more robust and reliable as it evolves.
Separation of shapiq into shapiq, shapiq_games, and shapiq-benchmark #459
We have begun the process of modularizing the shapiq package by splitting it into three distinct packages: shapiq, shapiq_games, and shapiq-benchmark.
- The
shapiqpackage now serves as the core library. It contains the main functionality, including approximators, explainers, computation routines, interaction value logic, and plotting utilities. - The new
shapiq_gamespackage includes examples and utilities for defining custom cooperative games using theshapiq.GameAPI. Although it lives in the same repository asshapiq, it is designed to be installable and usable as a standalone package. Internally, its source code is available via theshapiq_gamessubmodule. Dependencies for this package can be managed via extras (e.g.,uv pip install shapiq[games]) or by installingshapiq_gamesdirectly. - The
shapiq-benchmarkpackage is hosted in a separate repository and is intended for conducting benchmarks. It builds on top of bothshapiqandshapiq_games, and includes benchmarking utilities, datasets, and game configurations for evaluating the performance of different approximators and explainers. It can be installed viapip install shapiq-benchmark.
This restructuring aims to improve maintainability and development scalability. The core shapiq package will continue to receive the majority of updates and enhancements, and keeping it streamlined ensures better focus and usability. Meanwhile, separating games and benchmarking functionality allows these components to evolve more independently while maintaining compatibility through clearly defined dependencies.
List of All New Features
- adds the ProxySPEX (Proxy Sparse Explanation) module in
approximator.sparsefor even more efficient computation of sparse interaction values #442 - uses
predict_logitsmethod of sklearn-like classifiers if available in favor ofpredict_probato support models that also offer logit outputs like TabPFNClassifier for better interpretability of the explanations #426 - adds the
shapiq.explainer.ProductKernelExplainerfor model-specific explanation of Product Kernel based models like Gaussian Processes and Support Vector Machines. #431 - adds the
GaussianImputerandGaussianCopulaImputerclasses to theshapiq.imputermodule for conditional imputation based on Gaussian assumptions. #435 - speeds up the imputation process in
MarginalImputerby dropping an unnecessary loop #449 - makes
n_playersargument ofshapiq.ExactComputeroptional when ashapiq.Gameobject is passed #388
Removed Features and Breaking Changes
- removes the ability to load
InteractionValuesfrom pickle files. This is now deprecated and will be removed in the next release. UseInteractionValues.save(..., as_json=True)to save interaction values as JSON files instead. #413 - removes
coalition_lookupandvalue_storageproperties fromshapiq.Gamesince the seperated view on game values and coalitions they belong to is now outdated. Use theshapiq.Game.game_valuesdictionary instead. #430 - reorders the arguments of
shapiq.ExactComputer's constructor to haven_playersbe optional if ashapiq.Gameobject is passed. #388
Bugfixes
- fixes a bug where RegressionFBII approximator was throwing an error when the index was
'BV'or'FBII'.#420 - allows subtraction and addition of
InteractionValuesobjects with differentindexattributes by ignoring and raising a warning instead of an error. The resultingInteractionValuesobject will have theindexof the first object. #423
Maintenance and Development
- refactored the
shapiq.Gamesandshapiq.InteractionValuesAPI by adding an interactions and game_values dictionary as the main data structure to store the interaction scores and game values. This allows for more efficient storage and retrieval of interaction values and game values, as well as easier manipulation of the data. #419 - addition and subtraction of InteractionValues objects (via
shapiq.InteractionValues.__add__) now also works for different indices, which will raise a warning and will return a new InteractionValues object with the index set of the first. #422 - refactors the
shapiq.ExactComputerto allow for initialization without passing n_players when ashapiq.Gameobject is passed #388. Also introduces a tighter type hinting for theindexparameter usingLiteraltypes. #450 - removes zeros from the
InteractionValues.coalition_lookupfrom theMoebiusConverterfor better memory efficiency. #369
Docs
- added an example notebook for
InteractionValues, highlighting Initialization, Modification, Visualization and Save and Loading. - makes API reference docs more consistent by adding missing docstrings and improving existing ones across the package. #420, #437, #452 among others.
v1.3.2 (2025-10-14)
Hotfix
Removes overrides import in tabular explainer, which is not part of the package dependencies resulting in an ImportError when importing shapiq. #436
v1.3.1 (2025-07-11)
New Features
- adds the
shapiq.plot.beesvarm_plot()function to shapiq. The beeswarm plot was extended to also support interactions of features. Beeswarm plots are useful in visualizing dependencies between feature values. The beeswarm plot was adapted from the SHAP library by sub-dividing the y-axis for each interaction term. #399 - adds JSON support to
InteractionValuesandGameobjects, allowing for easy serialization and deserialization of interaction values and game objects #412 usage ofpickleis now deprecated. This change allows us to revamp the data structures in the future and offers more flexibility.
Testing, Code-Quality and Documentation
- adds a testing suite for testing deprecations in
tests/tests_deprecations/which allows for easier deprecation managment and tracking of deprecated features #412
Deprecated
- The
Game(path_to_values=...)constructor is now deprecated and will be removed in version 1.4.0. UseGame.load(...)orGame().load_values(...)instead. - Saving and loading
InteactionValuesviaInteractionValues.save(..., as_pickle=True)andInteractionValues.save(..., as_npz=True)is now deprecated and will be removed in version 1.4.0. UseInteractionValues.save(...)to save as json.
v1.3.0 (2025-06-17)
Highlights
shapiq.SPEX(Sparse Exact) approximator for efficient computation of sparse interaction values for really large models and games. Paper: SPEX: Scaling Feature Interaction Explanations for LLMsshapiq.AgnosticExplainera generic explainer that works for any value function orshapiq.Gameobject, allowing for more flexibility in explainers.- prettier graph-based plots via
shapiq.si_graph_plot()andshapiq.network_plot(), which now use the same backend for more flexibility and easier maintenance.
New Features
- adds the SPEX (Sparse Exact) module in
approximator.sparsefor efficient computation of sparse interaction values #379 - adds
shapiq.AgnosticExplainerwhich is a generic explainer that can be used for any value function orshapiq.Gameobject. This allows for more flexibility in the explainers. #100, #395 - changes
budgetto be a mandatory parameter given to theTabularExplainer.explain()method #355 - changes logic of
InteractionValues.get_n_order()function to be callable with either theorder: intparameter and optional assignment ofmin_order: intandmax_order: intparameters or with the min/max order parameters #372 - renamed
min_percentageparameter in the force plot tocontribution_thresholdto better reflect its purpose #391 - adds
verboseparameter to theExplainer'sexplain_X()method to control weather a progress bar is shown or not which is defaulted toFalse. #391 - made
InteractionValues.get_n_order()andInteractionValues.get_n_order_values()function more efficient by iterating over the stored interactions and not over the powerset of all potential interactions, which made the function not usable for higher player counts (models with many features, and results obtained fromTreeExplainer). Note, this change does not really helpget_n_order_values()as it still needs to create a numpy array of shapen_playerstimesorder#372 - streamlined the
network_plot()plot function to use thesi_graph_plot()as its backend function. This allows for more flexibility in the plot function and makes it easier to use the same code for different purposes. In addition, thesi_graph_plotwas modified to make plotting more easy and allow for more flexibility with new parameters. #349 - adds
Game.compute()method to theshapiq.Gameclass to compute game values without changing the state of the game object. The compute method also introduces ashapiq.utils.sets.generate_interaction_lookup_from_coalitions()utility method which creates an interaction lookup dict from an array of coalitions. #397 - streamlines the creation of network plots and graph plots which now uses the same backend. The network plot via
shapiq.network_plot()orInteractionValues.plot_network()is now a special case of theshapiq.si_graph_plot()andInteractionValues.plot_si_graph(). This allows to create more beautiful plots and easier maintenance in the future. #349
Testing, Code-Quality and Documentation
- activates
"ALL"rules inruff-formatconfiguration to enforce stricter code quality checks and addressed around 500 (not automatically solvable) issues in the code base. #391 - improved the testing environment by adding a new fixture module containing mock
InteractionValuesobjects to be used in the tests. This allows for more efficient and cleaner tests, as well as easier debugging of the tests #372 - removed check and error message if the
indexparameter is not in the list of available indices in theTabularExplainersince the type hints were replaced by Literals #391 - removed multiple instances where
shapiqtests if some approximators/explainers can be instantiated with certain indices or not in favor of using Literals in the__init__method of the approximator classes. This allows for better type hinting and IDE support, as well as cleaner code. #391 - Added documentation for all public modules, classes, and functions in the code base to improve the documentation quality and make it easier to understand how to use the package. #391
- suppress a
RuntimeWarninginRegressionapproximatorssolve_regression()method when the solver is not able to find good interim solutions for the regression problem. - refactors the tests into
tests_unit/andtests_integration/to better separate unit tests from integration tests. #395 - adds new integration tests in
tests/tests_integration/test_explainer_california_housingwhich compares the different explainers against ground-truth interaction values computed byshapiq.ExactComputerand interaction values stored on disk as a form of regression test. This test should help finding bugs in the future when the approximators, explainers, or exact computation are changed. #395
Bug Fixes
- fixed a bug in the
shapiq.waterfall_plotfunction that caused the plot to not display correctly resulting in cutoff y_ticks. Additionally, the file was renamed fromwatefall.pytowaterfall.pyto match the function name #377 - fixes a bug with
TabPFNExplainer, where the model was not able to be used for predictions after it was explained. This was due to the model being fitted on a subset of features, which caused inconsistencies in the model's predictions after explanation. The fix includes that after each call to theTabPFNImputer.value_function, the tabpfn model is fitted on the whole dataset (without omitting features). This means that the original model can be used for predictions after it has been explained. #396. - fixed a bug in computing
BIIorBVindices withshapiq.approximator.MonteCarloapproximators (affectingSHAP-IQ,SVARMandSVARM-IQ). All orders of BII should now be computed correctly. #395
v1.2.3 (2025-03-24)
- substantially improves the runtime of all
Regressionapproximators by a) a faster pre-computation of the regression matrices and b) a faster computation of the weighted least squares regression #340 - removes
sample_replacementsparameter fromMarginalImputerand removes the DeprecationWarning for it - adds a trivial computation to
TreeSHAP-IQfor trees that use only one feature in the tree (this works for decision stumps or trees splitting on only one feature multiple times). In such trees, the computation is trivial as the whole effect of $\nu(N) - \nu(\emptyset)$ is all on the main effect of the single feature and there is no interaction effect. This expands on the fix in v1.2.1 #286. - fixes a bug with xgboost where feature names where trees that did not contain all features would lead
TreeExplainerto fail - fixes a bug with
stacked_bar_plotwhere the higher order interactions were inflated by the lower order interactions, thus wrongly showing the higher order interactions as higher than they are - fixes a bug where
InteractionValues.get_subset()returns a faultycoalition_lookupdictionary pointing to indices outside the subset of players #336 - updates default value of
TreeExplainer'smin_orderparameter from 1 to 0 to include the baseline value in the interaction values as per default - adds the
RegressionFBIIapproximator to estimate Faithful Banzhaf interactions via least squares regression #333. Additionally, FBII support was introduced in TabularExplainer and MonteCarlo-Approximator. - adds a
RandomGameclass as part ofshapiq.games.benchmarkwhich always returns a random vector of integers between 0 and 100.
v1.2.2 (2025-03-11)
- changes python support to 3.10-3.13 #318
- fixes a bug that prohibited importing shapiq in environments without write access #326
- adds
ExtraTreeRegressorsto supported models #309
v1.2.1 (2025-02-17)
- fixes bugs regarding plotting #315 and #316
- fixes a bug with TreeExplainer and Trees that consist of only one feature #286
- fixes SV init with explainer for permutation, svarm, kernelshap, and unbiased kernelshap #319
- adds a progress bar to
explain_X()#324
v1.2.0 (2025-01-15)
- adds
shapiq.TabPFNExplaineras a specialized version of theshapiq.TabularExplainerwhich offers a streamlined variant of the explainer for the TabPFN model #301 - handles
explainer.explain()now through a common interface for all explainer classes which now need to implement aexplain_function()method - adds the baseline_value into the InteractionValues object's value storage for the
()interaction ifmin_order=0(default usually) for all indices that are not ``SII```(SII has another baseline value) such that the values are efficient (sum up to the model prediction) without the awkward handling of the baseline_value attribute - renames
game_funparameter inshapiq.ExactComputertogame#297 - adds a TabPFN example notebook to the documentation
- removes warning when class_index is not provided in explainers #298
- adds the
sentence_plotfunction to theplotmodule to visualize the contributions of words to a language model prediction in a sentence-like format - makes abbreviations in the
plotmodule optional #281 - adds the
upset_plotfunction to theplotmodule to visualize the interactions of higher-order #290 - adds support for IsoForest models to explainer and tree explainer #278
- adds support for sub-selection of players in the interaction values data class #276 which allows retrieving interaction values for a subset of players
- refactors game theory computations like
ExactComputer,MoebiusConverter,core, among others to be more modular and flexible into thegame_theorymodule #258 - improves quality of the tests by adding many more semantic tests to the different interaction indices and computations #285
v1.1.1 (2024-11-13)
Improvements and Ease of Use
- adds a
class_indexparameter toTabularExplainerandExplainerto specify the class index to be explained for classification models #271 (renamesclass_labelparameter in TreeExplainer toclass_index) - adds support for
PyTorchmodels toExplainer#272 - adds new tests comparing
shapiqoutputs for SVs with alues computed withshap - adds new tests for checking
shapiqexplainers with different types of models
Bug Fixes
- fixes a bug that
RandomForestClassifiermodels were not working with theTreeExplainer#273
v1.1.0 (2024-11-07)
New Features and Improvements
- adds computation of the Egalitarian Core (
EC) and Egalitarian Least-Core (ELC) to theExactComputer#182 - adds
waterfall_plot#34 that visualizes the contributions of features to the model prediction - adds
BaselineImputer#107 which is now responsible for handling thesample_replacementsparameter. Added a DeprecationWarning for the parameter inMarginalImputer, which will be removed in the next release. - adds
joint_marginal_distributionparameter toMarginalImputerwith default valueTrue#261 - renames explanation graph to
si_graph get_n_ordernow has optional lower/upper limits for the order- computing metrics for benchmarking now tries to resolve not-matching interaction indices and will throw a warning instead of a ValueError #179
- add a legend to benchmark plots #170
- refactored the
shapiq.games.benchmarkmodule into a separateshapiq.benchmarkmodule by moving all but the benchmark games into the new module. This closes #169 and makes benchmarking more flexible and convenient. - a
shapiq.Gamecan now be called more intuitively with coalitions data types (tuples of int or str) and also allows to addplayer_namesto the game at initialization #183 - improve tests across the package
Documentation
- adds a notebook showing how to use custom tree models with the
TreeExplainer#66 - adds a notebook show how to use the
shapiq.GameAPI to create custom games #184 - adds a notebook showing hot to visualize interactions #252
- adds a notebook showing how to compute Shapley values with
shapiq#193 - adds a notebook for conducting data valuation #190
- adds a notebook showcasing introducing the Core and how to compute it with
shapiq#191
Bug Fixes
- fixes a bug with SIs not adding up to the model prediction because of wrong values in the empty set #264
- fixes a bug that
TreeExplainerdid not have the correct baseline_value when using XGBoost models #250 - fixes the force plot not showing and its baseline value
v1.0.1 (2024-06-05)
- add
max_order=1toTabularExplainerandTreeExplainer - fix
TreeExplainer.explain_X(..., n_jobs=2, random_state=0)
v1.0.0 (2024-06-04)
Major release of the shapiq Python package including (among others):
approximatormodule implements over 10 approximators of Shapley values and interaction indices.exactmodule implements a computer for over 10 game theoretic concepts like interaction indices or generalized values.gamesmodule implements over 10 application benchmarks for the approximators.explainermodule includes aTabularExplainerandTreeExplainerfor any-order feature interactions of machine learning model predictions.interaction_valuesmodule implements a data class to store and analyze interaction values.plotmodule allows visualizing interaction values.datasetsmodule loads datasets for testing and examples.
Documentation of shapiq with tutorials and API reference is available at https://shapiq.readthedocs.io
Project details
Verified details
These details have been verified by PyPIProject links
GitHub Statistics
Maintainers
Release history Release notifications | RSS feed


Download files
Download the file for your platform. If you're not sure which to choose, learn more about installing packages.
Source Distribution
Built Distributions
Filter files by name, interpreter, ABI, and platform.
If you're not sure about the file name format, learn more about wheel file names.
Copy a direct link to the current filters
File details
Details for the file shapiq-1.5.2.tar.gz.
File metadata
- Download URL: shapiq-1.5.2.tar.gz
- Upload date:
- Size: 15.2 MB
- Tags: Source
- Uploaded using Trusted Publishing? Yes
- Uploaded via: twine/6.1.0 CPython/3.13.13
File hashes
| Algorithm | Hash digest | |
|---|---|---|
| SHA256 |
6336d764ce27836b69a1d3283392d69c8c2f4dcd3f52e19d2ad037d5aac1708c
|
|
| MD5 |
a0d79d3542dddcd6ce960457f86d6374
|
|
| BLAKE2b-256 |
ecbb940b6af2c90238873b4f22011a2f2f924111bde12abeac83294d32111a94
|
Provenance
The following attestation bundles were made for shapiq-1.5.2.tar.gz:
Publisher:
python-publish.yml on mmschlk/shapiq
-
Statement:
-
Statement type:
https://in-toto.io/Statement/v1 -
Predicate type:
https://docs.pypi.org/attestations/publish/v1 -
Subject name:
shapiq-1.5.2.tar.gz -
Subject digest:
6336d764ce27836b69a1d3283392d69c8c2f4dcd3f52e19d2ad037d5aac1708c - Sigstore transparency entry: 1805903174
- Sigstore integration time:
-
Permalink:
mmschlk/shapiq@1b8b64339e9e4238ec79c1cdd349f967b4b0301a -
Branch / Tag:
refs/tags/v1.5.2 - Owner: https://github.com/mmschlk
-
Access:
public
-
Token Issuer:
https://token.actions.githubusercontent.com -
Runner Environment:
github-hosted -
Publication workflow:
python-publish.yml@1b8b64339e9e4238ec79c1cdd349f967b4b0301a -
Trigger Event:
release
-
Statement type:
File details
Details for the file shapiq-1.5.2-cp314-cp314-win_amd64.whl.
File metadata
- Download URL: shapiq-1.5.2-cp314-cp314-win_amd64.whl
- Upload date:
- Size: 15.8 MB
- Tags: CPython 3.14, Windows x86-64
- Uploaded using Trusted Publishing? Yes
- Uploaded via: twine/6.1.0 CPython/3.13.13
File hashes
| Algorithm | Hash digest | |
|---|---|---|
| SHA256 |
6779bcc55841fe4977384a60051db54fc415fac3ffdb96feff969918937c1144
|
|
| MD5 |
6e90eb0a8ee78ac7a7087fa00bfb4936
|
|
| BLAKE2b-256 |
0b48e3595c9c650875dbe93a298f9f18b87ef4d125f1122ca7ee661f117e7c13
|
Provenance
The following attestation bundles were made for shapiq-1.5.2-cp314-cp314-win_amd64.whl:
Publisher:
python-publish.yml on mmschlk/shapiq
-
Statement:
-
Statement type:
https://in-toto.io/Statement/v1 -
Predicate type:
https://docs.pypi.org/attestations/publish/v1 -
Subject name:
shapiq-1.5.2-cp314-cp314-win_amd64.whl -
Subject digest:
6779bcc55841fe4977384a60051db54fc415fac3ffdb96feff969918937c1144 - Sigstore transparency entry: 1805903245
- Sigstore integration time:
-
Permalink:
mmschlk/shapiq@1b8b64339e9e4238ec79c1cdd349f967b4b0301a -
Branch / Tag:
refs/tags/v1.5.2 - Owner: https://github.com/mmschlk
-
Access:
public
-
Token Issuer:
https://token.actions.githubusercontent.com -
Runner Environment:
github-hosted -
Publication workflow:
python-publish.yml@1b8b64339e9e4238ec79c1cdd349f967b4b0301a -
Trigger Event:
release
-
Statement type:
File details
Details for the file shapiq-1.5.2-cp314-cp314-manylinux_2_24_x86_64.manylinux_2_28_x86_64.whl.
File metadata
- Download URL: shapiq-1.5.2-cp314-cp314-manylinux_2_24_x86_64.manylinux_2_28_x86_64.whl
- Upload date:
- Size: 17.4 MB
- Tags: CPython 3.14, manylinux: glibc 2.24+ x86-64, manylinux: glibc 2.28+ x86-64
- Uploaded using Trusted Publishing? Yes
- Uploaded via: twine/6.1.0 CPython/3.13.13
File hashes
| Algorithm | Hash digest | |
|---|---|---|
| SHA256 |
0323c0bc8e2ec0fa2340afdbb282644c5545fc939479cf5f399ce7a04ea34e67
|
|
| MD5 |
503549dcd9119e94ce4e75e34348b5b2
|
|
| BLAKE2b-256 |
4583fdd74ce3d181195d9d3b79fc757ff979e90913417a70679e0f6c94a0069b
|
Provenance
The following attestation bundles were made for shapiq-1.5.2-cp314-cp314-manylinux_2_24_x86_64.manylinux_2_28_x86_64.whl:
Publisher:
python-publish.yml on mmschlk/shapiq
-
Statement:
-
Statement type:
https://in-toto.io/Statement/v1 -
Predicate type:
https://docs.pypi.org/attestations/publish/v1 -
Subject name:
shapiq-1.5.2-cp314-cp314-manylinux_2_24_x86_64.manylinux_2_28_x86_64.whl -
Subject digest:
0323c0bc8e2ec0fa2340afdbb282644c5545fc939479cf5f399ce7a04ea34e67 - Sigstore transparency entry: 1805903217
- Sigstore integration time:
-
Permalink:
mmschlk/shapiq@1b8b64339e9e4238ec79c1cdd349f967b4b0301a -
Branch / Tag:
refs/tags/v1.5.2 - Owner: https://github.com/mmschlk
-
Access:
public
-
Token Issuer:
https://token.actions.githubusercontent.com -
Runner Environment:
github-hosted -
Publication workflow:
python-publish.yml@1b8b64339e9e4238ec79c1cdd349f967b4b0301a -
Trigger Event:
release
-
Statement type:
File details
Details for the file shapiq-1.5.2-cp314-cp314-macosx_12_0_arm64.whl.
File metadata
- Download URL: shapiq-1.5.2-cp314-cp314-macosx_12_0_arm64.whl
- Upload date:
- Size: 16.0 MB
- Tags: CPython 3.14, macOS 12.0+ ARM64
- Uploaded using Trusted Publishing? Yes
- Uploaded via: twine/6.1.0 CPython/3.13.13
File hashes
| Algorithm | Hash digest | |
|---|---|---|
| SHA256 |
bf3cd35fbd8b30b8fda35588e36a3851b4818e4dbd23e49aed9f4b252b3f51eb
|
|
| MD5 |
f3572ec53a3b9298ddd9dc620245a3c0
|
|
| BLAKE2b-256 |
0fac318d02f07dd27405b76d9d809424de2f1d870a80f5a51b50883c763d5b05
|
Provenance
The following attestation bundles were made for shapiq-1.5.2-cp314-cp314-macosx_12_0_arm64.whl:
Publisher:
python-publish.yml on mmschlk/shapiq
-
Statement:
-
Statement type:
https://in-toto.io/Statement/v1 -
Predicate type:
https://docs.pypi.org/attestations/publish/v1 -
Subject name:
shapiq-1.5.2-cp314-cp314-macosx_12_0_arm64.whl -
Subject digest:
bf3cd35fbd8b30b8fda35588e36a3851b4818e4dbd23e49aed9f4b252b3f51eb - Sigstore transparency entry: 1805903235
- Sigstore integration time:
-
Permalink:
mmschlk/shapiq@1b8b64339e9e4238ec79c1cdd349f967b4b0301a -
Branch / Tag:
refs/tags/v1.5.2 - Owner: https://github.com/mmschlk
-
Access:
public
-
Token Issuer:
https://token.actions.githubusercontent.com -
Runner Environment:
github-hosted -
Publication workflow:
python-publish.yml@1b8b64339e9e4238ec79c1cdd349f967b4b0301a -
Trigger Event:
release
-
Statement type:
File details
Details for the file shapiq-1.5.2-cp314-cp314-macosx_10_15_x86_64.whl.
File metadata
- Download URL: shapiq-1.5.2-cp314-cp314-macosx_10_15_x86_64.whl
- Upload date:
- Size: 16.0 MB
- Tags: CPython 3.14, macOS 10.15+ x86-64
- Uploaded using Trusted Publishing? Yes
- Uploaded via: twine/6.1.0 CPython/3.13.13
File hashes
| Algorithm | Hash digest | |
|---|---|---|
| SHA256 |
63ea88924704202b04691e5f8325d99a3c7a26f1631eb934978b52a9d785eeaa
|
|
| MD5 |
4b5a64bcfdd5414a3d2a5a60e85695fa
|
|
| BLAKE2b-256 |
a3dac27ab8e714d6cffc728362774e2ab8aab14563d0e7a25fb80da2d3c7749a
|
Provenance
The following attestation bundles were made for shapiq-1.5.2-cp314-cp314-macosx_10_15_x86_64.whl:
Publisher:
python-publish.yml on mmschlk/shapiq
-
Statement:
-
Statement type:
https://in-toto.io/Statement/v1 -
Predicate type:
https://docs.pypi.org/attestations/publish/v1 -
Subject name:
shapiq-1.5.2-cp314-cp314-macosx_10_15_x86_64.whl -
Subject digest:
63ea88924704202b04691e5f8325d99a3c7a26f1631eb934978b52a9d785eeaa - Sigstore transparency entry: 1805903225
- Sigstore integration time:
-
Permalink:
mmschlk/shapiq@1b8b64339e9e4238ec79c1cdd349f967b4b0301a -
Branch / Tag:
refs/tags/v1.5.2 - Owner: https://github.com/mmschlk
-
Access:
public
-
Token Issuer:
https://token.actions.githubusercontent.com -
Runner Environment:
github-hosted -
Publication workflow:
python-publish.yml@1b8b64339e9e4238ec79c1cdd349f967b4b0301a -
Trigger Event:
release
-
Statement type:
File details
Details for the file shapiq-1.5.2-cp313-cp313-win_amd64.whl.
File metadata
- Download URL: shapiq-1.5.2-cp313-cp313-win_amd64.whl
- Upload date:
- Size: 15.9 MB
- Tags: CPython 3.13, Windows x86-64
- Uploaded using Trusted Publishing? Yes
- Uploaded via: twine/6.1.0 CPython/3.13.13
File hashes
| Algorithm | Hash digest | |
|---|---|---|
| SHA256 |
c46560a9e63a7e986210dde141cad90f1bcb073702f4130e24eb71158524ea11
|
|
| MD5 |
d11cf49c232f699f08984317909f2a66
|
|
| BLAKE2b-256 |
1ef268c5d5a178601c5e4bd8b7c0bc57e580020da98c101d1a542e339b7b49a8
|
Provenance
The following attestation bundles were made for shapiq-1.5.2-cp313-cp313-win_amd64.whl:
Publisher:
python-publish.yml on mmschlk/shapiq
-
Statement:
-
Statement type:
https://in-toto.io/Statement/v1 -
Predicate type:
https://docs.pypi.org/attestations/publish/v1 -
Subject name:
shapiq-1.5.2-cp313-cp313-win_amd64.whl -
Subject digest:
c46560a9e63a7e986210dde141cad90f1bcb073702f4130e24eb71158524ea11 - Sigstore transparency entry: 1805903202
- Sigstore integration time:
-
Permalink:
mmschlk/shapiq@1b8b64339e9e4238ec79c1cdd349f967b4b0301a -
Branch / Tag:
refs/tags/v1.5.2 - Owner: https://github.com/mmschlk
-
Access:
public
-
Token Issuer:
https://token.actions.githubusercontent.com -
Runner Environment:
github-hosted -
Publication workflow:
python-publish.yml@1b8b64339e9e4238ec79c1cdd349f967b4b0301a -
Trigger Event:
release
-
Statement type:
File details
Details for the file shapiq-1.5.2-cp313-cp313-manylinux_2_24_x86_64.manylinux_2_28_x86_64.whl.
File metadata
- Download URL: shapiq-1.5.2-cp313-cp313-manylinux_2_24_x86_64.manylinux_2_28_x86_64.whl
- Upload date:
- Size: 17.4 MB
- Tags: CPython 3.13, manylinux: glibc 2.24+ x86-64, manylinux: glibc 2.28+ x86-64
- Uploaded using Trusted Publishing? Yes
- Uploaded via: twine/6.1.0 CPython/3.13.13
File hashes
| Algorithm | Hash digest | |
|---|---|---|
| SHA256 |
93f7579f33256ff203663a41c89b018ea1306b49c732f407b0f1f1b3764ba89c
|
|
| MD5 |
810a33dcf395449b6f0ff51ee1dd870f
|
|
| BLAKE2b-256 |
e9e6f91675239f7bea75d3f2cfe43c9203cd022ca801d2511b435e1520a14e85
|
Provenance
The following attestation bundles were made for shapiq-1.5.2-cp313-cp313-manylinux_2_24_x86_64.manylinux_2_28_x86_64.whl:
Publisher:
python-publish.yml on mmschlk/shapiq
-
Statement:
-
Statement type:
https://in-toto.io/Statement/v1 -
Predicate type:
https://docs.pypi.org/attestations/publish/v1 -
Subject name:
shapiq-1.5.2-cp313-cp313-manylinux_2_24_x86_64.manylinux_2_28_x86_64.whl -
Subject digest:
93f7579f33256ff203663a41c89b018ea1306b49c732f407b0f1f1b3764ba89c - Sigstore transparency entry: 1805903180
- Sigstore integration time:
-
Permalink:
mmschlk/shapiq@1b8b64339e9e4238ec79c1cdd349f967b4b0301a -
Branch / Tag:
refs/tags/v1.5.2 - Owner: https://github.com/mmschlk
-
Access:
public
-
Token Issuer:
https://token.actions.githubusercontent.com -
Runner Environment:
github-hosted -
Publication workflow:
python-publish.yml@1b8b64339e9e4238ec79c1cdd349f967b4b0301a -
Trigger Event:
release
-
Statement type:
File details
Details for the file shapiq-1.5.2-cp313-cp313-macosx_12_0_arm64.whl.
File metadata
- Download URL: shapiq-1.5.2-cp313-cp313-macosx_12_0_arm64.whl
- Upload date:
- Size: 16.0 MB
- Tags: CPython 3.13, macOS 12.0+ ARM64
- Uploaded using Trusted Publishing? Yes
- Uploaded via: twine/6.1.0 CPython/3.13.13
File hashes
| Algorithm | Hash digest | |
|---|---|---|
| SHA256 |
f9b098c3902107aad0967166e191f4efc9acf46683b754c1856dc23b781cf979
|
|
| MD5 |
421ac511c6893f3ab2296e9457ab93dc
|
|
| BLAKE2b-256 |
9a375174cc1042f1b53a84c3b5bd40f0d9987014320d0b5b59b2793174202837
|
Provenance
The following attestation bundles were made for shapiq-1.5.2-cp313-cp313-macosx_12_0_arm64.whl:
Publisher:
python-publish.yml on mmschlk/shapiq
-
Statement:
-
Statement type:
https://in-toto.io/Statement/v1 -
Predicate type:
https://docs.pypi.org/attestations/publish/v1 -
Subject name:
shapiq-1.5.2-cp313-cp313-macosx_12_0_arm64.whl -
Subject digest:
f9b098c3902107aad0967166e191f4efc9acf46683b754c1856dc23b781cf979 - Sigstore transparency entry: 1805903198
- Sigstore integration time:
-
Permalink:
mmschlk/shapiq@1b8b64339e9e4238ec79c1cdd349f967b4b0301a -
Branch / Tag:
refs/tags/v1.5.2 - Owner: https://github.com/mmschlk
-
Access:
public
-
Token Issuer:
https://token.actions.githubusercontent.com -
Runner Environment:
github-hosted -
Publication workflow:
python-publish.yml@1b8b64339e9e4238ec79c1cdd349f967b4b0301a -
Trigger Event:
release
-
Statement type:
File details
Details for the file shapiq-1.5.2-cp313-cp313-macosx_10_13_x86_64.whl.
File metadata
- Download URL: shapiq-1.5.2-cp313-cp313-macosx_10_13_x86_64.whl
- Upload date:
- Size: 16.0 MB
- Tags: CPython 3.13, macOS 10.13+ x86-64
- Uploaded using Trusted Publishing? Yes
- Uploaded via: twine/6.1.0 CPython/3.13.13
File hashes
| Algorithm | Hash digest | |
|---|---|---|
| SHA256 |
9afcabf8bca78e85bca51ee35ebed362e8eb64e3f163c793fdb88938735d8cc3
|
|
| MD5 |
aaf5130508558249431a7f2693df3f45
|
|
| BLAKE2b-256 |
5b7a1385732bacc2b8a94ef961bfbcd1ec5367e9e7f9fd9a8889ceba70fc0b60
|
Provenance
The following attestation bundles were made for shapiq-1.5.2-cp313-cp313-macosx_10_13_x86_64.whl:
Publisher:
python-publish.yml on mmschlk/shapiq
-
Statement:
-
Statement type:
https://in-toto.io/Statement/v1 -
Predicate type:
https://docs.pypi.org/attestations/publish/v1 -
Subject name:
shapiq-1.5.2-cp313-cp313-macosx_10_13_x86_64.whl -
Subject digest:
9afcabf8bca78e85bca51ee35ebed362e8eb64e3f163c793fdb88938735d8cc3 - Sigstore transparency entry: 1805903190
- Sigstore integration time:
-
Permalink:
mmschlk/shapiq@1b8b64339e9e4238ec79c1cdd349f967b4b0301a -
Branch / Tag:
refs/tags/v1.5.2 - Owner: https://github.com/mmschlk
-
Access:
public
-
Token Issuer:
https://token.actions.githubusercontent.com -
Runner Environment:
github-hosted -
Publication workflow:
python-publish.yml@1b8b64339e9e4238ec79c1cdd349f967b4b0301a -
Trigger Event:
release
-
Statement type:
File details
Details for the file shapiq-1.5.2-cp312-cp312-win_amd64.whl.
File metadata
- Download URL: shapiq-1.5.2-cp312-cp312-win_amd64.whl
- Upload date:
- Size: 15.9 MB
- Tags: CPython 3.12, Windows x86-64
- Uploaded using Trusted Publishing? Yes
- Uploaded via: twine/6.1.0 CPython/3.13.13
File hashes
| Algorithm | Hash digest | |
|---|---|---|
| SHA256 |
81e934435d2f91069b43aff7fe8280a7f0a43a2872c17a906e8bae6be0369c99
|
|
| MD5 |
4fab97cb24d5db566ffeba914d118270
|
|
| BLAKE2b-256 |
c681747eb3f7b1e2e956b58d6de2b8eee2067f2f1680984ab6fc1c422dd5eca1
|
Provenance
The following attestation bundles were made for shapiq-1.5.2-cp312-cp312-win_amd64.whl:
Publisher:
python-publish.yml on mmschlk/shapiq
-
Statement:
-
Statement type:
https://in-toto.io/Statement/v1 -
Predicate type:
https://docs.pypi.org/attestations/publish/v1 -
Subject name:
shapiq-1.5.2-cp312-cp312-win_amd64.whl -
Subject digest:
81e934435d2f91069b43aff7fe8280a7f0a43a2872c17a906e8bae6be0369c99 - Sigstore transparency entry: 1805903208
- Sigstore integration time:
-
Permalink:
mmschlk/shapiq@1b8b64339e9e4238ec79c1cdd349f967b4b0301a -
Branch / Tag:
refs/tags/v1.5.2 - Owner: https://github.com/mmschlk
-
Access:
public
-
Token Issuer:
https://token.actions.githubusercontent.com -
Runner Environment:
github-hosted -
Publication workflow:
python-publish.yml@1b8b64339e9e4238ec79c1cdd349f967b4b0301a -
Trigger Event:
release
-
Statement type:
File details
Details for the file shapiq-1.5.2-cp312-cp312-manylinux_2_24_x86_64.manylinux_2_28_x86_64.whl.
File metadata
- Download URL: shapiq-1.5.2-cp312-cp312-manylinux_2_24_x86_64.manylinux_2_28_x86_64.whl
- Upload date:
- Size: 17.4 MB
- Tags: CPython 3.12, manylinux: glibc 2.24+ x86-64, manylinux: glibc 2.28+ x86-64
- Uploaded using Trusted Publishing? Yes
- Uploaded via: twine/6.1.0 CPython/3.13.13
File hashes
| Algorithm | Hash digest | |
|---|---|---|
| SHA256 |
7d33fb803e344fd7308da4f4b5756040b789eceaa75b5ef103ba48931ff530e9
|
|
| MD5 |
d293a3ed12672b1c842b3f9e7a255dd9
|
|
| BLAKE2b-256 |
e81788285cdb09af0ba8b134d3820b83681c297e606c97550b9e00a7ba0c6b88
|
Provenance
The following attestation bundles were made for shapiq-1.5.2-cp312-cp312-manylinux_2_24_x86_64.manylinux_2_28_x86_64.whl:
Publisher:
python-publish.yml on mmschlk/shapiq
-
Statement:
-
Statement type:
https://in-toto.io/Statement/v1 -
Predicate type:
https://docs.pypi.org/attestations/publish/v1 -
Subject name:
shapiq-1.5.2-cp312-cp312-manylinux_2_24_x86_64.manylinux_2_28_x86_64.whl -
Subject digest:
7d33fb803e344fd7308da4f4b5756040b789eceaa75b5ef103ba48931ff530e9 - Sigstore transparency entry: 1805903184
- Sigstore integration time:
-
Permalink:
mmschlk/shapiq@1b8b64339e9e4238ec79c1cdd349f967b4b0301a -
Branch / Tag:
refs/tags/v1.5.2 - Owner: https://github.com/mmschlk
-
Access:
public
-
Token Issuer:
https://token.actions.githubusercontent.com -
Runner Environment:
github-hosted -
Publication workflow:
python-publish.yml@1b8b64339e9e4238ec79c1cdd349f967b4b0301a -
Trigger Event:
release
-
Statement type:
File details
Details for the file shapiq-1.5.2-cp312-cp312-macosx_12_0_arm64.whl.
File metadata
- Download URL: shapiq-1.5.2-cp312-cp312-macosx_12_0_arm64.whl
- Upload date:
- Size: 16.0 MB
- Tags: CPython 3.12, macOS 12.0+ ARM64
- Uploaded using Trusted Publishing? Yes
- Uploaded via: twine/6.1.0 CPython/3.13.13
File hashes
| Algorithm | Hash digest | |
|---|---|---|
| SHA256 |
7e276d7be3f711282919d4f82c75b41e3da2de92077f484ff0e724ed006d8782
|
|
| MD5 |
869192db52dcd6895dac6ed8c1f95a8d
|
|
| BLAKE2b-256 |
b88b3f2850f0a5f7b75e8aec6224d872086d6530892afcb73072b617b6f7849f
|
Provenance
The following attestation bundles were made for shapiq-1.5.2-cp312-cp312-macosx_12_0_arm64.whl:
Publisher:
python-publish.yml on mmschlk/shapiq
-
Statement:
-
Statement type:
https://in-toto.io/Statement/v1 -
Predicate type:
https://docs.pypi.org/attestations/publish/v1 -
Subject name:
shapiq-1.5.2-cp312-cp312-macosx_12_0_arm64.whl -
Subject digest:
7e276d7be3f711282919d4f82c75b41e3da2de92077f484ff0e724ed006d8782 - Sigstore transparency entry: 1805903250
- Sigstore integration time:
-
Permalink:
mmschlk/shapiq@1b8b64339e9e4238ec79c1cdd349f967b4b0301a -
Branch / Tag:
refs/tags/v1.5.2 - Owner: https://github.com/mmschlk
-
Access:
public
-
Token Issuer:
https://token.actions.githubusercontent.com -
Runner Environment:
github-hosted -
Publication workflow:
python-publish.yml@1b8b64339e9e4238ec79c1cdd349f967b4b0301a -
Trigger Event:
release
-
Statement type:
File details
Details for the file shapiq-1.5.2-cp312-cp312-macosx_10_13_x86_64.whl.
File metadata
- Download URL: shapiq-1.5.2-cp312-cp312-macosx_10_13_x86_64.whl
- Upload date:
- Size: 16.0 MB
- Tags: CPython 3.12, macOS 10.13+ x86-64
- Uploaded using Trusted Publishing? Yes
- Uploaded via: twine/6.1.0 CPython/3.13.13
File hashes
| Algorithm | Hash digest | |
|---|---|---|
| SHA256 |
cbedc5aec6bfde90a4580282ef59847f0929db20ebe239dce77903cd368dc5f0
|
|
| MD5 |
1195d03b816eca07c63263a840bdb4fb
|
|
| BLAKE2b-256 |
d3e910d65b75afd596e4a6061a9529276388add3612191aff6bc0c8faa233bbe
|
Provenance
The following attestation bundles were made for shapiq-1.5.2-cp312-cp312-macosx_10_13_x86_64.whl:
Publisher:
python-publish.yml on mmschlk/shapiq
-
Statement:
-
Statement type:
https://in-toto.io/Statement/v1 -
Predicate type:
https://docs.pypi.org/attestations/publish/v1 -
Subject name:
shapiq-1.5.2-cp312-cp312-macosx_10_13_x86_64.whl -
Subject digest:
cbedc5aec6bfde90a4580282ef59847f0929db20ebe239dce77903cd368dc5f0 - Sigstore transparency entry: 1805903194
- Sigstore integration time:
-
Permalink:
mmschlk/shapiq@1b8b64339e9e4238ec79c1cdd349f967b4b0301a -
Branch / Tag:
refs/tags/v1.5.2 - Owner: https://github.com/mmschlk
-
Access:
public
-
Token Issuer:
https://token.actions.githubusercontent.com -
Runner Environment:
github-hosted -
Publication workflow:
python-publish.yml@1b8b64339e9e4238ec79c1cdd349f967b4b0301a -
Trigger Event:
release
-
Statement type:


