
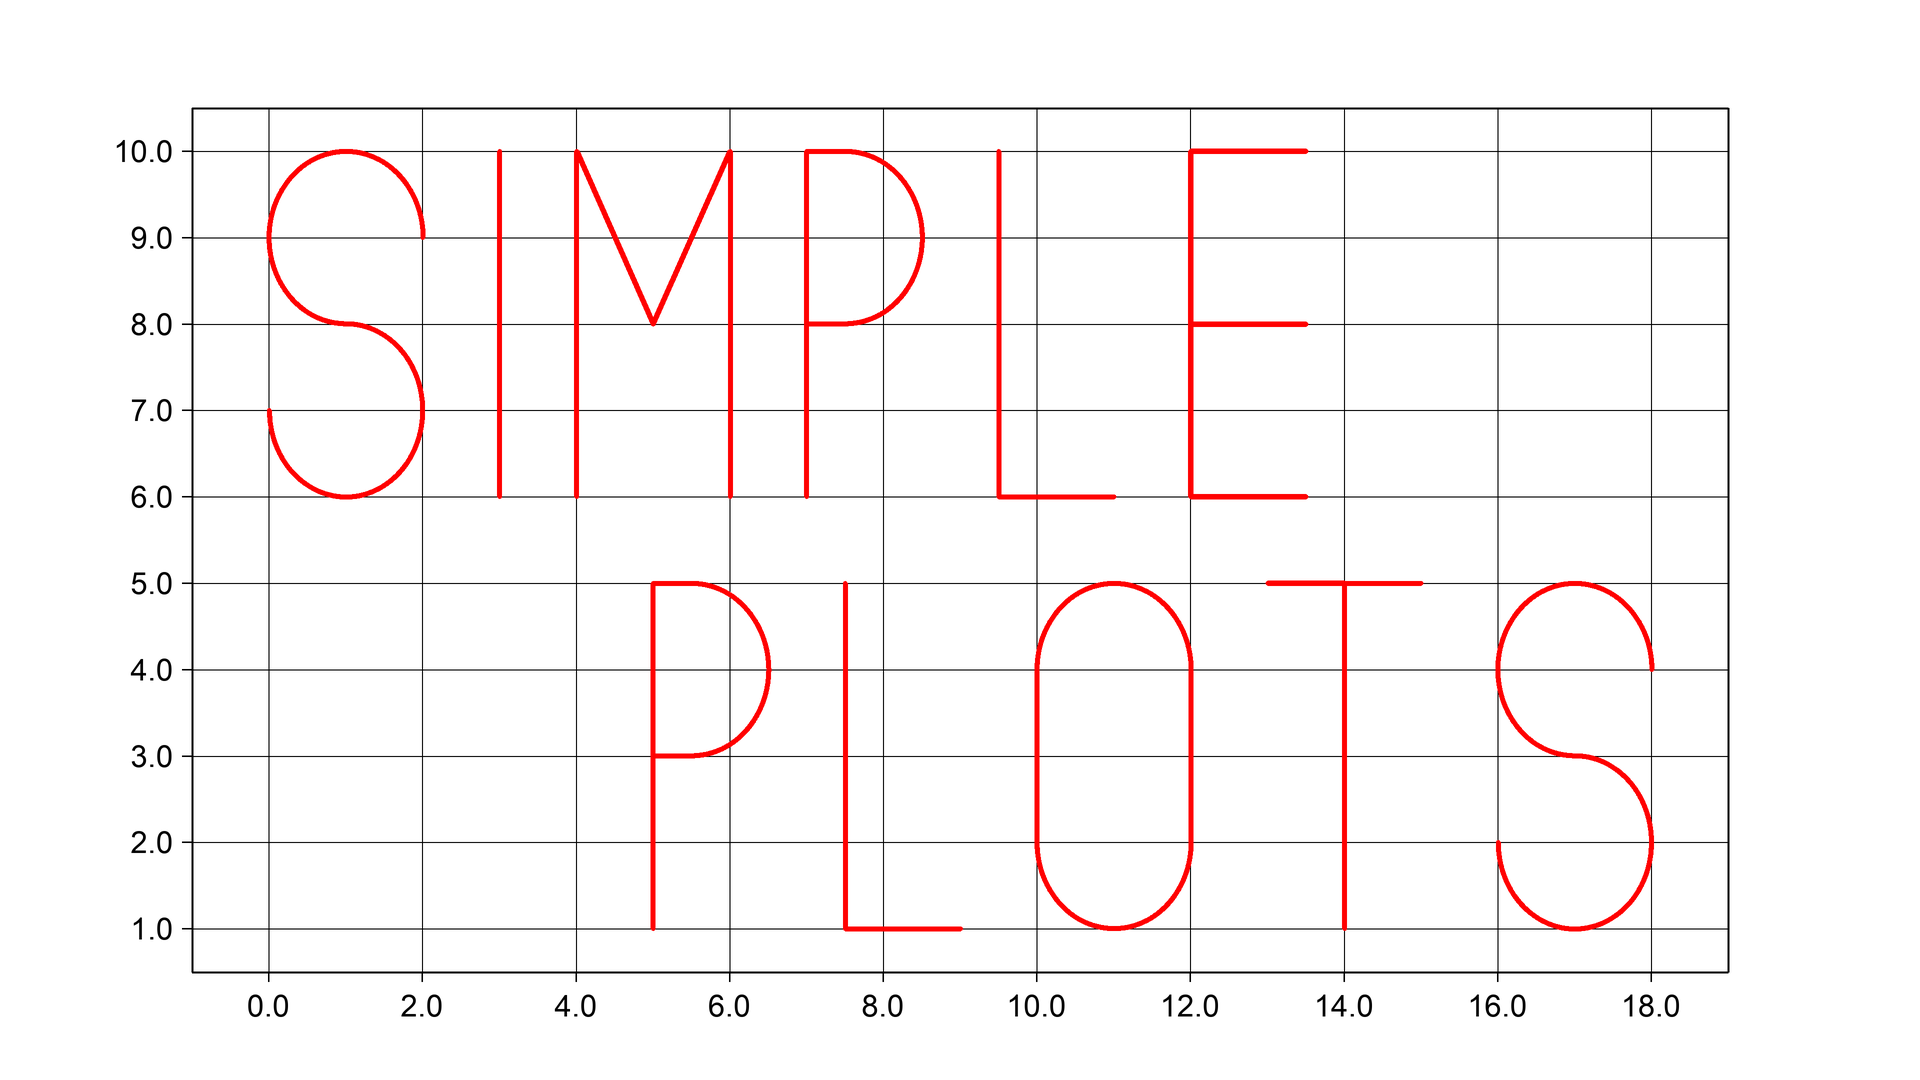
Pure Python, lightweight, Pillow-based plotting tool, focused on efficiency and prevention of memory losses. The project is, obviously, not trying to compete with matplotlib in data analysis, but aims to satisfy a specific purpose of being able to create and save a large number of figures in the most efficient, yet accurate way.



Installation
You can simply install the library from PyPi using pip.
pip install simpleplots
Quick Snippet
An example of the basic usage. Method .save automatically closes the figure by default.
from simpleplots import Figure

fig = Figure()
fig.plot([2, 3, 4], [4, 2, 3], color='red')
fig.save('graph.png')
Performance
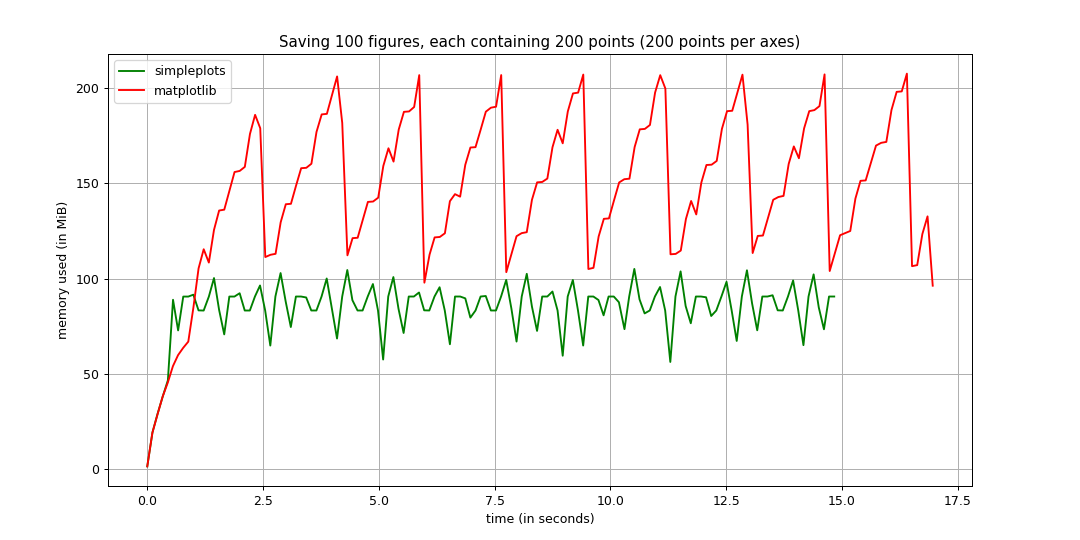
The data has been collected using memory_profiler module. You can find more tests here.
Usage Samples
The library also supports plotting multiple axes within one figure.
from simpleplots import Figure

# Create a figure
fig = Figure()

# Plot data
fig.plot([2, 3, 4], [1, 4.3, 6], color='red', linewidth=7)
fig.plot([1, 3.5, 7], [2, 3, 5], color='blue', linewidth=10)

# Save the image (automatically closes the figure)
fig.save('graph.png')
Plotting dates:
from simpleplots import Figure
from datetime import datetime
import numpy as np

# Create the data to be plotted
start, end = np.datetime64('2022-01-01'), np.datetime64('2022-01-20')
times = np.arange(start, end, np.timedelta64(1, 'D'))
values = np.random.randn(len(times))

# Create a figure
fig = Figure()

# Plot data
fig.plot(times, values, color='red', linewidth=7)

# Save the image (automatically closes the figure)
fig.save('graph.png')
Editing locators and formatters:
from simpleplots import Figure
from simpleplots.dates import DateFormatter, HourLocator
from datetime import datetime
import numpy as np

# Create the data to be plotted
start, end = np.datetime64('2022-01-01 01'), np.datetime64('2022-01-01 23')
times = np.arange(start, end, np.timedelta64(1, 'h'))
values = np.random.randn(len(times))

# Create a figure
fig = Figure()

# Create and assign locator
locator = HourLocator()
fig.set_major_locator(locator, axis='x')

# Create and assign formatter
formatter = DateFormatter('%H:%M', rotation=45)
fig.set_major_formatter(formatter, axis='x')

# Plot data
fig.plot(times, values, color='red', linewidth=7)

# Save the image (automatically closes the figure)
fig.save('graph.png')
Show legend and add title:
from simpleplots import Figure

# Create a figure
fig = Figure()

# Plot data
fig.plot([2, 3, 4], [1, 4.3, 6], color='red', label='line1')
fig.plot([1, 3.5, 7], [2, 3, 5], color='blue', label='line2')

# Show legend
fig.title('Some data')
fig.legend()

# Save the image (automatically closes the figure)
fig.save('graph.png')
Additional
- simpleplots is a demand-driven library. In case you want to use simpleplots, but can't find a locator, formatter or functionality you need - leave a message by creating an issue.
1 maintainer

Metadata
1 maintainer
Release files for simpleplots 0.7.2
For a detailed explanation of source distributions (sdists) and built distributions (wheels), please see the package formats documentation.
Source distribution (sdist)
| File | Size | Uploaded | |
|---|---|---|---|
| simpleplots-0.7.2.tar.gz | 219.7 kB | Details |
Built distribution (wheel)
| File | Interpreter | ABI | Platform | Reset |
|---|---|---|---|---|
| simpleplots-0.7.2-py3-none-any.whl | Python 3 | none | any | Details |
Total release size: 437.8 kB
Release files / simpleplots-0.7.2.tar.gz
| Download URL | simpleplots-0.7.2.tar.gz |
|---|---|
| Size | 219.7 kB |
| Tags | Source |
|
SHA-256 checksum How to use checksums |
7e869501f7bfa27e55c14ff38c6da963beec4c32b2b0a64ec7ad2f3e2a51f0f9
|
|
BLAKE2b-256 checksum How to use checksums |
2cb742d7c994436ab3f4470c515ee0756c8d90e0ed8e6464b5bc09d3a93f4551
|
| Upload date | |
|
Uploaded using Trusted Publishing? What is trusted publishing? |
No |
| Uploaded via |
twine/4.0.0 CPython/3.10.4
|
Release files / simpleplots-0.7.2-py3-none-any.whl
| Download URL | simpleplots-0.7.2-py3-none-any.whl |
|---|---|
| Size | 218.1 kB |
| Tags | Python 3 |
|
SHA-256 checksum How to use checksums |
5339c4d6ab2556fff1fd279aa6e9e2a51a52daa0ce570d7d0a6e4fe4dcfb96d1
|
|
BLAKE2b-256 checksum How to use checksums |
9198ac624f3c83d1059f2095a2518ab541b3e140dc84a14ca9ad6af2031e8295
|
| Upload date | |
|
Uploaded using Trusted Publishing? What is trusted publishing? |
No |
| Uploaded via |
twine/4.0.0 CPython/3.10.4
|














