Package to animate your data

Project description

sjvisualizer 📊
sjvisualizer is a data visualization and animation library for Python for time-series data.
Like this project? Please consider starring ⭐ the project on GitHub!
Or buying me a coffee. It will make my day! Buy me a Coffee
Installation
sjvisualizer is now available on pypi! Simply use pip to install it:
pip install sjvisualizer
Basic examples
Using sjvisualizer, you can create a basic data animation with one simple line of code.
Bar Race
https://github.com/SjoerdTilmans/sjvisualizer/assets/37220662/9340572c-56f8-4abd-97c5-e8ed674a6751
from sjvisualizer import plot as plt

plt.bar(excel="data/DesktopOS.xlsx",
        title="Desktop Operating System Market Share",
        unit="%")
Pie Race
https://github.com/SjoerdTilmans/sjvisualizer/assets/37220662/5db0d056-578e-4070-b1ba-713e590acd3d
from sjvisualizer import plot as plt

plt.pie(excel="data/browsers.xlsx",
        title="Desktop Browser Market Share",
        unit="%")
Animated Line Chart
https://github.com/SjoerdTilmans/sjvisualizer/assets/37220662/deae9c3c-8a90-4e64-a036-39fd636746a7
from sjvisualizer import plot as plt

colors = {
    "United States": [
        23,
        60,
        154
    ],
	"Russia": [
        255,
        50,
        50
    ]
}

plt.line(excel="data/military budget.xlsx",
        title="Military Budget of Selected Countries",
        sub_title="in millions of US$",
        colors=colors)
Animated Area Chart
https://github.com/SjoerdTilmans/sjvisualizer/assets/37220662/6304bb63-1076-4da8-b044-595f763d3546
from sjvisualizer import plot as plt

colors = {
    "United States": [
        23,
        60,
        154
    ],
	"Russia": [
        255,
        50,
        50
    ]
}

plt.stacked_area(excel="data/Nuclear.xlsx",
        title="Nuclear Warheads by Country",
        colors=colors)
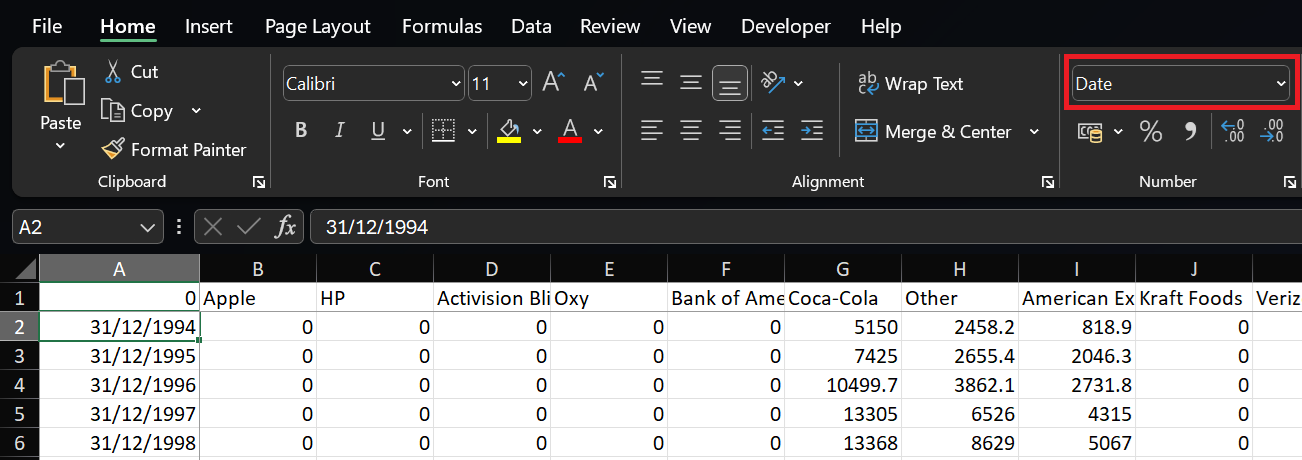
Data format
Currently sjvisualizer reads data from an Excel file. The format should be as shown in the picture below:
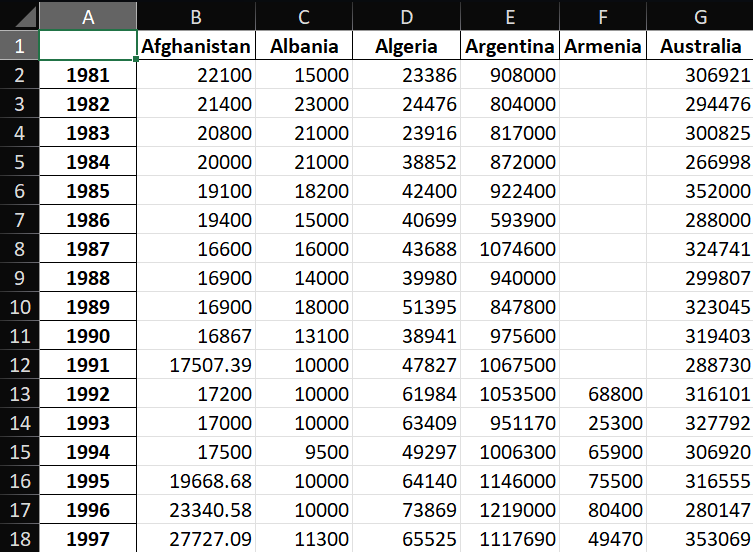
In this file the first column should contain the dates, and each subsequent column holds the data for the data categories, in this example the different countries.
The date can either be shown as just the year, or as a full date as shown below. In this case, please make sure that Excel recognises the cell as a date.
More advanced animations
Using sjvisualizer, you can also mix and match chart types and positions like in the following example:
https://github.com/SjoerdTilmans/sjvisualizer/assets/37220662/420ed4a0-5bfb-436a-8f61-4e77c640f78f
Learn sjvisualizer
Want to learn more about sjvisualizer:
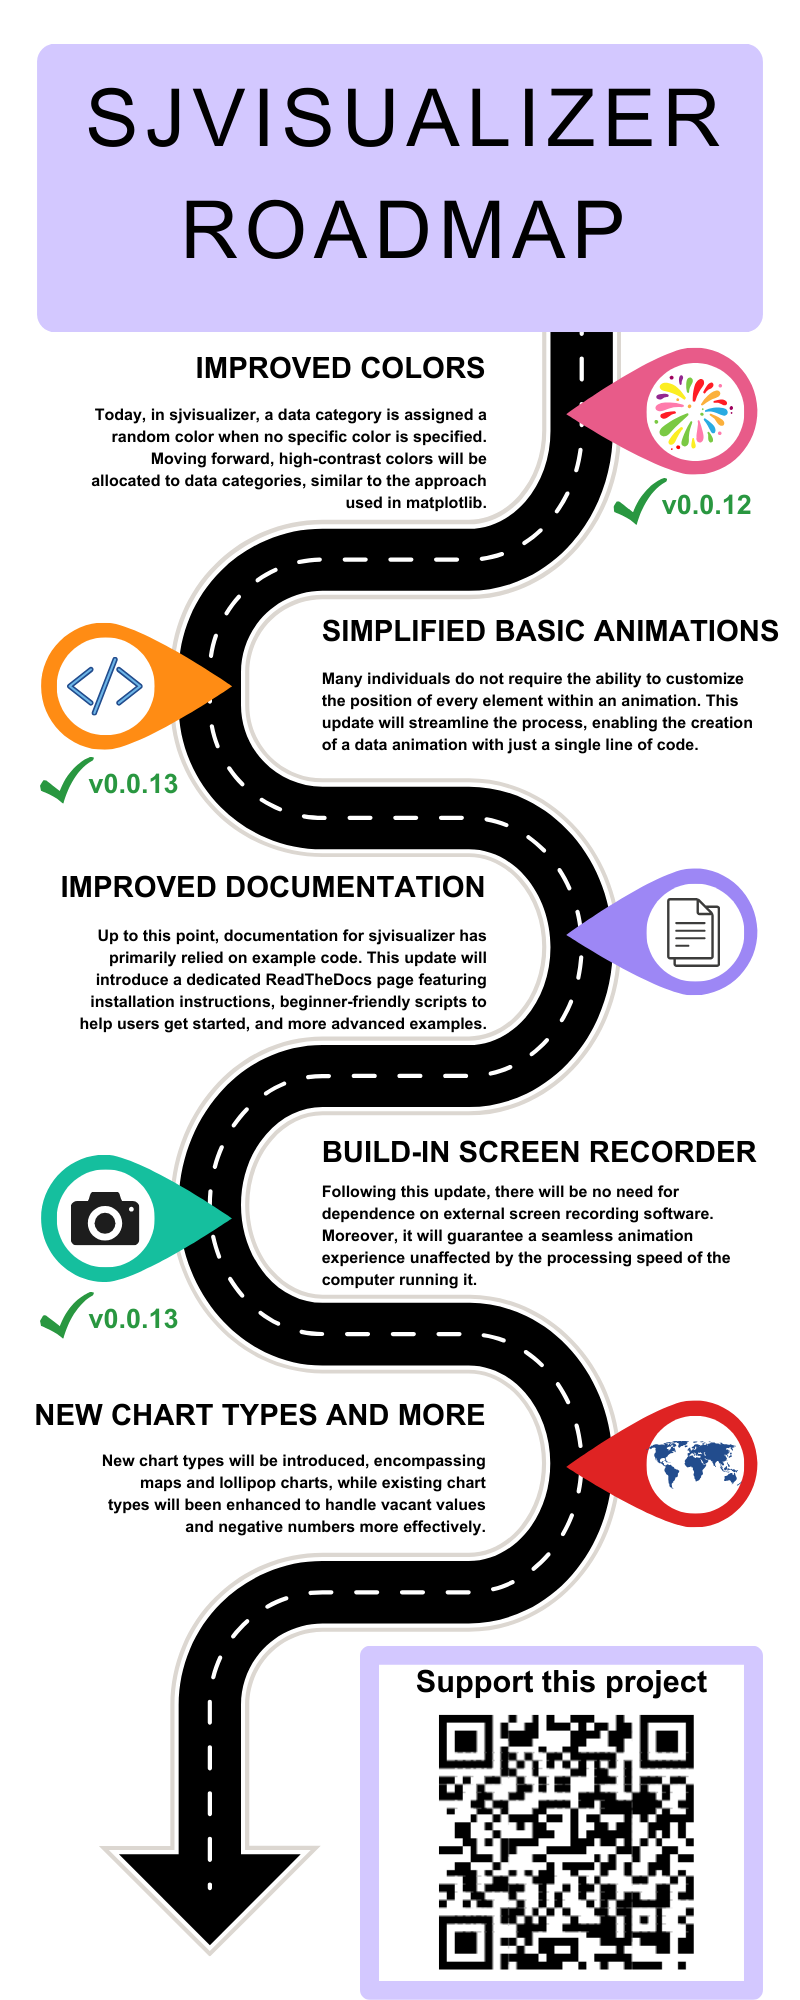
Roadmap
Usage
sjvisualizer is a free and open-source data animation library, please include the following attribution in any publications you use it in.
Made with sjvisualizer, the open-source data animation library for Python
Support this project
If you like this project, please concider supporting me using PayPal Buy me a Coffee.
SJVisualizer Supporters
Do you like what we are doing and want to support this project, get in touch at info@sjdataviz.com
Contributing
Contributions are always welcome! A couple of ideas to contribute:
- Improve documentation of this project. I have been thinking of setting up a readthedocs page.
- Add additional example scripts. If you do so, please includy any data files and image files so that the example is fully running
- Add new chart types. I have uploaded an example skeleton of new chart types in Empty.py, this is a setup that should serve as a good starting point. (https://github.com/SjoerdTilmans/sjvisualizer/blob/main/sjvisualizer/Empty.py)
Before making any changes, please create your own development branch here on GitHub. Once ready submit a pull request and set me as reviewer!
License
sjvisualizer is released under the MIT License. See the LICENSE file for more details.
Contact
If you have any questions or suggestions regarding sjvisualizer, post it on my forum.
Release history Release notifications | RSS feed


Download files
Download the file for your platform. If you're not sure which to choose, learn more about installing packages.
Source Distributions
Built Distribution
Filter files by name, interpreter, ABI, and platform.
If you're not sure about the file name format, learn more about wheel file names.
Copy a direct link to the current filters
File details
Details for the file sjvisualizer-0.0.15-py2.py3-none-any.whl.
File metadata
- Download URL: sjvisualizer-0.0.15-py2.py3-none-any.whl
- Upload date:
- Size: 486.9 kB
- Tags: Python 2, Python 3
- Uploaded using Trusted Publishing? No
- Uploaded via: twine/4.0.2 CPython/3.11.3
File hashes
| Algorithm | Hash digest | |
|---|---|---|
| SHA256 |
28eae04f5fa77f9a8c41c55ba017284dc757420e63691c8225cebb3a0cca7f5d
|
|
| MD5 |
19175cb481ac8a897c27dfa0c6888424
|
|
| BLAKE2b-256 |
f15ea6f033420f018e20f92ebe140686bda9711826ff32cd529792a91ecddf23
|


