GUI program for the manipulation and analysis of astronomical spectra in the optical and NIR wavelength ranges.

Project description
SPAN: Spectral Analysis Software
📖 Author: Daniele Gasparri
📅 Latest Release: July 2025


Overview
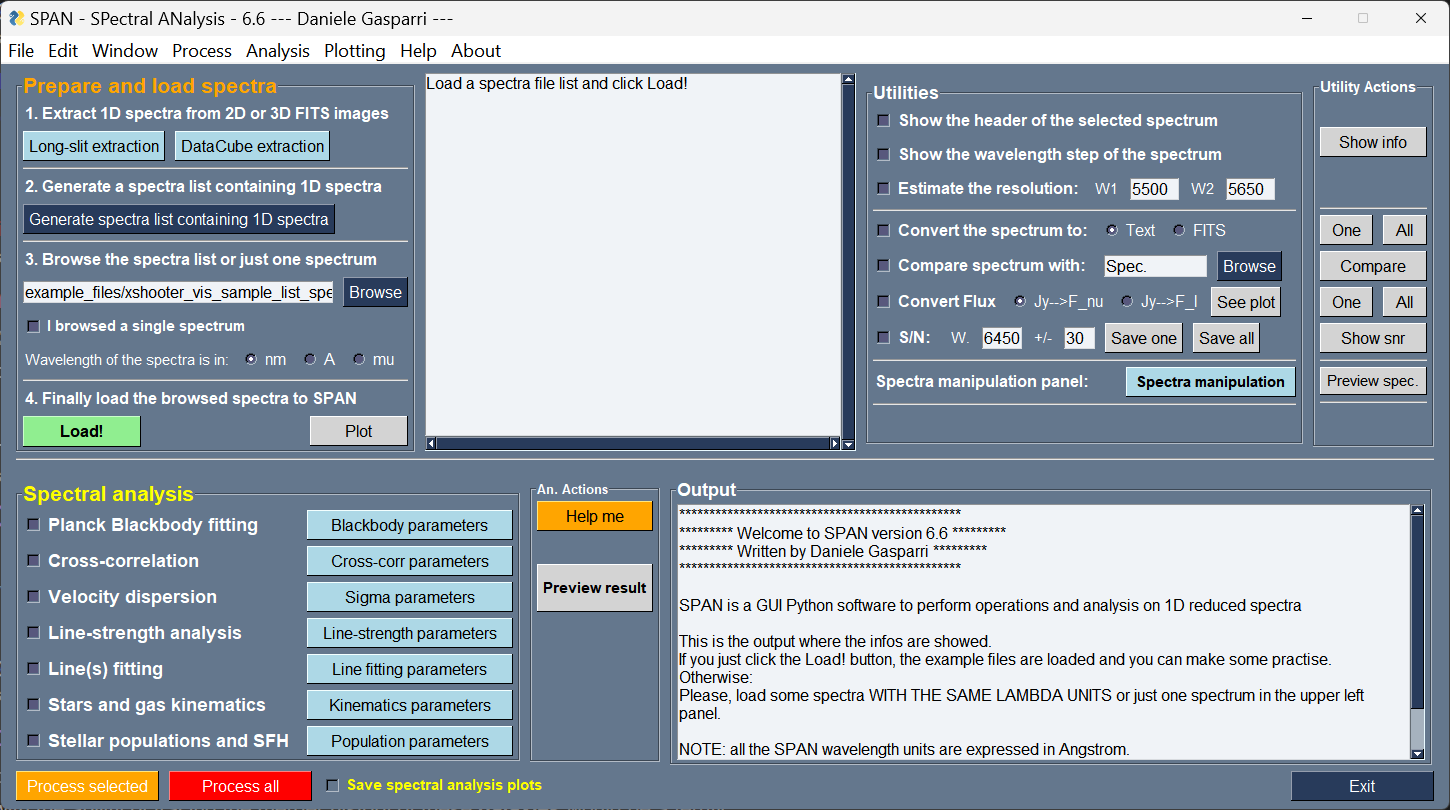
SPAN is the first cross-platform graphical user interface (GUI) program designed to extract, manipulate and analyze professional astronomical science spectra. It is optimized for the study of galaxy spectra from the near UV to near-infrared (NIR) atmospheric windows.
SPAN has been developed to provide users with a simple and clear GUI that integrates the most commonly used tools for manipulation and analysis of stellar and galaxy spectra. The goal of SPAN is to make spectral manipulation and analysis faster, and simpler in one GUI program, fully cross-platform and user friendly.
Features
- Fully interactive GUI: No command line required to perform high-level scientific analysis and spectra manipulation
- Compatibility: Automatically recognizes a wide range of FITS and ASCII spectral formats
- Spectra extraction: From reduced long-slit FITS and datacubes FITS, SPAN allows to extract 1D spectra with automatic (e.g. Voronoi) and manual binning options. Native supports for MUSE, CALIFA, WEAVE LIFU, and JWST IFU datacubes is offered. Users can also write and implement their custom routines to support more instruments
- Spectral manipulation: More than 20 tasks to manipulate the spectra (e.g cropping, Doppler/z corretion, rebinning, smoothing, continuum modelling...)
- Spectral analysis: Using built-in routines and relying on state-of-the-art full spectral fitting code (pPXF), SPAN can perform all the powerful spectral analysis tasks of modern astronomy: kinematics, stellar populations studies, line-strength, cross-correlation, line fitting...
- Batch processing support for multiple spectra. Optimized to work with a large amount of 1D spectra (e.g. extracted from data cubes)
- Plotting: Generates high quality publication grade plots
- Customizable: Many parameters can be set to use SPAN for a wide range of science cases
- Fully cross-platform: SPAN is optimized and can run on any device and any operating system, including Android (using for example the Pydroid3 app)
System Requirements
- Python 3.10+
- Screen resolution of at least 1600x900 px (for optimal GUI display)
- The following dependencies will be automatically installed: numpy, scipy, astropy, matplotlib, pandas, scikit-learn, scikit-image, PyWavelets, joblib, ppxf, vorbin
Installation
You can install SPAN using pip:
pip3 install span-gui
Tested Compatibility
SPAN has been tested with the following spectra:
- IRAF generated 1D spectra
- SDSS spectra
- IRTF (also extended version) spectra
- SAURON spectra
- X-Shooter library spectra
- JWST spectra
- MUSE, CALIFA, WEAVE LIFU, and JWST NIRSpec IFU data cubes
- (E)MILES, GALAXEV, FSPS SSP templates
- ESO reduced spectra products for optical and NIR spectra
Generally speaking, the compatible spectra formats are:
- Wavelength units must be in Angstrom, nanometers or micrometers, either linear, log or log10
- 1D fits table with wavelength information stored in the "CRVAL1" and "CDELT1" keywords
- 2D fits table with wavelength and flux values stored in the primary HDU
- Plain text ASCII files (.txt or .dat) with wavelengths in the first column and flux in the second column
Working with Spectra Lists
SPAN has been optimized to work with a series of n 1D spectra. The spectra are passed to SPAN by creating and loading a spectra list. The spectra list is an ASCII file containing the path of your spectra and can be created with SPAN, using the button Generate a spectra list containing 1D spectra. Just select the folder where your spectra are located, confirm the selection, set the wavelength units of your spectra (assuming are the same for all) and then click the Load! button.
A spectra list can be created also manually and should include:
- absolute paths of spectra, or relative path if your spectra are located in a subfolder of SPAN
- A commented first line (e.g. # Spectrum)
- It can be stored anywhere in your device
Example file lists are provided in example_files/ folder.
Quick Start
Run SPAN using:
span-gui
Once launched, select the folder to store the results in your device, then click "Load!" in the main GUI to load the example spectra in the listbox and start playing with the GUI.
Basic Usage example
- In the "Prepare and load spectra" frame, browse one of the spectra lists contained in the example_files/ folder (e.g. ngc5806_bins.dat). Set the "Wavelength of the spectra is in:" to "A", then click "Load!"
- Visualize Data: Select a spectrum in the list and click "Plot". A Matplotlib window will appear showing the spectrum. Take a look at it, then close the Matplotlib window and return to the main GUI panel
- Modify Spectra: Open the "Spectra manipulation" panel located in the Utility frame and activate a task, for example the "Add noise". Confirm the selection (button "Confirm") with the default noise value, then in the main GUI click "Preview Spec." to see the processed selected spectrum. If you are satisfied and want to save this noisy spectrum, click to "Process Selected". To apply the task for all the spectra, click "Process all"
- The "Spectra manipulation" button in the main GUI now has an annoying red color, meaning that at least one task is activated. Why this is so important? Because if you want to perform any of the Spectral Analysis tasks you should remember that the activated tasks in the "Spectra manipulation" panel are modifying your original spectra and this modified version is passed to the "Spectral analysis" frame. So, open the "Spectra manipulation" frame, deselect the "Add noise" task and confirm this choice
- In the main panel, activate the "Line-strength analysis" task and open the parameter window by pressing the button "Line-strength parameters". There, make sure the "Lick/IDS indices" option is selected (it is by default). Enter the redshift of the galaxy (0.00449) and confirm the parameters. Now, select the "line28.fits" spectrum in the listbox and preview the results of the analysis by pressing the "Preview result" button. The available Lick/IDS indices will be shown in the Matplotlib window and a second plot will appear showing the position of the galaxy in the index-index grid built from the SSP models of Thomas et al., 2011. In the output window you will see also the luminosity-weighted age, metallicity and alpha-enhancment calculated for this spectrum. If this is cool, apply the task to all the spectra by pressing the "Process all" button. If you also want the plots of the preview mode to be saved, activate the "Save spectral analysis plots" checkbox at the bottom of the GUI. SPAN now will work for you. Grab a coffee and wait for the task to terminate. The results will be stored in ASCII files in the "SPAN_results/line-strength_analysis/" folder. The plots will be saved as PNG images in the "SPAN_results/plots/" folder.
Troubleshooting & FAQ
-
I cannot load any spectra because SPAN always complains. What's wrong?
Well, this is a quite general question. Here I give you some advices:
a) If you want to load just one spectrum, load it directly without generating a spectra list, but activate the "I browsed a single spectrum" option before pressing the "Load!" button
b) If you have a spectra list file which has not been generated by SPAN, check its format. Remember that the first line should contain a comment (#comment), then you need to list the absolute path and the full name of your spectra, unless they are stored in a subfolder of SPAN: in this case also the relative path is good
c) Check the architecture of your spectra. Due to the fact that astronomers rarely agrees with each others, there are plenty of spectra formats out there. SPAN tries to consider all, but it may fail. Try with different spectra to see if the problem persists. -
Why do I see a weird wavelength scale in my loaded spectra? SPAN will always show the wavelength scale of the plots in Angstrom (A). If the "Plot" button will show you a strange wavelength range of your spectra, you likely selected a wrong wavelength unit scale. In order to be as general as possible and account to the many creative ways that astronomers have to define the wavelength units and keywords in the spectra, SPAN does't even try to guess it. You should set manually in the "Wavelength of the spectra is in:" option in the "Prepare and load spectra" frame. Of course, all the spectra in your list should share a common wavelength units (but they can be both logarithmically and linearly binned). If the problem persists, it is possible that your spectra have "fancier" wavelength units and cannot be properly read by the program. The available wavelength units handled by SPAN are Angstrom (A), nanometers (nm) and micrometers (mu). If your spectra use different wavelength units, SPAN cannot read them.
-
How do I load just one spectrum? If you want to work with just one spectrum, you DO NOT need a spectra list. SImply browse your spectrum and activate the checkbox "I browsed a single spectrum". Set the correct wavelength units and click "Load!".
-
How do I handle a lot of spectra stored in different folders and within a lot of non spectra files? There is a simple answer for that. The "Generate spectra list containing 1D spectra" will scan the selected folder and all the relative sub-folders looking for fits, .txt and .dat files. You just need to put all your spectra in this root folder, which can contain as many subfolders as you want. Then, once you load this spectra list, SPAN will recognize automatically which file is a spectrum and which not and will delete from the listbox all non valid spectra. Anyway, I advice you to create working folder or subfolders as clean as possible from non spectra files.
-
How do I reset the parameters and the tasks if I played for so long that the entropy of SPAN now tends to infinite? Don't panic! Click "Edit → Clear All Tasks" to deactivate all the tasks, or a more aggressive "File → Restore Default Parameters" to restore the default parameters.
-
Can I save and reload my custom parameters? Yes! Use "File → Save Parameters..." and "File → Load Parameters...".
-
Where do my processed spectra and analysis results are saved? Outputs are stored in the:
SPAN_results/
folder, whose location is determined by you the first time you open SPAN. You can, of course, change the location of the SPAN_results folder whenever you want, by "Edit → Change result folder...". If you don't remember the location of the folder, try "Edit → Show result folder".
License
SPAN-GUI is licensed under the non-commercial License. See the LICENSE file for details.
Contact & Contributions
Found a bug? Want to suggest a feature?
Drop me an email!
Contact: Daniele Gasparri – daniele.gasparri@gmail.com
Take a look also at my website, if you are interested in astronomy: https://www.danielegasparri.com/
Release history Release notifications | RSS feed


Download files
Download the file for your platform. If you're not sure which to choose, learn more about installing packages.
Source Distribution
Built Distribution
Filter files by name, interpreter, ABI, and platform.
If you're not sure about the file name format, learn more about wheel file names.
Copy a direct link to the current filters
File details
Details for the file span_gui-6.6.13.tar.gz.
File metadata
- Download URL: span_gui-6.6.13.tar.gz
- Upload date:
- Size: 27.5 MB
- Tags: Source
- Uploaded using Trusted Publishing? No
- Uploaded via: twine/6.1.0 CPython/3.10.11
File hashes
| Algorithm | Hash digest | |
|---|---|---|
| SHA256 |
6f2d40e25b8f4abe8b9f7bc4480fd3419ed0c2bc008c97ac713ccfc4fba6c323
|
|
| MD5 |
473efaadb6f33ffc1c1f526a387d9d89
|
|
| BLAKE2b-256 |
74303b2af0abd1ffe116cef0e7fd445bc87ccf3afba4bd848e3a7749fbe2e37d
|
File details
Details for the file span_gui-6.6.13-py3-none-any.whl.
File metadata
- Download URL: span_gui-6.6.13-py3-none-any.whl
- Upload date:
- Size: 27.9 MB
- Tags: Python 3
- Uploaded using Trusted Publishing? No
- Uploaded via: twine/6.1.0 CPython/3.10.11
File hashes
| Algorithm | Hash digest | |
|---|---|---|
| SHA256 |
9ed40344af9761dc28d676ad6691183d8022c532e11affff2ab10c921aeceb38
|
|
| MD5 |
d73da53a2a1f7c1f1d9000acb62aa48f
|
|
| BLAKE2b-256 |
57fbb9f34fd8b29f3de3aa760d49cdb1bd04e8a033b505d89f67a2e3e9a27dcd
|


