Visualize data from speedtest_sampler in a web app

Project description
Visualize data generated by speedtest-cli in a web app powered by Plotly


Screenshot
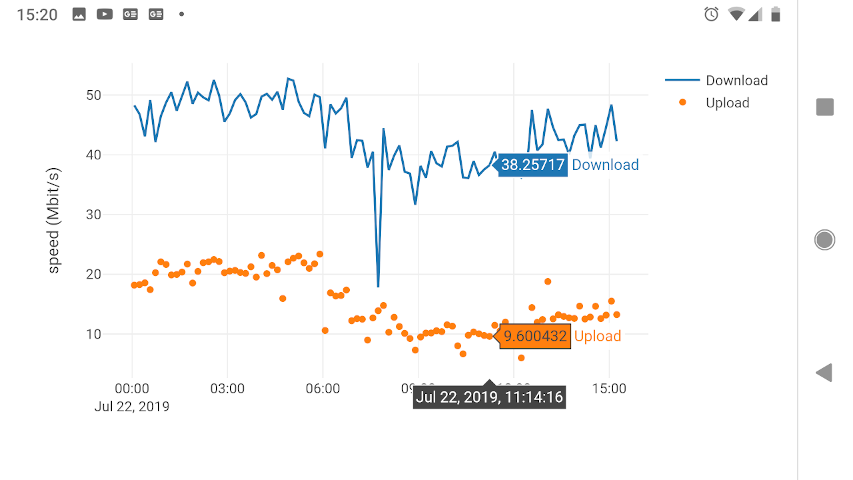
Description
Web app for visualizing internet uplink speeds. Environments supported so far:
Docker container
GNU/Linux hosts with Python >= 3.6 installed
(Other POSIX systems and Windows need testing.)
Recent changes
Added line plot with selectable window size
Added 3D graph for download speed densities
Install and run
dockerhub
Get up and running instantly, with a speedtest.csv file in your home dir and logs written to stdout.
# Please adapt details (container timezone, sitename) to your needs.

docker run -ti -p 80:5000 -v ~:/root -e FLASK_DEBUG=1 -e "TZ=EST" \
   -e "INFILE=/root/speedtest.csv" -e "SITENAME=my provider" \
   shuntingyard/speedtest_http
pip / easy_install
pip install speedtest_http
or
easy_install speedtest_http
Github
pip install git+https://github.com/shuntingyard/speedtest_http.git
or
git clone https://github.com/shuntingyard/speedtest_http.git
cd speedtest_http
python setup.py install
run in shell environments
# Please adapt env variables, host, port according to your needs.

INFILE=~/data/speedtest.csv \
LOGDIR=/tmp \
SITENAME="my provider" \
FLASK_APP=speedtest_http \
FLASK_DEBUG=0 \
python -m flask run -h 0.0.0.0 -p 8080
Changelog
Version 0.0.6
Line plot with selectable window size
Version 0.0.5
3D graph for download speed densities
Version 0.0.4
Using new speedtest_reader API
Version 0.0.3
All graphs migrated from Dash to Plotly


Download files
Download the file for your platform. If you're not sure which to choose, learn more about installing packages.
Source Distribution
File details
Details for the file speedtest_http-0.0.6.tar.gz.
File metadata
- Download URL: speedtest_http-0.0.6.tar.gz
- Upload date:
- Size: 148.7 kB
- Tags: Source
- Uploaded using Trusted Publishing? No
- Uploaded via: twine/1.13.0 pkginfo/1.5.0.1 requests/2.22.0 setuptools/40.8.0 requests-toolbelt/0.9.1 tqdm/4.32.2 CPython/3.7.3
File hashes
| Algorithm | Hash digest | |
|---|---|---|
| SHA256 |
837f2ca3f580758413ad7fa18c67864592ddc8f499a3272247f80d520351bddd
|
|
| MD5 |
26b09d7c80eca3d1f1305575adfc9d54
|
|
| BLAKE2b-256 |
e4b312ffc259606f89233a7a9b3b68d3f30c57e716677bef50e54aaa0bcc5c85
|


