
SPONGE-web API
pip install spongeWebPy
from spongeWebPy import *
Purpose

With SPONGE being an outstanding approach regarding calculation speed and accuracy, the goal, making the data available in an easy way for as many researchers as possible, is the next logical step. Furthermore, the data should become visualized in an interactive network, for uncomplicated research within a small part of interest of the networks. Available ceRNA interaction networks are based on paired gene and miRNA expression data taken from "The Cancer Genome Atlas" (TCGA).
Introduction
MicroRNAs (miRNAs) are important non-coding, post-transcriptional regulators that are involved in many biological processes and human diseases. miRNAs regulate their target mRNAs, so called competing endogenous RNAs (ceRNAs), by either degrading them or by preventing their translation. ceRNAs share similar miRNA recognition elements (MREs), sequences with a specific pattern where the belonging miRNA binds to.
miRNAs act as rheostats that regulate gene expression and maintain the functional balance of various gene networks. Furthermore, the miRNA-ceRNA-interactions follow a many-to-many relationship where one miRNA can affect multiple ceRNA targets and one ceRNA can contain multiple MREs for various miRNAs, leading to complex cross-talk. Since failures in these systems may lead to cancer, it is crucial to determine the networks of interactions and to assess their structure.
SPONGE is a method for the fast construction of a ceRNA network using ’multiple sensitivity correlation’. SPONGE was applied to paired miRNA and gene expression data from “The Cancer Genome Atlas” (TCGA) for studying global effects of miRNA-mediated cross-talk. The outcome highlights already established and novel protein-coding and non-coding ceRNAs which could serve as biomarkers in cancer. Further information about the SPONGE R package are available under https://bioconductor.org/packages/release/bioc/html/SPONGE.html.
With SPONGE being an outstanding approach regarding calculation speed and accuracy, the goal was to make its results easily accessible to researchers studying ceRNAs in cancer for further analysis. Therefore, an application programming interface (API) was developed, enabling other developers to query a database consisting of the SPONGE results on the TCGA dataset for their ceRNAs, miRNAs or cancer-types of interest. Containing a large amount of statistically related ceRNAs and their associated miRNAs from over 20 cancer types, the database allows to detect the importance of a single gene on a large scale, thus assessing its relevancy in a cancer background.
Additionally, an interactive web interface was set up to provide the possibility to browse and to search the database via a graphical user interface. The website also facilitates processing the data returned from the database and visualizing the ceRNA interactions as a network. The website is available under https://exbio.wzw.tum.de/sponge/home. By help of these tools, third party developers like data scientists and biomedical researchers become able to carry out in depth cancer analyses and detect correlations between different cancer-causing factors on a new level while benefiting from an easy to use interface, which may lead to an uncomplicated and better understanding of cancer.
A complete definition of all API endpoints can be found under https://exbio.wzw.tum.de/sponge-api/ui.
General Workflow
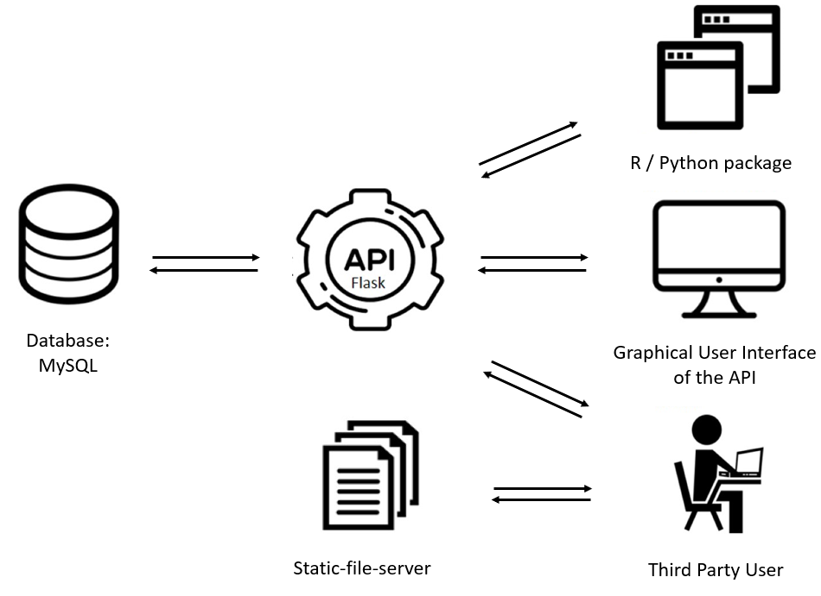
We have built a web-resource to query SPONGE results easily. via an API which requests data from the database. The API can be accessed through an graphical user interface of the API (Flask). If the data needs to be loaded inside a programming environment a R package and a python package is available for easy implementation. For visualisation of the data and for medical researches we provide a web application where graphs, networks and data are shown. The general build of the project is shown below.
How to start requests?
To start with further analysis with SPONGE data, it is important to get an overview about the available disease_types and the number of ceRNA interactions. This can be retrieved with:
get_overallCounts()
To get just an overview about the available datasets without any numbers use:
get_datasetInformation()
To retrieve all used parameters of the SPONGE method to re-create published results for the cancer type of interest, use the following function:
get_runInformation(disease_name = "kidney clear cell carcinoma")
Another way to get an overview of the results is to search for a specific gene and get an idea in which ceRNA interaction network the gene of interest contributes most to.
get_geneCount(gene_symbol = ["HOXA1"])
How to find a sub network?
To find a sub network of nodes of interest use the functions: Get all ceRNA interactions by given identifications (ensg_number, gene_symbol or gene_type), specific cancer type or different filter possibilities according different statistical values (e.g. FDR adjusted p-value).
# Retrieve all possible ceRNAs for a specific gene identified by ensg_number for a specific disease
# and threshold for pValue
get_all_ceRNAInteractions(disease_name = "pancancer",
                          ensg_number=["ENSG00000259090","ENSG00000217289"],
                          pValue=0.5, pValueDirection="<",
                          limit=15)
Get all ceRNAs in a disease of interest (search not for a specific ceRNA, but search for all ceRNAs satisfying filter functions).
get_ceRNA(disease_name = "kidney clear cell carcinoma",
          gene_type = "lincRNA", minBetweenness = 0.8)
Get all interactions between the given identifiers (ensg_number or gene_symbol).
get_specific_ceRNAInteractions(disease_name = "pancancer",
                                gene_symbol = ["PTENP1","VCAN","FN1"])
How to find sponged miRNA?
Find sponged miRNAs (the reason for a edge between two ceRNAs) with
get_sponged_miRNA(disease_name="kidney", gene_symbol = ["TCF7L1", "SEMA4B"], between=True)
or find a miRNA induced ceRNA interaction with
# Retrieve all possible ceRNA interactions where miRNA(s) of interest contribute to
get_specific_miRNAInteraction(disease_name = "kidney clear cell carcinoma",
                              mimat_number = ["MIMAT0000076", "MIMAT0000261"],
                              limit = 15)
Further Information and Analysis
The database also contains information about the raw expression values and survival analyis data, which can be used for Kaplan-Meyer-Plots (KMPs) for example. These information can be adressed with package functions. To retrieve expression data use
# Retrieve gene expression values for specific genes by ensg_numbers
get_geneExprValues(disease_name = "kidney clear cell carcinoma",
                   ensg_number = ["ENSG00000259090","ENSG00000217289"])
# Retrieve gene expression values for specific miRNAs by mimat_numbers
get_mirnaExprValues(disease_name = "kidney clear cell carcinoma",
                    mimat_number = ["MIMAT0000076", "MIMAT0000261"])
To get survival analysis data use the function
get_survAna_rates(disease_name="kidney clear cell carcinoma",
                 ensg_number=["ENSG00000259090", "ENSG00000217289"],
                 sample_ID = ["TCGA-BP-4968","TCGA-B8-A54F"])
It returns a data_frame with gene and patient/sample information and the "group information" encoded by column "overexpressed". Information about expression value of the gene (FALSE = underexpression, gene expression <= mean gene expression over all samples, TRUE = overexpression, gene expression >= mean gene expression over all samples)
For further patient/sample information:
get_survAna_sampleInformation(disease_name = "kidney clear cell carcinoma",
                              sample_ID = ["TCGA-BP-4968","TCGA-B8-A54F"])
Further analysis and more complex information like associated cancer hallmarks, GO terms or wikipathway keys about the genes contributing to a network can be received by using this three functions:
get_geneOntology(gene_symbol=["PTEN","TIGAR"])
get_hallmark(gene_symbol=["PTEN"])
get_wiki
Citation
If you use any results from spongeWeb, please cite as follow:
Hoffmann M., Pachl E., Hartung M., Stiegler V., Baumbach J., Schulz M., List M., SPONGE-web: A pan-cancer resource for competing endogenous RNA interactions (manuscript in preparation)
1 maintainer

Release files for spongeWebPy 1.1.5
For a detailed explanation of source distributions (sdists) and built distributions (wheels), please see the package formats documentation.
Source distribution (sdist)
| File | Size | Uploaded | |
|---|---|---|---|
| spongeWebPy-1.1.5.tar.gz | 14.3 kB | Details |
Built distribution (wheel)
| File | Interpreter | ABI | Platform | Reset |
|---|---|---|---|---|
| spongeWebPy-1.1.5-py3-none-any.whl | Python 3 | none | any | Details |
Total release size: 36.4 kB
Release files / spongeWebPy-1.1.5.tar.gz
| Download URL | spongeWebPy-1.1.5.tar.gz |
|---|---|
| Size | 14.3 kB |
| Tags | Source |
|
SHA-256 checksum How to use checksums |
57560b21dc6047bd393fc8f04b0ce3203d48e93295e6b27594e34eb448e2b573
|
|
BLAKE2b-256 checksum How to use checksums |
dca6f5859a9b93b0780322203009657d716368a78fdd8147bfd17289e05910ef
|
| Upload date | |
|
Uploaded using Trusted Publishing? What is trusted publishing? |
No |
| Uploaded via |
twine/3.1.1 pkginfo/1.5.0.1 requests/2.23.0 setuptools/46.0.0 requests-toolbelt/0.9.1 tqdm/4.42.0 CPython/3.7.1
|
Release files / spongeWebPy-1.1.5-py3-none-any.whl
| Download URL | spongeWebPy-1.1.5-py3-none-any.whl |
|---|---|
| Size | 22.1 kB |
| Tags | Python 3 |
|
SHA-256 checksum How to use checksums |
1b8d4c1bfc55d22b5734793d2ab90f50a0bfbe69897895727cc75a3a9f56a223
|
|
BLAKE2b-256 checksum How to use checksums |
314bc246383917bf39d2de3932a43021fc943bdbb8f2c709f1222192cb4d119b
|
| Upload date | |
|
Uploaded using Trusted Publishing? What is trusted publishing? |
No |
| Uploaded via |
twine/3.1.1 pkginfo/1.5.0.1 requests/2.23.0 setuptools/46.0.0 requests-toolbelt/0.9.1 tqdm/4.42.0 CPython/3.7.1
|














