A powerful SQL shell with GUI interface for data analysis

Project description
SQLShell
A powerful SQL shell with GUI interface for data analysis
🚀 Key Features
- Interactive SQL Interface - Rich syntax highlighting for enhanced query writing
- Context-Aware Suggestions - Intelligent SQL autocompletion based on query context and schema
- DuckDB Integration - Powerful analytical queries powered by DuckDB
- Multi-Format Support - Import and query Excel (.xlsx, .xls), CSV, and Parquet files effortlessly
- Modern UI - Clean, tabular results display with intuitive controls
- Table Preview - Quick view of imported data tables
- Test Data Generation - Built-in sample data for testing and learning
- Multiple Views - Support for multiple concurrent table views
- Productivity Tools - Streamlined workflow with F5/F9 shortcuts and Ctrl+Enter for query execution
- Explain Column - Analyze relationships between data columns directly from query results
⚡ F5/F9 Quick Execution
SQLShell includes powerful keyboard shortcuts for efficient SQL execution:
- F5: Execute all SQL statements in the editor sequentially
- F9: Execute only the current SQL statement (where your cursor is positioned)
This allows for rapid testing and development - place your cursor in any statement and press F9 to execute just that query, or press F5 to run everything.
📦 Installation
Using pip (Recommended)
pip install sqlshell
Linux Setup with Virtual Environment
# Create and activate virtual environment
python3 -m venv ~/.venv/sqlshell
source ~/.venv/sqlshell/bin/activate

# Install SQLShell
pip install sqlshell

# Configure shell alias
echo 'alias sqls="~/.venv/sqlshell/bin/sqls"' >> ~/.bashrc  # or ~/.zshrc for Zsh
source ~/.bashrc  # or source ~/.zshrc
Development Installation
git clone https://github.com/oyvinrog/SQLShell.git
cd SQLShell
pip install -e .
🎯 Getting Started
-
Launch the Application
sqls
If the
sqlscommand doesn't work (e.g., "access denied" on Windows), you can use this alternative:python -c "import sqlshell; sqlshell.start()"
-
Database Connection
- SQLShell automatically connects to a local DuckDB database named 'pool.db'
-
Working with Data Files
- Click "Load Files" to select your Excel, CSV, or Parquet files
- File contents are loaded as queryable SQL tables
- Query using standard SQL syntax
-
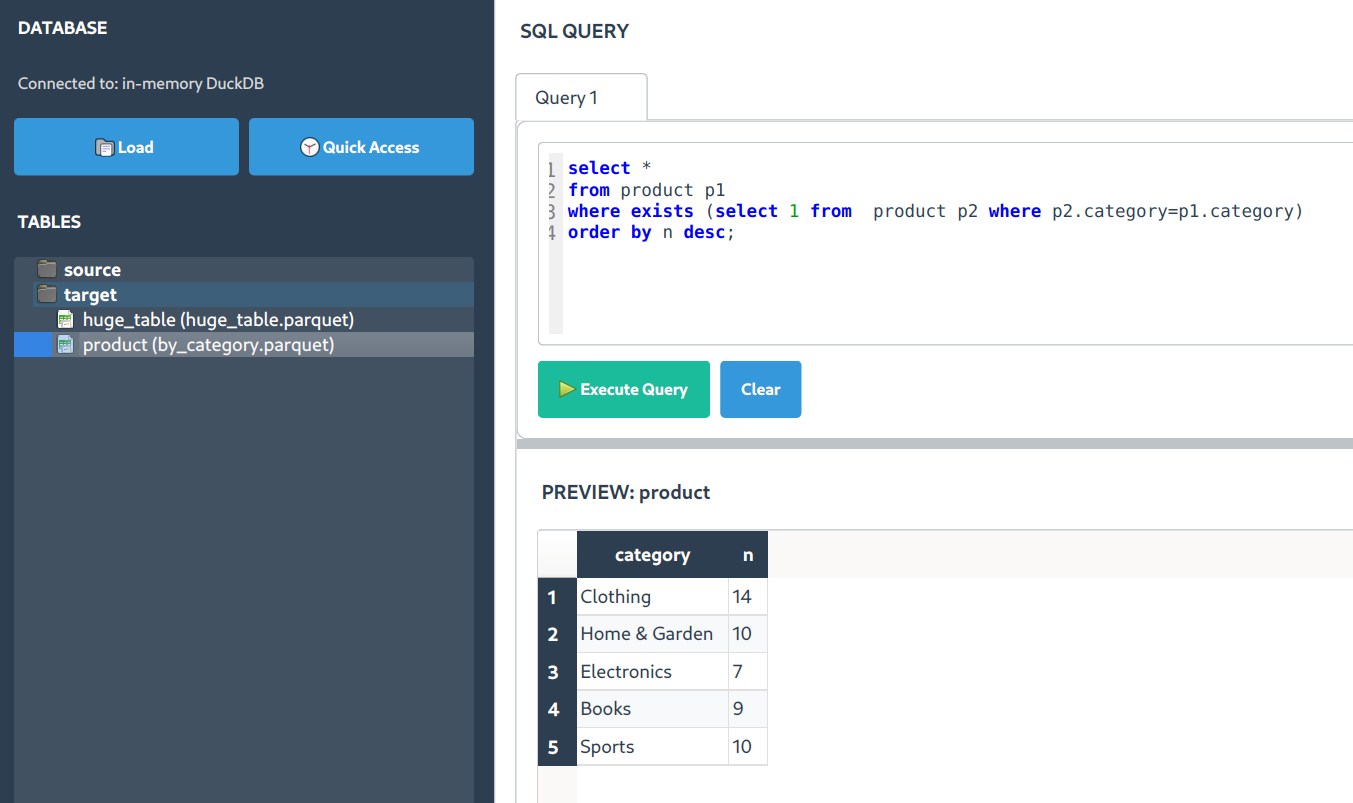
Query Execution
- Enter SQL in the editor
- Execute using Ctrl+Enter or the "Execute" button
- View results in the structured output panel
-
Test Data
- Load sample test data using the "Test" button for quick experimentation
-
Using Context-Aware Suggestions
- Press Ctrl+Space to manually trigger suggestions
- Suggestions appear automatically as you type
- Context-specific suggestions based on your query position:
- After SELECT: columns and functions
- After FROM/JOIN: tables with join conditions
- After WHERE: columns with appropriate operators
- Inside functions: relevant column suggestions
-
Column Analysis
- Right-click on column headers in the results pane
- Access features like sorting, filtering, and the "Explain Column" analysis tool
📝 Query Examples
Basic Join Operation
SELECT *
FROM sample_sales_data cd
INNER JOIN product_catalog pc ON pc.productid = cd.productid
LIMIT 3;
Multi-Statement Queries
-- Create a temporary view
CREATE OR REPLACE TEMPORARY VIEW test_v AS
SELECT *
FROM sample_sales_data cd
INNER JOIN product_catalog pc ON pc.productid = cd.productid;

-- Query the view
SELECT DISTINCT productid
FROM test_v;
💡 Pro Tips
- Use temporary views for complex query organization
- Leverage keyboard shortcuts for efficient workflow
- Explore the multi-format support for various data sources
- Create multiple tabs for parallel query development
- The context-aware suggestions learn from your query patterns
- Type
table_name.to see all columns for a specific table - After JOIN keyword, the system suggests relevant tables and join conditions
📊 Table Profiling
SQLShell provides powerful table profiling tools to help you understand your data. These tools are accessible from the left-hand side table menu via right-click on any table:
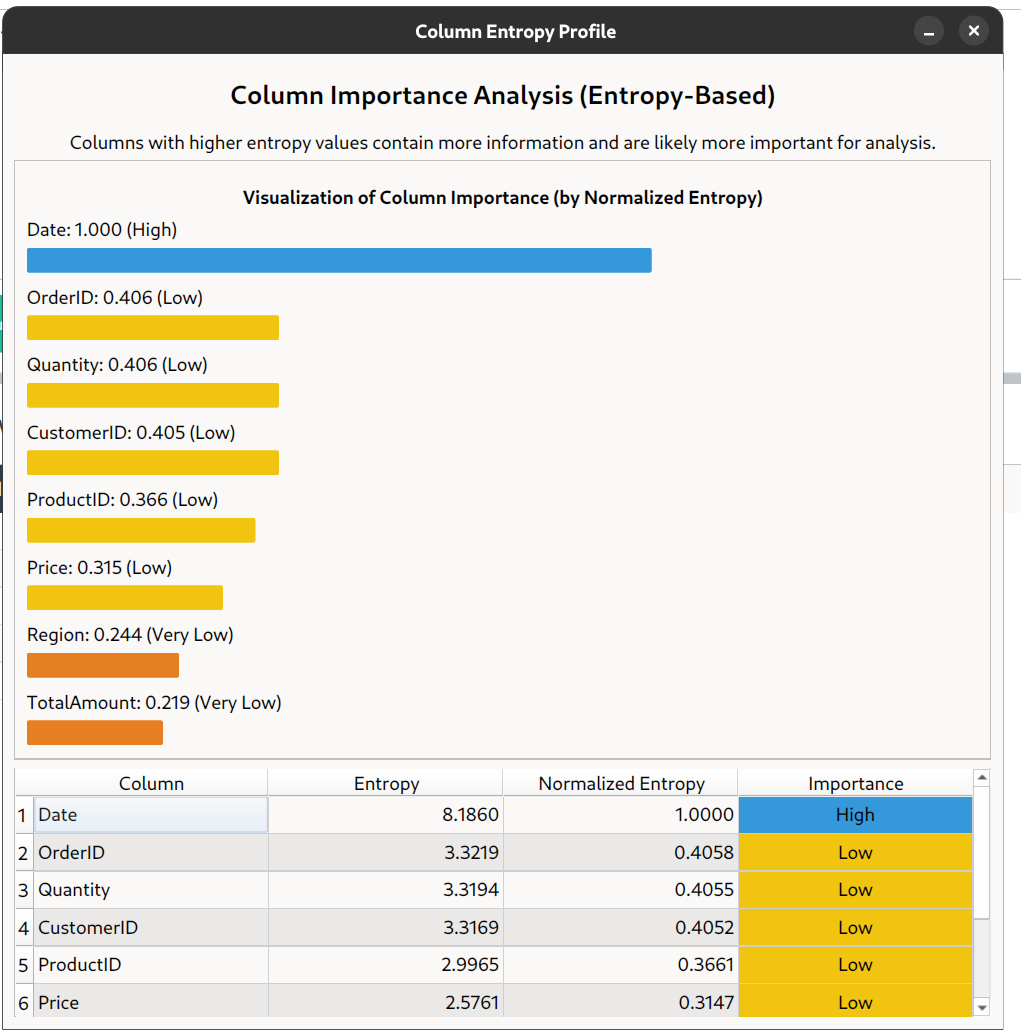
Table Profiling Options
Right-click on any table in the left panel to access these profiling tools:
-
Analyze Column Importance
- Calculates entropy for each column to identify the most information-rich fields
- Visualizes column importance with color-coded bars
- Helps identify which columns are most useful for analysis and modeling
-
Profile Table Structure
- Identifies candidate keys and functional dependencies
- Discovers potential primary keys and relationships between columns
- Suggests possible normalized table structures
- Helps understand table organization and optimize schema design
-
Analyze Column Distributions
- Generates histograms, box plots, and other statistical visualizations
- Identifies the distribution pattern of each column (normal, uniform, etc.)
- Provides detailed statistics like min, max, mean, median, skewness
- Helps identify outliers and understand data patterns
-
Analyze Foreign Keys (multi-table selection)
- Select multiple tables by holding Ctrl or Shift while clicking
- Right-click to access "Analyze Foreign Keys Between X Tables"
- Automatically discovers potential foreign key relationships between tables
- Identifies matching columns that could serve as join conditions
- Helps understand cross-table relationships in your data model
Using the Profilers
-
Access the Profilers
- Right-click on any table in the schema browser
- Select the desired profiling option from the context menu
- For foreign key analysis, select multiple tables first
-
Interpret the Results
- Each profiler provides interactive visualizations
- Hover over charts for detailed information
- Switch between different views using the tabs
- Sort and filter results to focus on specific columns
-
Benefits
- Quickly understand data composition without writing queries
- Identify data quality issues and outliers
- Discover relationships between columns
- Make informed decisions about query optimization
The table profiling tools are invaluable for exploratory data analysis, helping you gain insights before writing complex queries.
📊 Column Analysis
SQLShell provides powerful tools to analyze individual columns directly from your query results:
Explain Column Feature
The "Explain Column" feature helps you understand the relationships between columns in your query results:
-
How to Access:
- Right-click on any column header in the query results table
- Select "Explain Column" from the context menu
-
What It Does:
- Analyzes the selected column's relationship with other columns in the result set
- Identifies correlations and dependencies between columns
- Provides visualizations to help understand the column's importance and distribution
-
Benefits:
- Quickly identify which columns are most related to your target column
- Discover hidden patterns and relationships in your data
- Make data-driven decisions without writing complex analytical queries
Multivariate Analysis Feature
The Column Profiler now offers in-depth multivariate analysis to explore relationships between columns:
-
How to Access:
- In the Column Profiler, double-click on any feature in the importance table
- A detailed visualization window will appear showing the relationship between the selected feature and the target column
-
Smart Visualizations:
- Automatically selects the most appropriate visualization based on data types:
- Numeric vs. Numeric: Scatter plot with regression line
- Categorical vs. Numeric: Bar chart showing average values
- Numeric vs. Categorical: Box plot showing distribution
- Categorical vs. Categorical: Heatmap showing relationship strength
- Automatically selects the most appropriate visualization based on data types:
-
Benefits:
- Gain deeper insights into how features relate to your target variable
- Understand which features have strong predictive relationships
- Identify patterns and outliers in multivariate relationships
- Make better decisions about feature selection for analysis and modeling
This feature is particularly useful for data scientists and analysts who need to understand variable relationships quickly without writing complex correlation queries.
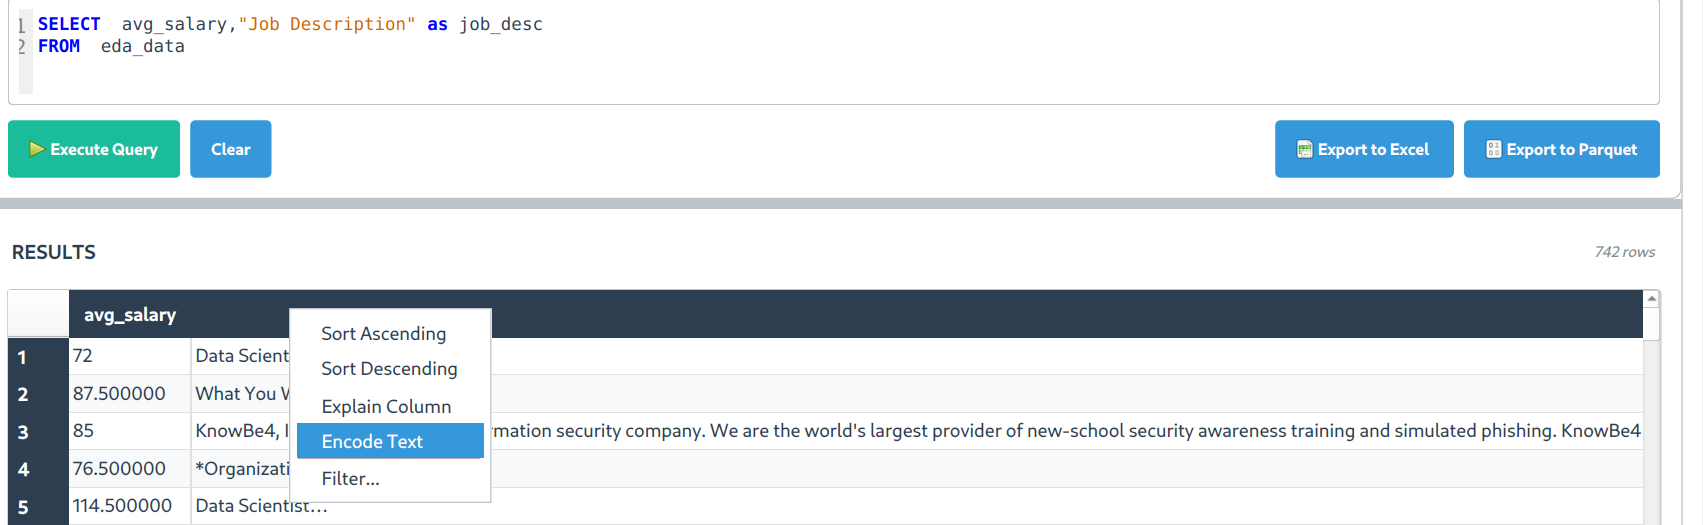
One-hot encoding
If you are working with text (i.e. job description or job title to analyze salary), you would want to do 'one-hot encoding'.
- How to Access:
- Right-click on any column header in the query results table
- Select "Encode text" from the context menu
- How It Works:
- SQLShell tokenizes the text into meaningful words and phrases
- Each unique token becomes a new binary feature (1 if present, 0 if absent)
- The system applies intelligent filtering to remove common words with low information value
- Results appear as a new query with encoded columns automatically added
-
Applications:
- Analyze how specific keywords in job descriptions correlate with salary levels
- Identify which terms in product descriptions drive higher sales
- Extract features from unstructured text for further analysis
- Prepare text data for statistical modeling and machine learning
-
Using the Encoded Data:
- After encoding, SQLShell presents a visualization showing top correlations
- Sort encoded features by correlation strength to identify key terms
- Use encoded columns in subsequent queries for deeper analysis
- Join encoded results with other tables for cross-dataset insights
- Benefits:
- Transform unstructured text into structured, analyzable data
- Discover hidden patterns between text content and numerical outcomes
- Identify specific terms that have the strongest relationship with target variables
- Perform advanced text analysis without specialized NLP knowledge
This feature is particularly powerful for HR analytics, marketing text analysis, and any scenario where you need to extract insights from unstructured text data.
📋 Requirements
- Python 3.8 or higher
- Dependencies (automatically installed):
- PyQt6 ≥ 6.4.0
- DuckDB ≥ 0.9.0
- Pandas ≥ 2.0.0
- NumPy ≥ 1.24.0
- openpyxl ≥ 3.1.0 (Excel support)
- pyarrow ≥ 14.0.1 (Parquet support)
- fastparquet ≥ 2023.10.1 (Alternative parquet engine)
- xlrd ≥ 2.0.1 (Support for older .xls files)
📄 License
This project is licensed under the MIT License - see the LICENSE file for details.
📁 Project Structure
SQLShell/
├── sqlshell/                   # Main package
│   ├── __init__.py
│   ├── main.py                 # Main application entry point
│   ├── execution_handler.py    # F5/F9 SQL execution functionality
│   ├── editor_integration.py   # Editor integration utilities
│   ├── query_tab.py           # Query tab implementation
│   ├── splash_screen.py       # Application splash screen
│   └── styles.py              # UI styling
├── tests/                     # Test files
│   ├── f5_f9_functionality/   # F5/F9 functionality tests and demos
│   │   ├── README.md          # Documentation for F5/F9 tests
│   │   ├── test_execution_handler.py  # Comprehensive test suite
│   │   └── demo_f5_f9.py      # Interactive demo
│   └── test_query_executor.py # Other test files
├── docs/                      # Documentation
│   ├── F5_F9_FUNCTIONALITY.md # Detailed F5/F9 documentation
│   └── IMPLEMENTATION_SUMMARY.md # Implementation details
├── assets/                    # Assets and resources
│   └── images/               # Images and screenshots
│       ├── sqlshell_logo.png
│       ├── sqlshell_demo.png
│       ├── column_profiler.png
│       └── column_encoding.png
├── sample_data/              # Sample data files
│   ├── test_*.csv           # Test CSV files
│   ├── california_housing_data.parquet
│   └── pool.db              # Sample database
├── main.py                  # Application launcher
├── run.py                   # Alternative launcher
├── README.md               # This file
├── requirements.txt        # Python dependencies
├── pyproject.toml         # Project configuration
└── MANIFEST.in            # Package manifest
🧪 Testing
The project includes comprehensive tests for the F5/F9 functionality:
# Run the interactive test suite
cd tests/f5_f9_functionality
python test_execution_handler.py

# Try the interactive demo
python demo_f5_f9.py
For complete documentation on F5/F9 functionality, see docs/F5_F9_FUNCTIONALITY.md.
🤝 Contributing
- Fork the repository
- Create a feature branch
- Make your changes
- Add tests if applicable
- Submit a pull request
📄 License
This project is licensed under the MIT License - see the LICENSE file for details.
Release history Release notifications | RSS feed


Download files
Download the file for your platform. If you're not sure which to choose, learn more about installing packages.
Source Distribution
Built Distribution
Filter files by name, interpreter, ABI, and platform.
If you're not sure about the file name format, learn more about wheel file names.
Copy a direct link to the current filters
File details
Details for the file sqlshell-0.3.2.tar.gz.
File metadata
- Download URL: sqlshell-0.3.2.tar.gz
- Upload date:
- Size: 5.7 MB
- Tags: Source
- Uploaded using Trusted Publishing? No
- Uploaded via: twine/6.1.0 CPython/3.13.3
File hashes
| Algorithm | Hash digest | |
|---|---|---|
| SHA256 |
ed777082fbc94846e72bf543e586566b51c41fbc23761aaa7ce08f1dca5c706c
|
|
| MD5 |
3291f4aa8015e3663a301d2a6b133203
|
|
| BLAKE2b-256 |
cbe4a8d39a5a7ba2d59016ee393df4e3db4dcc9b614326ff2bce2205e937d625
|
File details
Details for the file sqlshell-0.3.2-py3-none-any.whl.
File metadata
- Download URL: sqlshell-0.3.2-py3-none-any.whl
- Upload date:
- Size: 3.4 MB
- Tags: Python 3
- Uploaded using Trusted Publishing? No
- Uploaded via: twine/6.1.0 CPython/3.13.3
File hashes
| Algorithm | Hash digest | |
|---|---|---|
| SHA256 |
debfa9bd184568ee625046980914085a14fa017357451dd869a77701774c7e80
|
|
| MD5 |
71716e943bb2574c2c3352db7f59f596
|
|
| BLAKE2b-256 |
b50a7e1d36cbd2dcd35dfb77a126eef642cbc761ae23a97d886342c0358be801
|


