

Better tracebacks
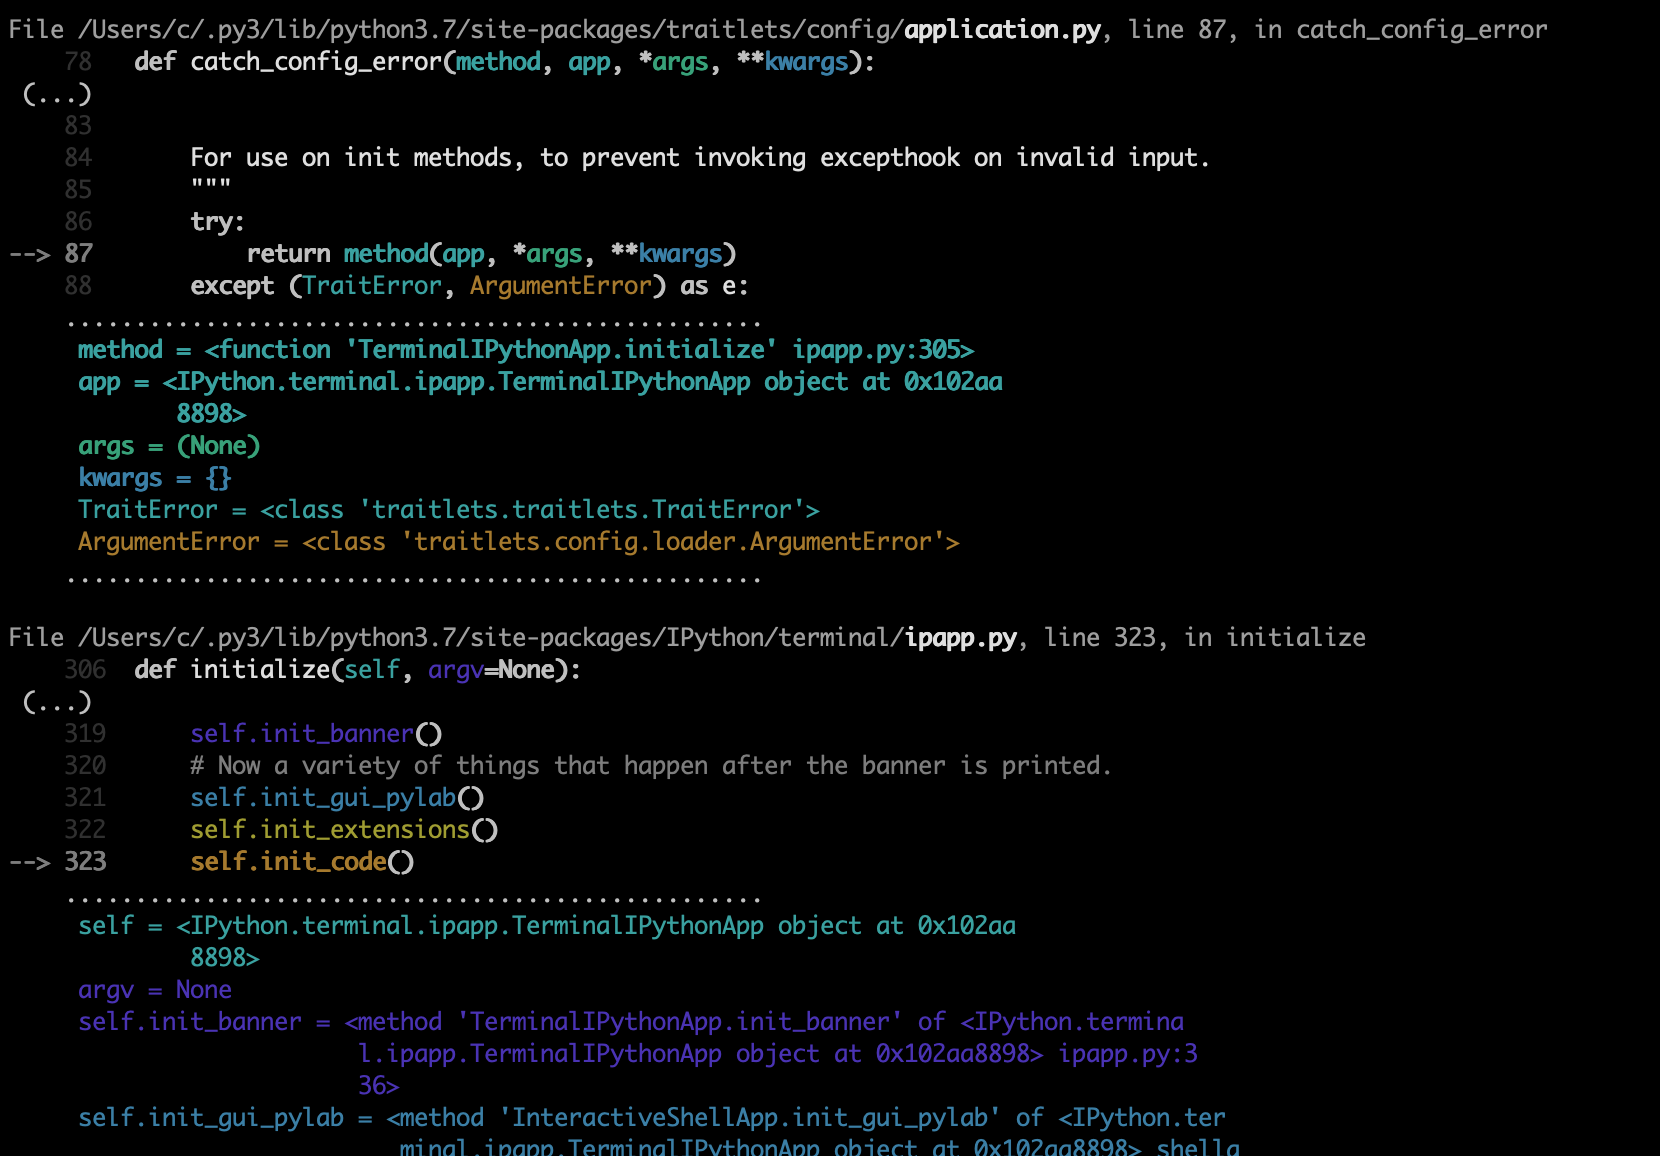
This is a more helpful version of Python's built-in exception message: It shows more code context and the current values of nearby variables. That answers many of the questions I'd ask an interactive debugger: Where in the code was the crash, what's in the relevant variables, and why was that function called with those arguments. It either prints to the console or gives you a string for logging.
pip3 install stackprinter
Before
Traceback (most recent call last):
  File "demo.py", line 12, in <module>
    dangerous_function(somelist + anotherlist)
  File "demo.py", line 6, in dangerous_function
    return sorted(blub, key=lambda xs: sum(xs))
  File "demo.py", line 6, in <lambda>
    return sorted(blub, key=lambda xs: sum(xs))
TypeError: unsupported operand type(s) for +: 'int' and 'str'
After
File demo.py, line 12, in <module>
    9        somelist = [[1,2], [3,4]]
    10       anotherlist = [['5', 6]]
    11       spam = numpy.zeros((3,3))
--> 12       dangerous_function(somelist + anotherlist)
    13   except:
    ..................................................
     somelist = [[1, 2, ], [3, 4, ], ]
     anotherlist = [['5', 6, ], ]
     spam = 3x3 array([[0. 0. 0.]
                       [0. 0. 0.]
                       [0. 0. 0.]])
    ..................................................

File demo.py, line 6, in dangerous_function
    5    def dangerous_function(blub):
--> 6        return sorted(blub, key=lambda xs: sum(xs))
    ..................................................
     blub = [[1, 2, ], [3, 4, ], ['5', 6, ], ]
    ..................................................

File demo.py, line 6, in <lambda>
    3
    4
    5    def dangerous_function(blub):
--> 6        return sorted(blub, key=lambda xs: sum(xs))
    7
    ..................................................
     xs = ['5', 6, ]
    ..................................................

TypeError: unsupported operand type(s) for +: 'int' and 'str'
I rarely use this locally instead of a real debugger, but it helps me sleep when my code runs somewhere where the only debug tool is a log file (though it's not a fully-grown error monitoring system).
By default, it tries to be somewhat polite about screen space, showing only a few source lines & the function header, and only the variables that appear in those lines, and using only (?) 500 characters per variable. You can configure exactly how verbose things should be.
It outputs plain text normally, which is good for log files. There's also a color mode for some reason 🌈, with a few different color schemes for light and dark backgrounds. (The colors track different variables instead of the language syntax.)
Usage
Option 1: Set and forget
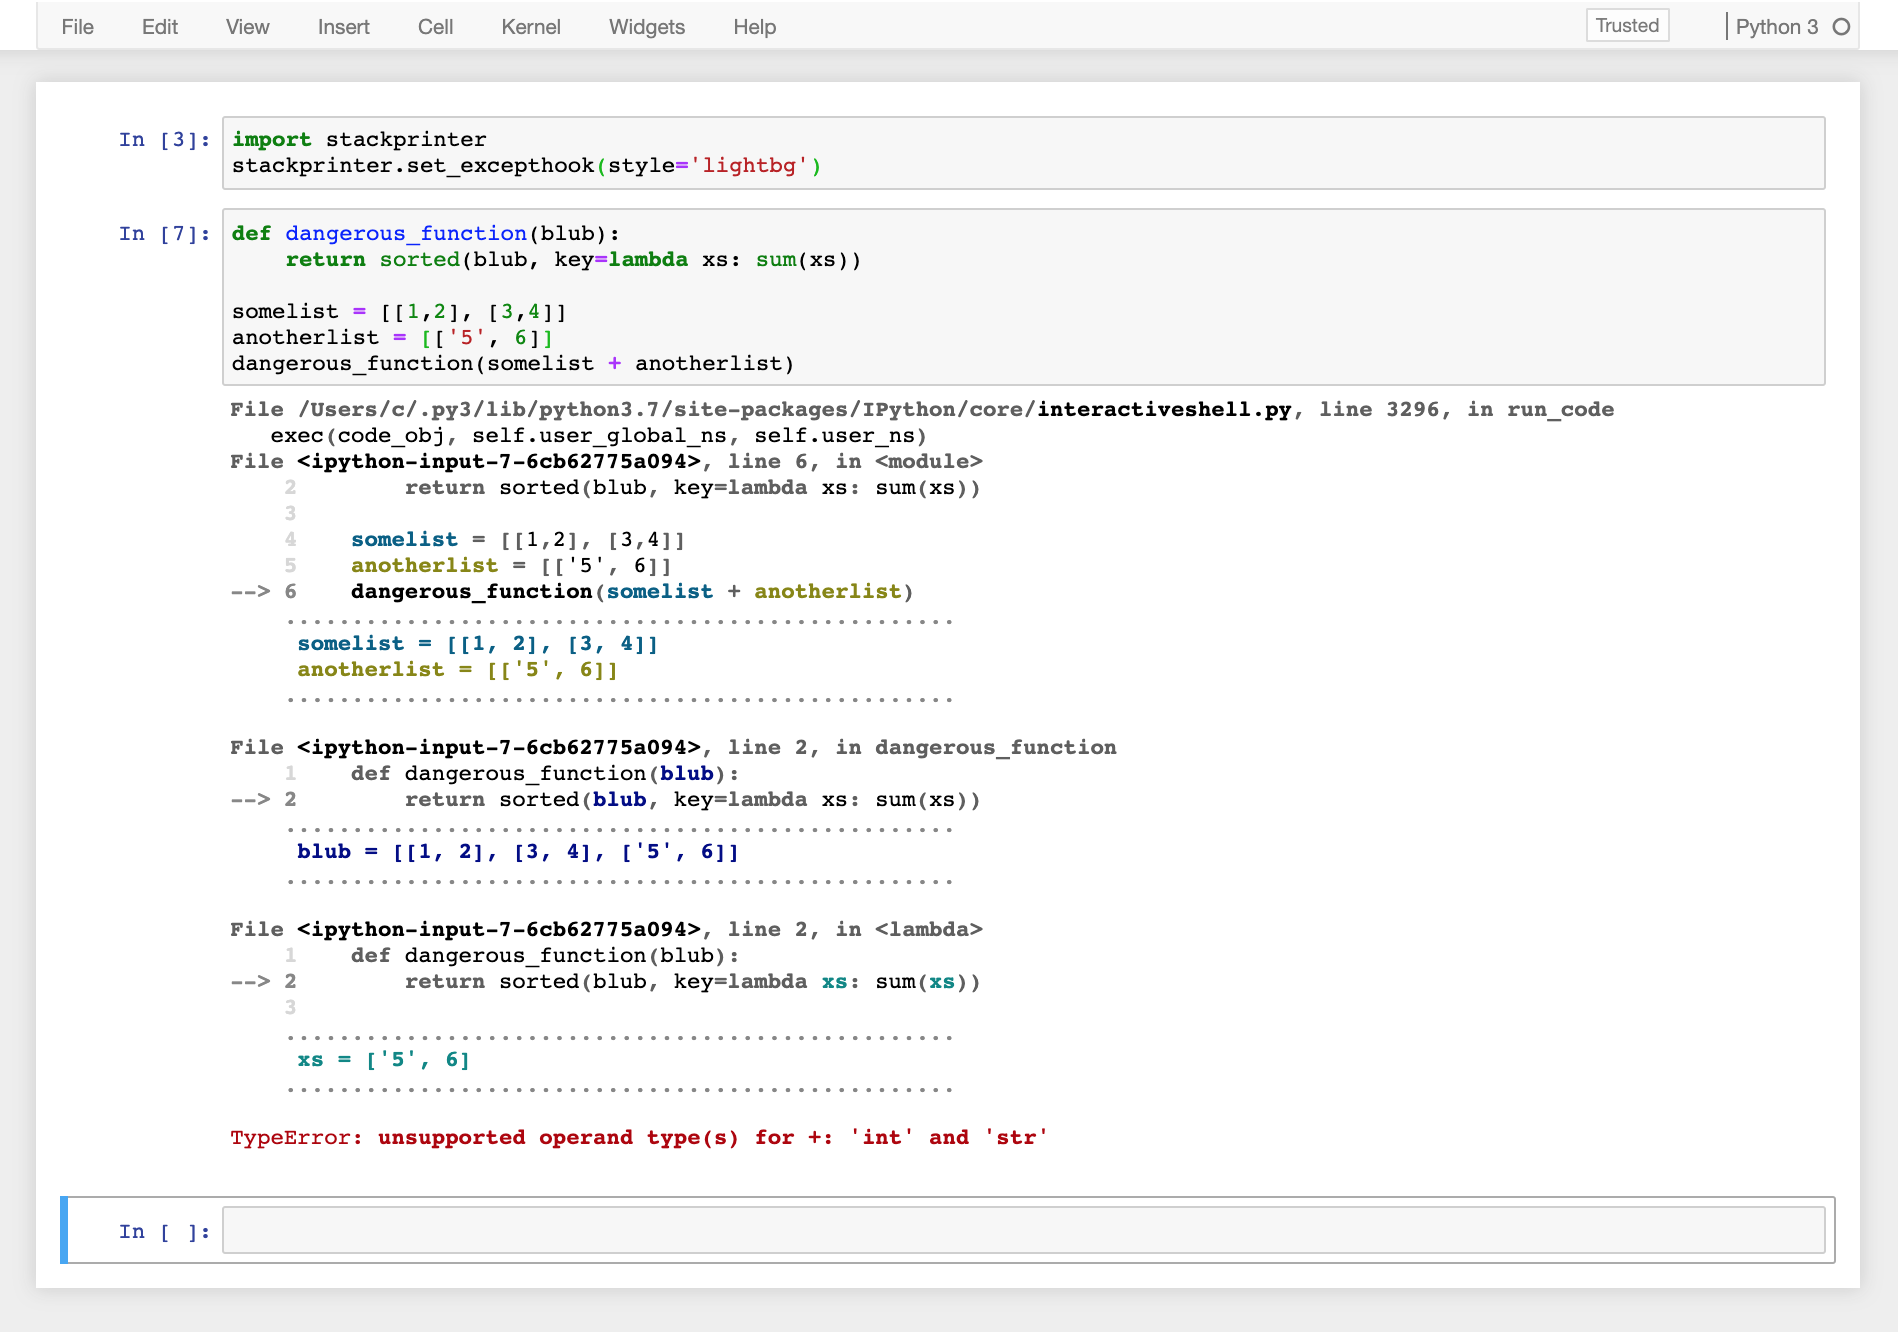
To replace the default python crash printout, call set_excepthook() somewhere once. Afterwards, any uncaught exception will be printed with an extended traceback (to stderr, by default). You could also make this permanent for your python installation.
import stackprinter
stackprinter.set_excepthook(style='darkbg2')  # for jupyter notebooks try style='lightbg'
Option 2: Call it selectively during exception handling
For more control, call show() or format() inside an except block. show() prints to stderr, format() returns a string, for custom logging.
try:
    something()
except:
    # print the current exception to stderr:
    stackprinter.show()

    # ...or instead, get a string for logging:
    logger.error(stackprinter.format())
Or pass specific exceptions explicitly:
try:
    something()
except RuntimeError as exc:
    tb = stackprinter.format(exc)
    logger.error('The front fell off.\n' + tb)
Config options
format(), show() and set_excepthook() accept a common set of keyword args. They allow you to tweak the formatting, hide certain variables by name, skip variables in calls within certain files, and some other stuff.
try:
    something()
except RuntimeError as exc:
    stackprinter.show(exc, suppressed_vars=[r".*secret.*"],
                           suppressed_paths=[r"lib/python.*/site-packages/boringstuff"],
                           truncate_vals=9001,
                           style="darkbg2")
For all the options see the docstring of format().
Option 3: Integrate with the standard logging module
With a bit of extra plumbing you can log errors like this via the normal logging methods, without having to import stackprinter at the site of the logging call. So you can continue to write nice and simple error handlers like so...
logger = logging.getLogger()
try:
    nothing = {}
    dangerous_function(nothing.get("something"))
except:
    logger.exception('My hovercraft is full of eels.')
...but still get annotated tracebacks in the resulting log.
2022-04-02 16:16:40,905 ERROR: My hovercraft is full of eels.
  ┆ File "demo_logging.py", line 56, in <module>
  ┆     54   try:
  ┆     55       nothing = {}
  ┆ --> 56       dangerous_function(nothing.get("something"))
  ┆     57   except:
  ┆     ..................................................
  ┆      nothing = {}
  ┆     ..................................................
  ┆
  ┆ File "demo_logging.py", line 52, in dangerous_function
  ┆     51   def dangerous_function(something):
  ┆ --> 52       return something + 1
  ┆     ..................................................
  ┆      something = None
  ┆     ..................................................
  ┆
  ┆ TypeError: unsupported operand type(s) for +: 'NoneType' and 'int'
You can get this by adding a custom formatter to the logger before using it:
import logging
import stackprinter

class VerboseExceptionFormatter(logging.Formatter):
    def formatException(self, exc_info):
        msg = stackprinter.format(exc_info)
        lines = msg.split('\n')
        lines_indented = ["  ┆ " + line + "\n" for line in lines]
        msg_indented = "".join(lines_indented)
        return msg_indented

def configure_logger(logger_name=None):
    fmt = '%(asctime)s %(levelname)s: %(message)s'
    formatter = VerboseExceptionFormatter(fmt)

    handler = logging.StreamHandler()
    handler.setFormatter(formatter)

    logger = logging.getLogger(logger_name)
    logger.addHandler(handler)

configure_logger("some_logger")
See demo_logging.py for a runnable example.
Printing the current call stack
To see your own thread's current call stack, call show or format anywhere outside of exception handling.
stackprinter.show() # or format()
Printing the stack of another thread
To inspect the call stack of any other running thread:
thread = threading.Thread(target=something)
thread.start()
# (...)
stackprinter.show(thread) # or format(thread)
Making it stick
To permanently replace the crash message for your python installation, you could put a file sitecustomize.py into the site-packages directory under one of the paths revealed by python -c "import site; print(site.PREFIXES)", with contents like this:
    # in e.g. some_virtualenv/lib/python3.x/site-packages/sitecustomize.py:
    import stackprinter
    stackprinter.set_excepthook(style='darkbg2')
That would give you colorful tracebacks automatically every time, even in the REPL.
(You could do a similar thing for IPython, but they have their own method, where the file goes into ~/.ipython/profile_default/startup instead, and also I don't want to talk about what this module does to set an excepthook under IPython.)
Docs
For now, the documentation consists only of some fairly detailed docstrings, e.g. those of format()
Caveats
This displays variable values as they are at the time of formatting. In multi-threaded programs, variables can change while we're busy walking the stack & printing them. So, if nothing seems to make sense, consider that your exception and the traceback messages are from slightly different times. Sadly, there is no responsible way to freeze all other threads as soon as we want to inspect some thread's call stack (...or is there?)
How it works
Basically, this is a frame formatter. For each frame on the call stack, it grabs the source code to find out which source lines reference which variables. Then it displays code and variables in the neighbourhood of the last executed line.
Since this already requires a map of where each variable occurs in the code, it was difficult not to also implement the whole semantic highlighting color thing seen in the screenshots. The colors are ANSI escape codes now, but it should be fairly straightforward™ to render the underlying data without any 1980ies terminal technology. Say, a foldable and clickable HTML page with downloadable pickled variables. For now you'll have to pipe the ANSI strings through ansi2html or something.
The format and everything is inspired by the excellent ultratb in IPython. One day I'd like to contribute the whole "find out which variables in locals and globals are nearby in the source and print only those" machine over there, after trimming its complexity a bit.
Tracing a piece of code
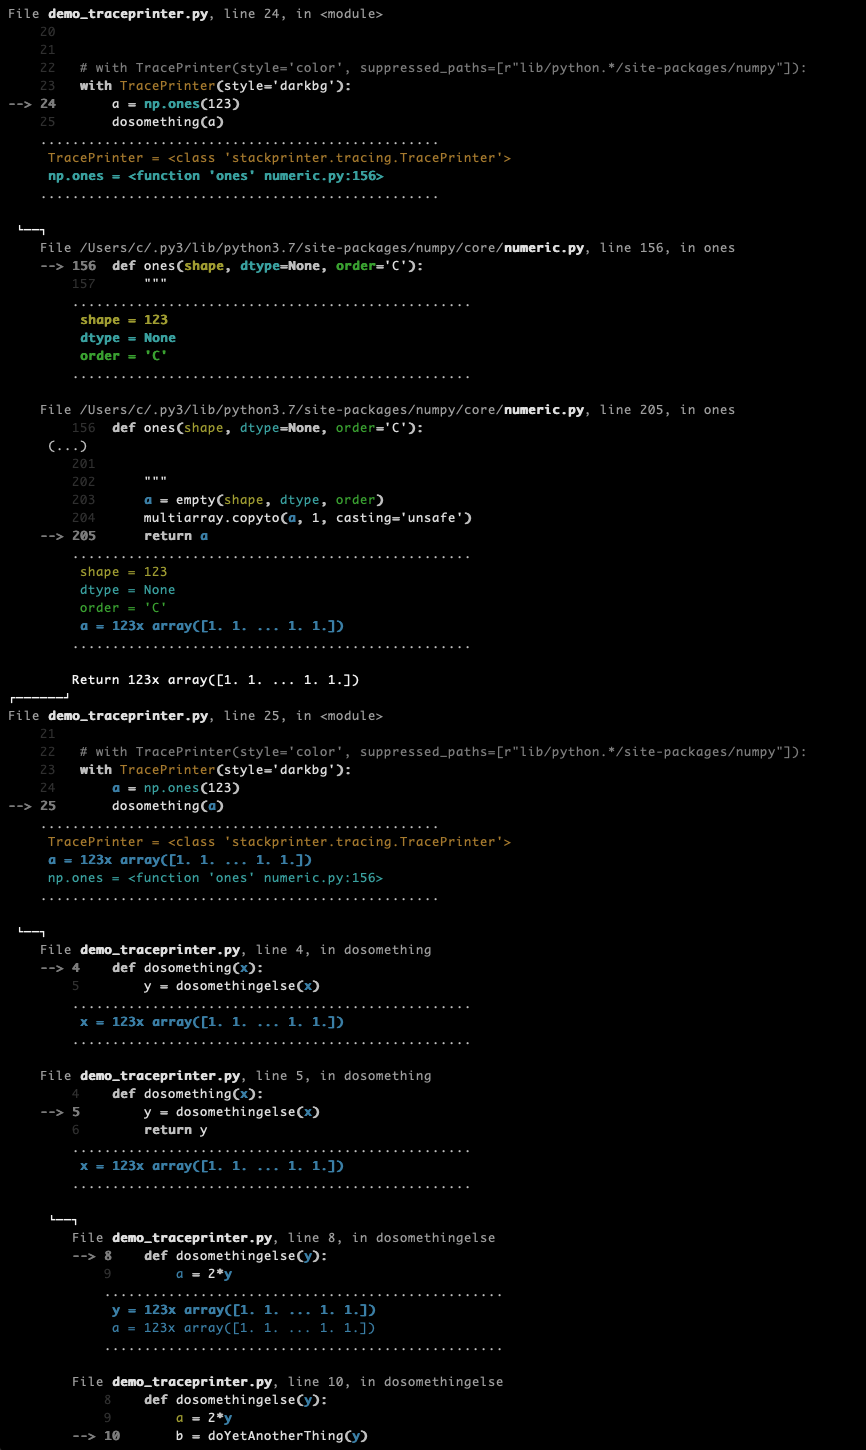
More for curiosity than anything else, you can watch a piece of code execute step-by-step, printing a trace of all calls & returns 'live' as they are happening. Slows everything down though, of course.
with stackprinter.TracePrinter(style='darkbg2'):
    dosomething()
or
tp = stackprinter.TracePrinter(style='darkbg2')
tp.enable()
dosomething()
# (...) +1 million lines
tp.disable()
1 maintainer

Metadata
1 maintainer
Release files for stackprinter 0.2.13
For a detailed explanation of source distributions (sdists) and built distributions (wheels), please see the package formats documentation.
Source distribution (sdist)
| File | Size | Uploaded | |
|---|---|---|---|
| stackprinter-0.2.13.tar.gz | 31.5 kB | Details |
Built distribution (wheel)
| File | Interpreter | ABI | Platform | Reset |
|---|---|---|---|---|
| stackprinter-0.2.13-py3-none-any.whl | Python 3 | none | any | Details |
Total release size: 61.1 kB
Release files / stackprinter-0.2.13.tar.gz
| Download URL | stackprinter-0.2.13.tar.gz |
|---|---|
| Size | 31.5 kB |
| Tags | Source |
|
SHA-256 checksum How to use checksums |
6532f2473675927e38e0241212a341549c5d1329446d2b771bb9b1db8ecfca8e
|
|
BLAKE2b-256 checksum How to use checksums |
e1fedf1f85d63a26839bc58aee52005d3806d89bf719cc035931016f2d1247cd
|
| Upload date | |
|
Uploaded using Trusted Publishing? What is trusted publishing? |
No |
| Uploaded via |
twine/6.1.0 CPython/3.13.7
|
Release files / stackprinter-0.2.13-py3-none-any.whl
| Download URL | stackprinter-0.2.13-py3-none-any.whl |
|---|---|
| Size | 29.6 kB |
| Tags | Python 3 |
|
SHA-256 checksum How to use checksums |
3def92f858183501db773882a368f5dcd66b1fcad0a14923ab3d7b1fe758f3d2
|
|
BLAKE2b-256 checksum How to use checksums |
5e1e4e0a83c46b6b7362104252561166557c21ffc00bfaf7a54b607e8fc639c3
|
| Upload date | |
|
Uploaded using Trusted Publishing? What is trusted publishing? |
No |
| Uploaded via |
twine/6.1.0 CPython/3.13.7
|














