Explore Data Pipelines in Apache Kafka.

Project description
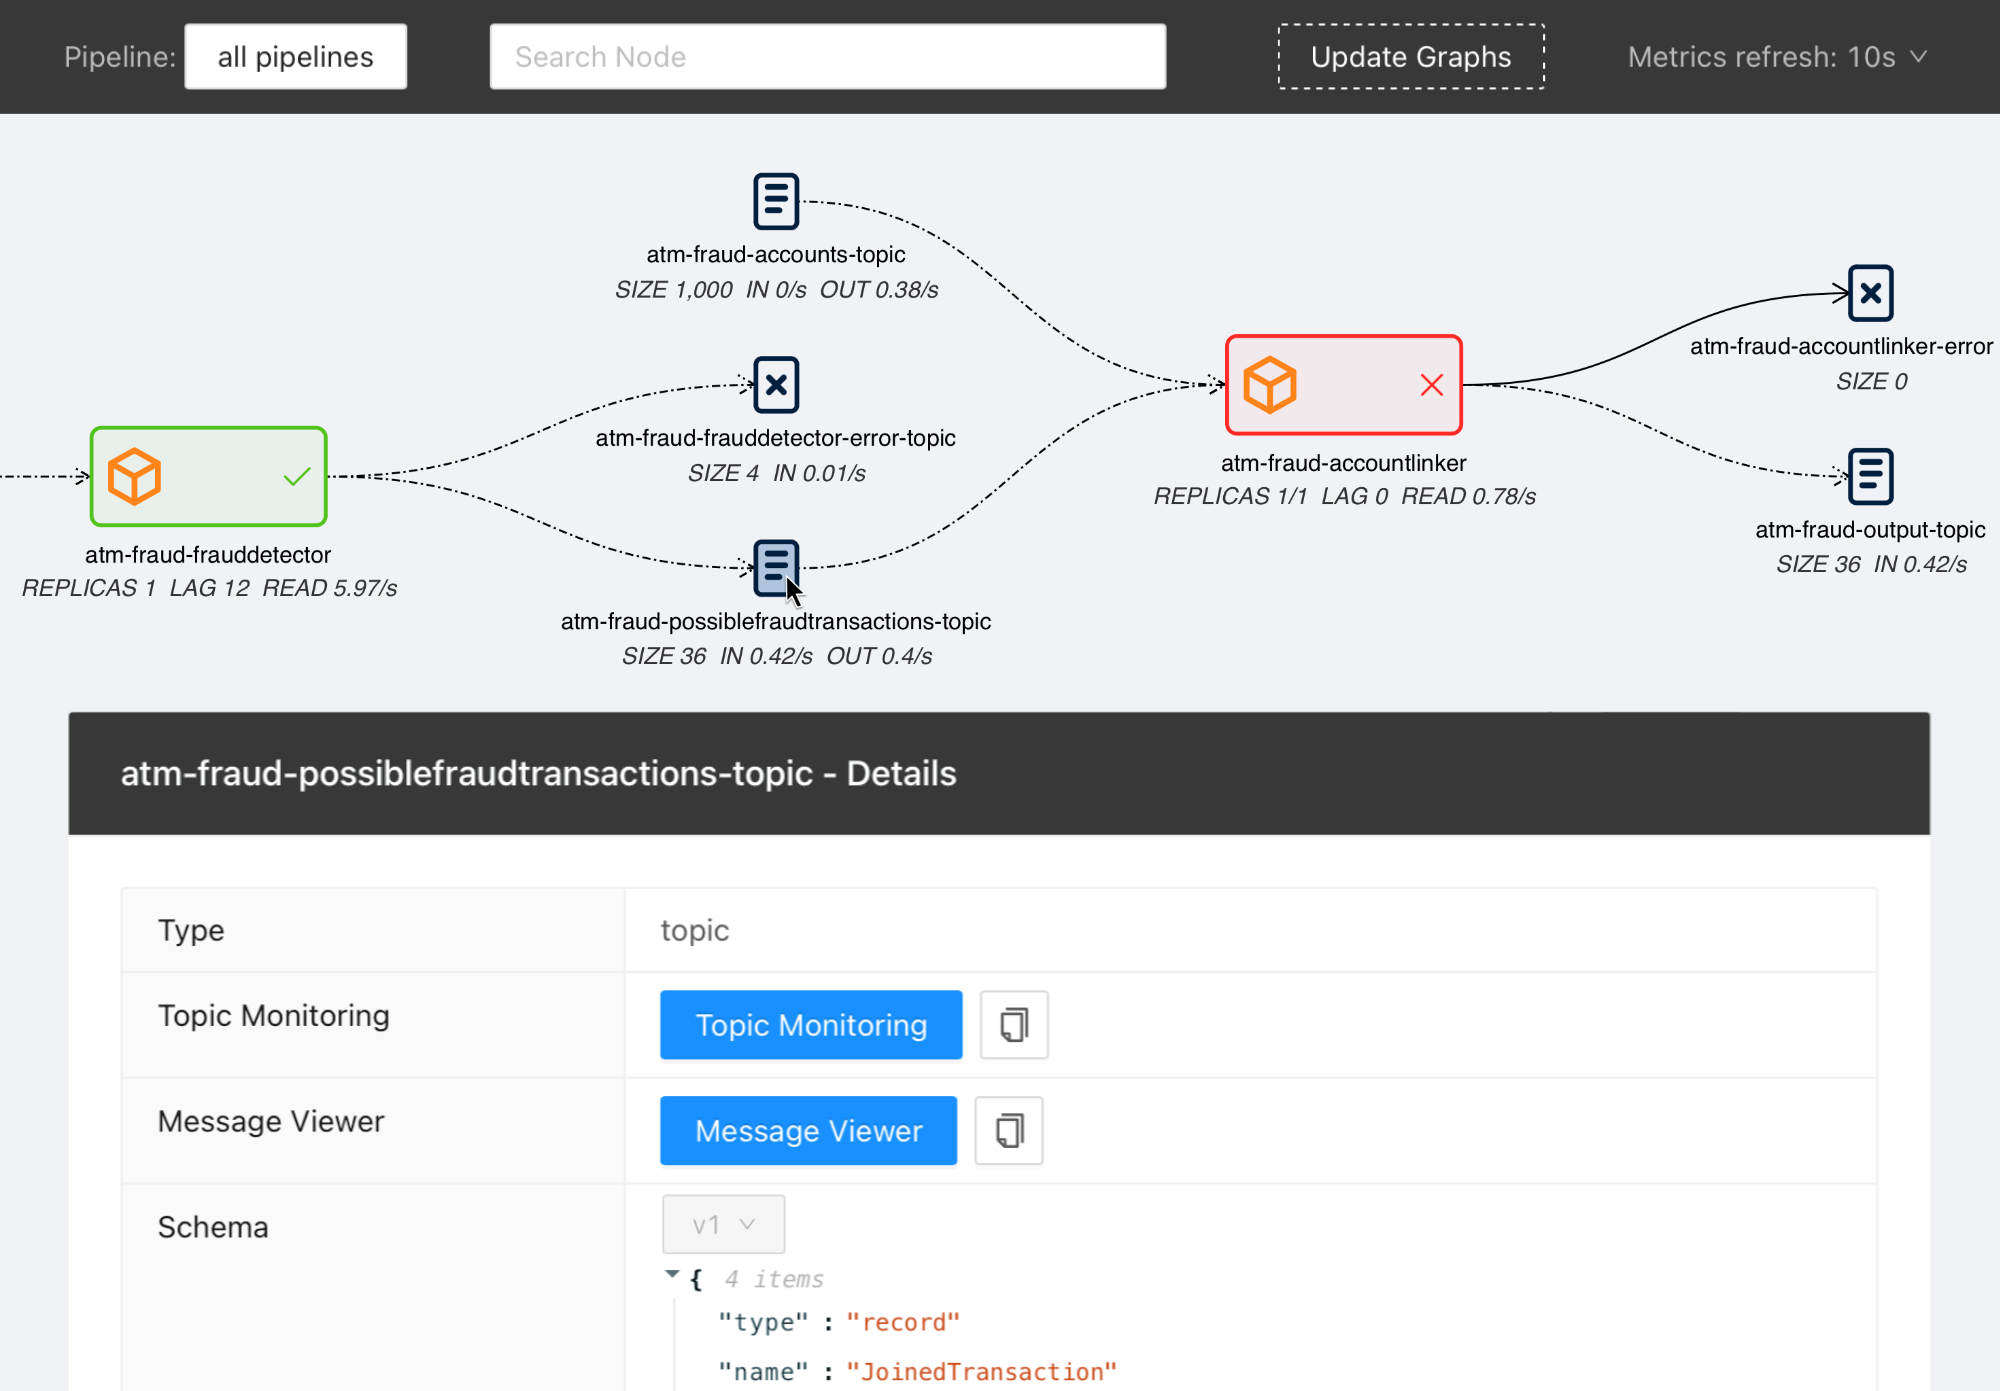
Streams Explorer
Explore Apache Kafka data pipelines in Kubernetes.
Note We are participating in the annual Hacktoberfest. If you're looking to contribute, please see our open issues and use the standalone installation for development.
Contents
Features
- Visualization of streaming applications, topics, and connectors
- Monitor all or individual pipelines from multiple namespaces
- Inspection of Avro schema from schema registry
- Integration with streams-bootstrap and faust-bootstrap, or custom streaming app config parsing from Kubernetes deployments using plugins
- Real-time metrics from Prometheus (consumer lag & read rate, replicas, topic size, messages in & out per second, connector tasks)
- Linking to external services for logging and analysis, such as Kibana, Grafana, Loki, AKHQ, Redpanda Console, and Elasticsearch
- Customizable through Python plugins
Overview
Visit our introduction blogpost for a complete overview and demo of Streams Explorer.
Installation
Prerequisites Access to a Kubernetes cluster, where streaming apps and services are deployed.
Docker Compose
- Forward the ports to Prometheus. (Kafka Connect, Schema Registry, and other integrations are optional)
- Start the container
docker compose up
Once the container is started visit http://localhost:8080
Deploying to Kubernetes cluster
- Add the Helm chart repository
helm repo add streams-explorer https://bakdata.github.io/streams-explorer
- Install
helm upgrade --install --values helm-chart/values.yaml streams-explorer streams-explorer/streams-explorer
Standalone
Backend
- Install dependencies using Poetry
poetry install
- Forward the ports to Prometheus. (Kafka Connect, Schema Registry, and other integrations are optional)
- Configure the backend in settings.yaml.
- Start the backend server
poetry run start
Frontend
- Install dependencies
npm ci
- Start the frontend server
npm run build && npm run prod
Visit http://localhost:3000
Configuration
Depending on your type of installation set the configuration for the backend server in this file:
- Docker Compose: docker-compose.yaml
- Kubernetes: helm-chart/values.yaml
- standalone: backend/settings.yaml
In the helm-chart/values.yaml configuration is done either through the config section using double underscore notation, e.g. K8S__consumer_group_annotation: consumerGroup or the content of backend/settings.yaml can be pasted under the settings section. Alternatively all configuration options can be written as environment variables using double underscore notation and the prefix SE, e.g. SE_K8S__deployment__cluster=false.
The following configuration options are available:
General
graph.update_intervalRender the graph every x seconds (int, required, default:30)graph.layout_argumentsArguments passed to graphviz layout (string, required, default:-Grankdir=LR -Gnodesep=0.8 -Gpad=10)graph.pipeline_distanceIncrease/decrease vertical space between pipeline graphs by X pixels (int, required, default:500)graph.resolve.input_pattern_topics.allIf true topics that match (extra) input pattern(s) are connected to the streaming app in the graph containing all pipelines (bool, required, default:false)graph.resolve.input_pattern_topics.pipelinesIf true topics that match (extra) input pattern(s) are connected to the streaming app in pipeline graphs (bool, required, default:false)
Kafka
kafka.enableEnable Kafka (bool, default:false)kafka.configlibrdkafka configuration properties (reference) (dict, default:{"bootstrap.servers": "localhost:9092"})kafka.displayed_informationConfiguration options of Kafka topics displayed in the frontend (list of dict)kafka.topic_names_cache.ttlCache for retrieving all topic names (used when input topic patterns are resolved) (int, default:3600)
Kafka Connect
kafkaconnect.urlURL of Kafka Connect server (string, default: None)kafkaconnect.update_intervalFetch connectors every x seconds (int, default:300)kafkaconnect.displayed_informationConfiguration options of Kafka connectors displayed in the frontend (list of dict)
Kubernetes
k8s.deployment.clusterWhether streams-explorer is deployed to Kubernetes cluster (bool, required, default:false)k8s.deployment.contextName of cluster (string, optional if running in cluster, default:kubernetes-cluster)k8s.deployment.namespacesKubernetes namespaces (list of string, required, default:['kubernetes-namespace'])k8s.containers.ignoreName of containers that should be ignored/hidden (list of string, default:['prometheus-jmx-exporter'])k8s.displayed_informationDetails of pod that should be displayed (list of dict, default:[{'name': 'Labels', 'key': 'metadata.labels'}])k8s.labelsLabels used to set attributes of nodes (list of string, required, default:['pipeline'])k8s.pipeline.labelAttribute of nodes the pipeline name should be extracted from (string, required, default:pipeline)k8s.consumer_group_annotationAnnotation the consumer group name should be extracted from (string, required, default:consumerGroup)
Schema Registry / Karapace
schemaregistry.urlURL of Confluent Schema Registry or Karapace (string, default: None)
Prometheus
prometheus.urlURL of Prometheus (string, required, default:http://localhost:9090)
The following exporters are required to collect Kafka metrics for Prometheus:
AKHQ
akhq.enableEnable AKHQ (bool, default:false)akhq.urlURL of AKHQ (string, default:http://localhost:8080)akhq.clusterName of cluster (string, default:kubernetes-cluster)akhq.connectName of connect (string, default: None)
Redpanda Console
Redpanda Console can be used instead of AKHQ. (mutually exclusive)
redpanda_console.enableEnable Redpanda Console (bool, default:false)redpanda_console.urlURL of Redpanda Console (string, default:http://localhost:8080)
Grafana
grafana.enableEnable Grafana (bool, default:false)grafana.urlURL of Grafana (string, default:http://localhost:3000)grafana.dashboards.topicsPath to topics dashboard (string), sample dashboards for topics and consumer groups are included in the./grafanasubfoldergrafana.dashboards.consumergroupsPath to consumer groups dashboard (string)
Kibana
kibanalogs.enableEnable Kibana logs (bool, default:false)kibanalogs.urlURL of Kibana logs (string, default:http://localhost:5601)
Loki
Loki can be used instead of Kibana. (mutually exclusive)
loki.enableEnable Loki logs (bool, default:false)loki.urlURL of Loki logs (string, default:http://localhost:3000)
Elasticsearch
for Kafka Connect Elasticsearch connector
esindex.urlURL of Elasticsearch index (string, default:http://localhost:5601/app/kibana#/dev_tools/console)
Plugins
plugins.pathPath to folder containing plugins relative to backend (string, required, default:./plugins)plugins.extractors.defaultWhether to load default extractors (bool, required, default:true)
Demo pipeline
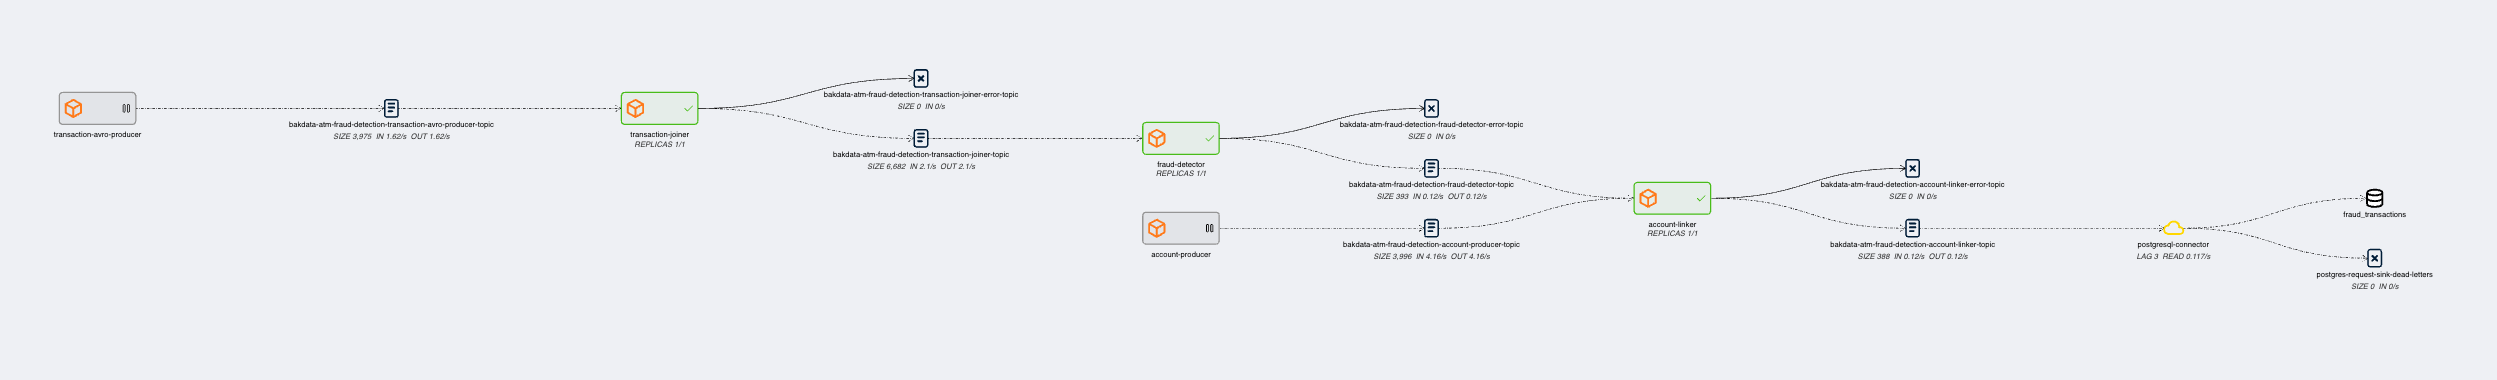
ATM Fraud detection with streams-bootstrap
Plugin customization
It is possible to create your own config parser, linker, metric provider, and extractors in Python by implementing the K8sConfigParser, LinkingService, MetricProvider, or Extractor classes. This way you can customize it to your specific setup and services. As an example we provide the DefaultLinker as LinkingService. The default MetricProvider supports Prometheus. Furthermore the following default Extractor plugins are included:
If your streaming application deployments are configured through environment variables, following the schema of streams-bootstrap or faust-bootstrap, the Streams Explorer works out-of-the-box with the default deployment parser.
For streams-bootstrap deployments configured through CLI arguments a separate parser can be loaded by creating a Python file (e.g. config_parser.py) in the plugins folder with the following import statement:
from streams_explorer.core.k8s_config_parser import StreamsBootstrapArgsParser
For other setups a custom config parser plugin can be created by inheriting from the K8sConfigParser class and implementing the parse method. In this example we're retrieving the streaming app configurations from an external REST API. In order for a deployment to be indentified as streaming app, input and output topics are required.
import httpx

from streams_explorer.core.k8s_config_parser import K8sConfigParser
from streams_explorer.models.k8s import K8sConfig


class CustomConfigParser(K8sConfigParser):
    def get_name(self) -> str:
        name = self.k8s_app.metadata.name
        if not name:
            raise TypeError(f"Name is required for {self.k8s_app.class_name}")
        return name

    def parse(self) -> K8sConfig:
        """Retrieve app config from REST endpoint."""
        name = self.get_name()
        data = httpx.get(f"url/config/{name}").json()
        return K8sConfig(**data)
Release history Release notifications | RSS feed


Download files
Download the file for your platform. If you're not sure which to choose, learn more about installing packages.
Source Distribution
Built Distribution
Filter files by name, interpreter, ABI, and platform.
If you're not sure about the file name format, learn more about wheel file names.
Copy a direct link to the current filters
File details
Details for the file streams_explorer-2.4.1.tar.gz.
File metadata
- Download URL: streams_explorer-2.4.1.tar.gz
- Upload date:
- Size: 34.6 kB
- Tags: Source
- Uploaded using Trusted Publishing? No
- Uploaded via: poetry/1.3.2 CPython/3.12.3 Linux/6.8.0-1021-azure
File hashes
| Algorithm | Hash digest | |
|---|---|---|
| SHA256 |
fd1e2cc4eceb87a59d76a5ba4960ac8f74648b85be53c9dd177e5fc066feaad5
|
|
| MD5 |
030fc31e38bc001a7d7da1dda379fa3d
|
|
| BLAKE2b-256 |
82521b54f0f58af68e7f27b24a9b3c96ec6ed75c0e22cc4defc2816dc81cc3b0
|
File details
Details for the file streams_explorer-2.4.1-py3-none-any.whl.
File metadata
- Download URL: streams_explorer-2.4.1-py3-none-any.whl
- Upload date:
- Size: 47.1 kB
- Tags: Python 3
- Uploaded using Trusted Publishing? No
- Uploaded via: poetry/1.3.2 CPython/3.12.3 Linux/6.8.0-1021-azure
File hashes
| Algorithm | Hash digest | |
|---|---|---|
| SHA256 |
083180c6ade0eb46c1b38e06bca3bfd08fce35ff67ff05726d603b171111d259
|
|
| MD5 |
bfe8aa1245ae9217ce4073b40410ddd0
|
|
| BLAKE2b-256 |
60a7adc06f38273a967e6895577e8e5e411abc3b1357ed8b4bc097b645794fcf
|


