Generate statistics from Taiga and produce burnup diagrams, CFDs, dependency graphs and more.

Project description
Taiga Stats - Your Taiga Statistics Tool 


This is a script for all you Scrum||Kanban masters out there who use Taiga and are interested in visualizing progress and generate some automated statistics and graphs.
Taiga is an Open Source virtual Scrum and Kanban board that is popular for managing projects and work. We use a physical whiteboard at work but I mirror the status of stories in Taiga so that I can collect some statistics and generate diagrams and graphs using this tool I wrote.
Features
$ taiga-stats --help
usage: taiga-stats [-h] [-v] [--url URL] [--auth-token AUTH_TOKEN]
{config_template,list_projects,list_us_statuses,burnup,store_daily,points_sum,cfd,deps_dot_nodes,deps_dot}
...
Taiga statistic tool. Default values for many options can be set config file;
see the command 'config_template'.
positional arguments:
{config_template,list_projects,list_us_statuses,burnup,store_daily,points_sum,cfd,deps_dot_nodes,deps_dot}
Commands. Run $(taiga-stats <command> -h) for more
info about a command.
config_template Generate a template configuration file.
list_projects List all found project IDs and names on the server
that you have access to read.
list_us_statuses List all the ID and names of User Story statuses.
burnup Print burn(up|down) statistics. Typically used for
entering in an Excel sheet or such that plots a
burnup.
store_daily Store the current state of a project on file so that
the CFD command can generate a diagram with this data.
points_sum Print out the sum of points in User Story statuses.
cfd Generate a Cumulative Flow Diagram from stored data.
deps_dot_nodes Print User Story nodes in .dot file format.
deps_dot Print US in .dot file format with dependencies too!
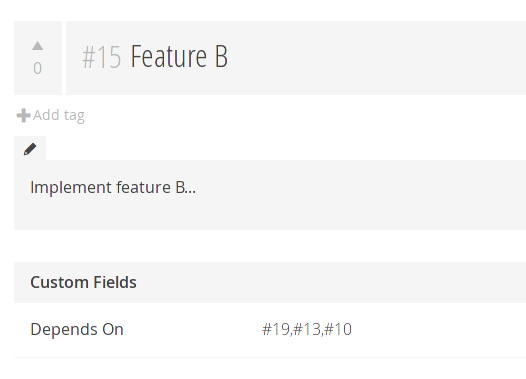
Create a custom attribute for User Stories named
'Depends On' by going to Settings>Attributes>Custom
Fields. Then go to a User Story and put in a comma
separated list of stories that this story depends on
e.g. '#123,#456'.
options:
-h, --help show this help message and exit
-v, --version show program's version number and exit
--url URL URL to Taiga server.
--auth-token AUTH_TOKEN
Authentication token. Instructions on how to get one
is found at
https://docs.taiga.io/api.html#_authentication
Support: please go to https://github.com/erikw/taiga-stats/issues
Terminology
- US - User Story
- CFD - Cumulative Flow Diagram
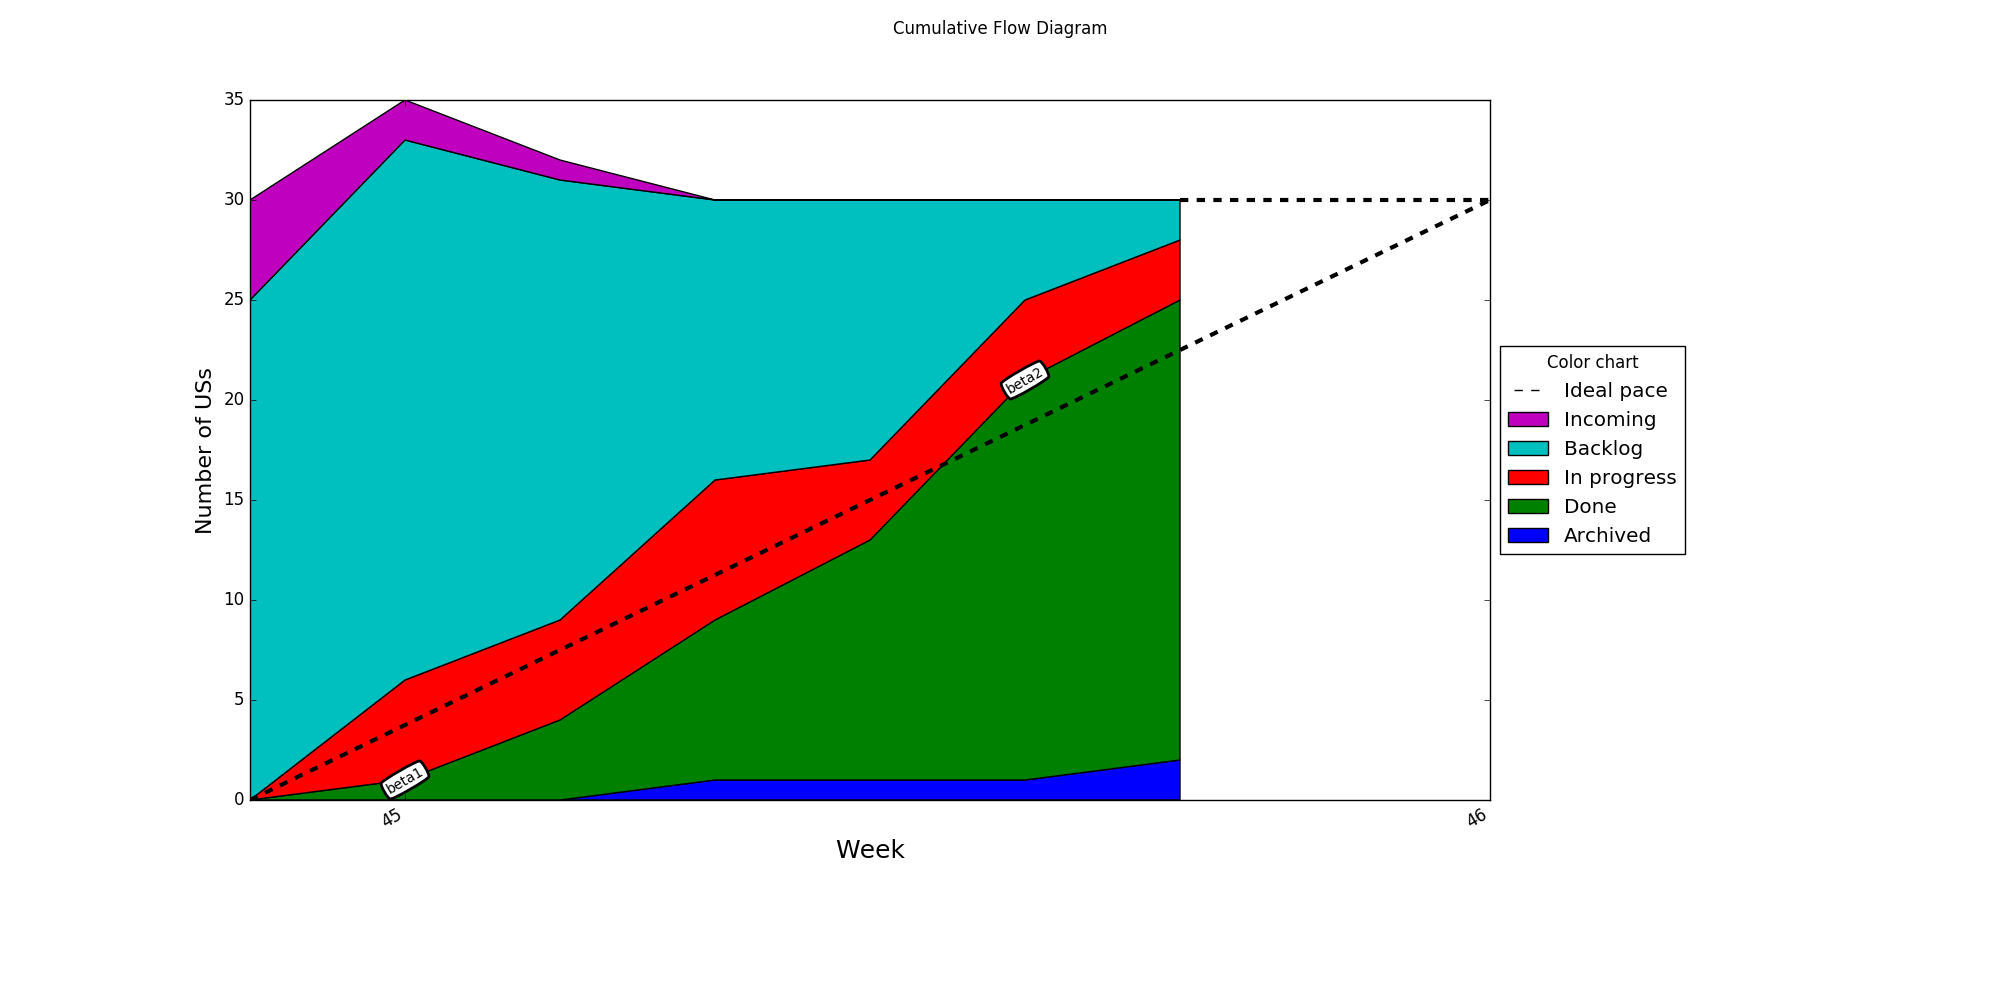
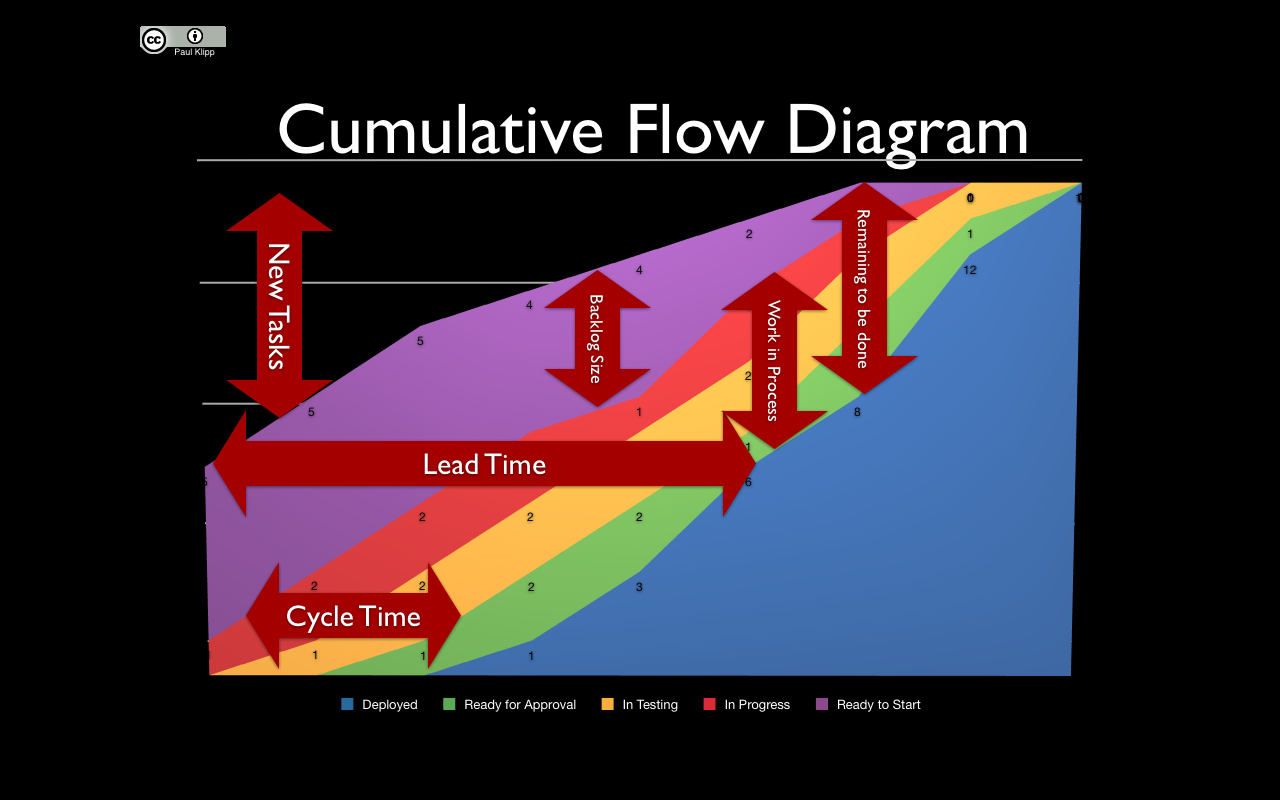
Cumulative Flow Diagram
From a CFD a lot of interesting insights about your team's progress can be found. However I'm not found of repetitive work like counting and entering numbers in an Excel sheet. This had to be automated! Therefore I deiced to write this script to save data on a daily basis with a cron job and a function for generating this diagram. This diagram can the be put on a TV visible in the hallways.
This is an example diagram generated from mock data:
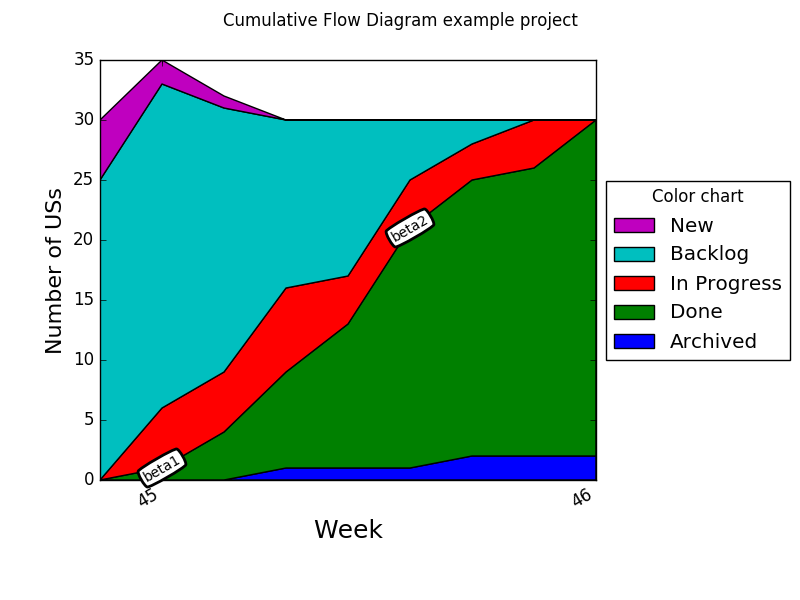
Textual annotations can be put in the plot by manually editing the .dat file.
Also a target date for the project deadline can be specified. Then a line will be drawn showing the ideal work pace towards this date, as seen below where the target finish date is in week 46.
To save the data and generate the diagram each working day I have this cronjob:
$ crontab -l | grep taiga
0 18 * * 1-5            $HOME/bin/taiga-stats-cron.sh
and the script taiga-stats-cron.sh:
#!/usr/bin/env sh

taiga-stats store_daily --tag some_feature_tag
taiga-stats cfd --tag some_feature_tag
User Story Dependency Graph
Some stories requires other to be completed before they can be started. I thought it would be handy if you could keep track of these dependencies in Taiga but simply writing for each US a list of other stories that this story depends on. Then from this information a .dot file can be generated that should how you user stories depends on each other. This graph is very useful for work planning i.e. what to start with and how much parallelization is possible and at what stages.
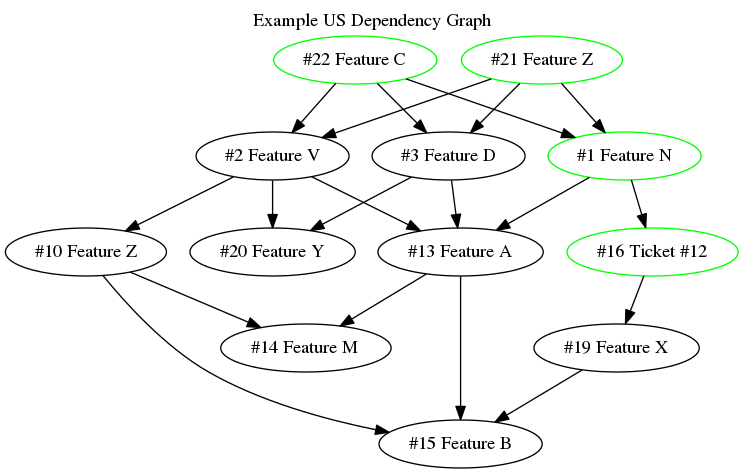
The stories that are marked as Done in Taiga have a green color in the graph.
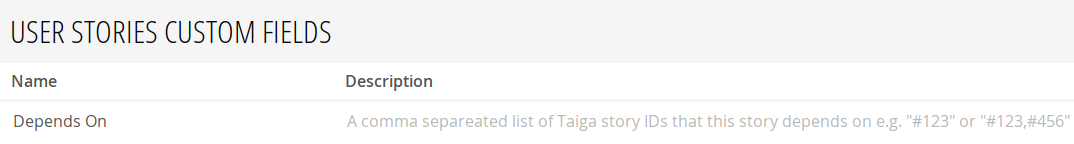
How to set up the dependency feature
First create a new custom filed in taiga named Depends On under Settings > Attributes > Custom Fields:
Then go to your User Stories and enter some dependencies as demonstrated below.
Then run the script and generate a PNG file.
taiga-stats deps_dot
dot -T png -o ./dependencies.png ./dependencies.dot
Setup
Installation
Make sure to use a supported python version. See the key python in the section tool.poetry.dependencies at pyproject.toml.
pip install taiga-stats
taiga-stats -h
If you use pipx to install, you must specify a supported and locally available python version like:
pipx install --python python3.9 taiga-stats
To use this tool, you need to supply
--urlto your taiga server e.g.https://api.taiga.io/--auth-tokenthat you need to obtain according to the official instructions.
It's recommended to put these 2 values in the below described taiga-stats.conf file for easier usage of this tool!
Config file
It is tedious to have to specify the server URL and the authentication token every time. Also you typically work with some project at a time and would like to have default values for the project to use and maybe which tag to filter on. You can generate a configuration file to set these default values.
taiga-stats config_template
mv ./taiga.conf.template ~/.taiga-stats.conf
vi ~/.taiga-stats.conf
Development
- Make sure to
$ poetry shellbefore using tools like pyright LSP, so that it can find the installed dependency modules - Reference for how to structure a python project: https://realpython.com/pypi-publish-python-package/
Setup from Git
- Clone this git
git clone https://github.com/erikw/taiga-stats.git && cd $(basename "$_" .git)
- Install Poetry
pip install poetry
- Install project dependencies
poetry install
- Now taiga-stats should work!
poetry run taiga-stats -h
# or
bin/taiga-stats.sh
- To install locally:
poetry build
pip install dist/taiga_stats-*.whl
Development
Documentation generation
poetry run mkdocs serve
poetry run mkdocs build
but bin/gen_docs.sh will take care of all that plus more!
Releasing
bin/gen_docs.sh
vi CHANGELOG.md
poetry version minor && ver="v$(poetry version -s)"
git commit -am "Bump version to $ver" && git tag $ver && git push --atomic origin main $ver
poetry publish --build
Release history Release notifications | RSS feed


Download files
Download the file for your platform. If you're not sure which to choose, learn more about installing packages.
Source Distribution
Built Distribution
Filter files by name, interpreter, ABI, and platform.
If you're not sure about the file name format, learn more about wheel file names.
Copy a direct link to the current filters
File details
Details for the file taiga_stats-1.7.0.tar.gz.
File metadata
- Download URL: taiga_stats-1.7.0.tar.gz
- Upload date:
- Size: 17.8 kB
- Tags: Source
- Uploaded using Trusted Publishing? No
- Uploaded via: poetry/2.0.1 CPython/3.12.1 Linux/6.5.0-1025-azure
File hashes
| Algorithm | Hash digest | |
|---|---|---|
| SHA256 |
6b5bdc88f24c76bfebc5f1cbd689c811d38a928dddf878bfe03c8c3ad4dc2eda
|
|
| MD5 |
f799b2c33b015ab34862550945bc42ca
|
|
| BLAKE2b-256 |
e53b99199e97489cee74fe94a06767d9c2ff21fcba2d67169831347039ef9558
|
File details
Details for the file taiga_stats-1.7.0-py3-none-any.whl.
File metadata
- Download URL: taiga_stats-1.7.0-py3-none-any.whl
- Upload date:
- Size: 16.1 kB
- Tags: Python 3
- Uploaded using Trusted Publishing? No
- Uploaded via: poetry/2.0.1 CPython/3.12.1 Linux/6.5.0-1025-azure
File hashes
| Algorithm | Hash digest | |
|---|---|---|
| SHA256 |
61211e49e0778ec59bf8d195c6b75f891a495a02de6ebf1b4dc9ab0c997fc1bf
|
|
| MD5 |
bf87cd31e82c6c2f7819b4f457ac2a27
|
|
| BLAKE2b-256 |
468884f3a22bbe8573cd0412de04579d739cb633bec02bb65aafd25a69c837d9
|


