Plot simple tanglegrams from two dendrograms

Project description
tanglegram
Uses scipy and matplotlib to plot simple tanglegrams. Inspired by the amazing dendextend by Tal Galili.
Installation
First, get PIP and then run in terminal:
pip3 install tanglegram -U
To install the bleeding-edge version from Github you can run:
pip3 install git+git://github.com/schlegelp/tanglegram@master
Attention: on Windows, the dependencies (i.e. Numpy, Pandas and SciPy) will likely fail to install automatically. Your best bet is to get a Python distribution that already includes them (e.g. Anaconda).
Dependencies
Installing via PIP should install all external dependencies. You may run into problems on Windows though. In that case, you need to install dependencies manually, here is a list of dependencies (check out install_requires in setup.py for version info):
How it works
tanglegram exposes three functions:
tanglegram.plotplots a tanglegram (optionally untangling)tanglegram.entanglementmeasures the entanglement between two linkagestanglegram.untanglerotates dendrograms to minimize entanglement
import tanglegram as tg
import matplotlib.pyplot as plt
import pandas as pd
# Generate two distance matrices and just switch labels in one
labelsA= ['A', 'B', 'C', 'D']
labelsB= ['B', 'A', 'C', 'D']
data = [[ 0, .1, .4, .3],
[.1, 0, .5, .6],
[ .4, .5, 0, .2],
[ .3, .6, .2, 0]]
mat1 = pd.DataFrame(data,
columns=labelsA,
index=labelsA)
mat2 = pd.DataFrame(data,
columns=labelsB,
index=labelsB)
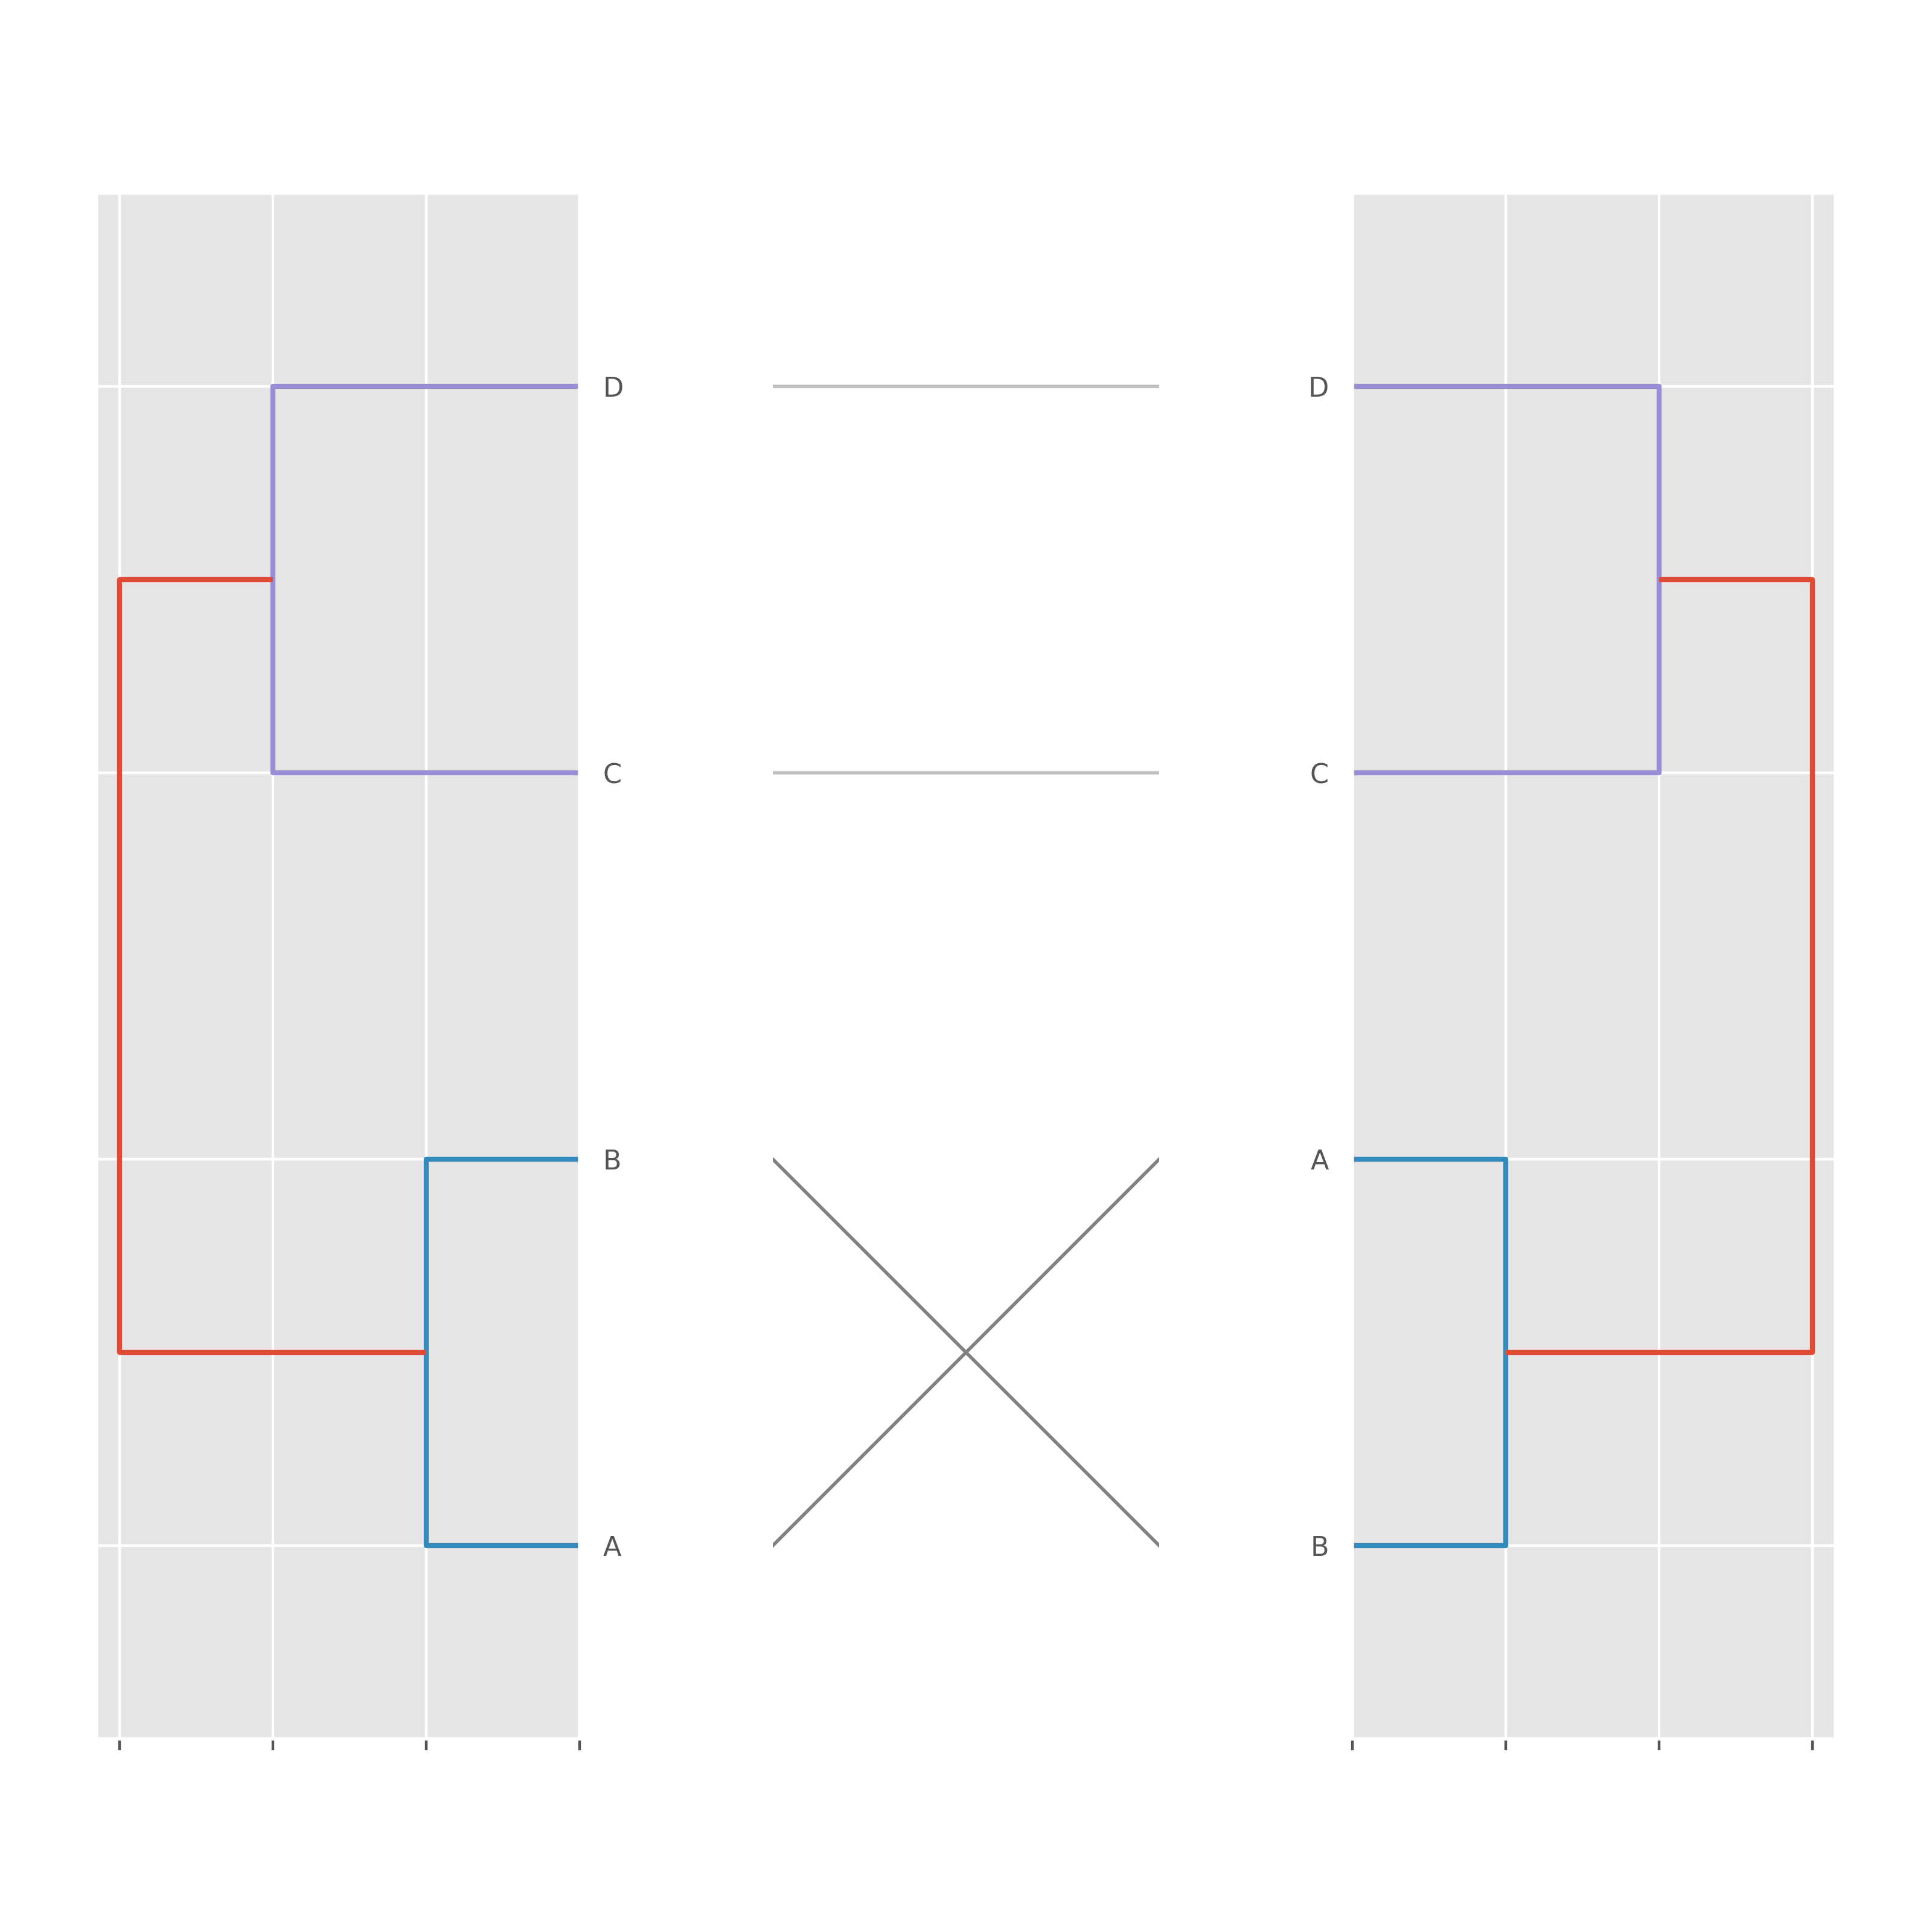
# Plot tanglegram
fig = tg.plot(mat1, mat2, sort=False)
plt.show()
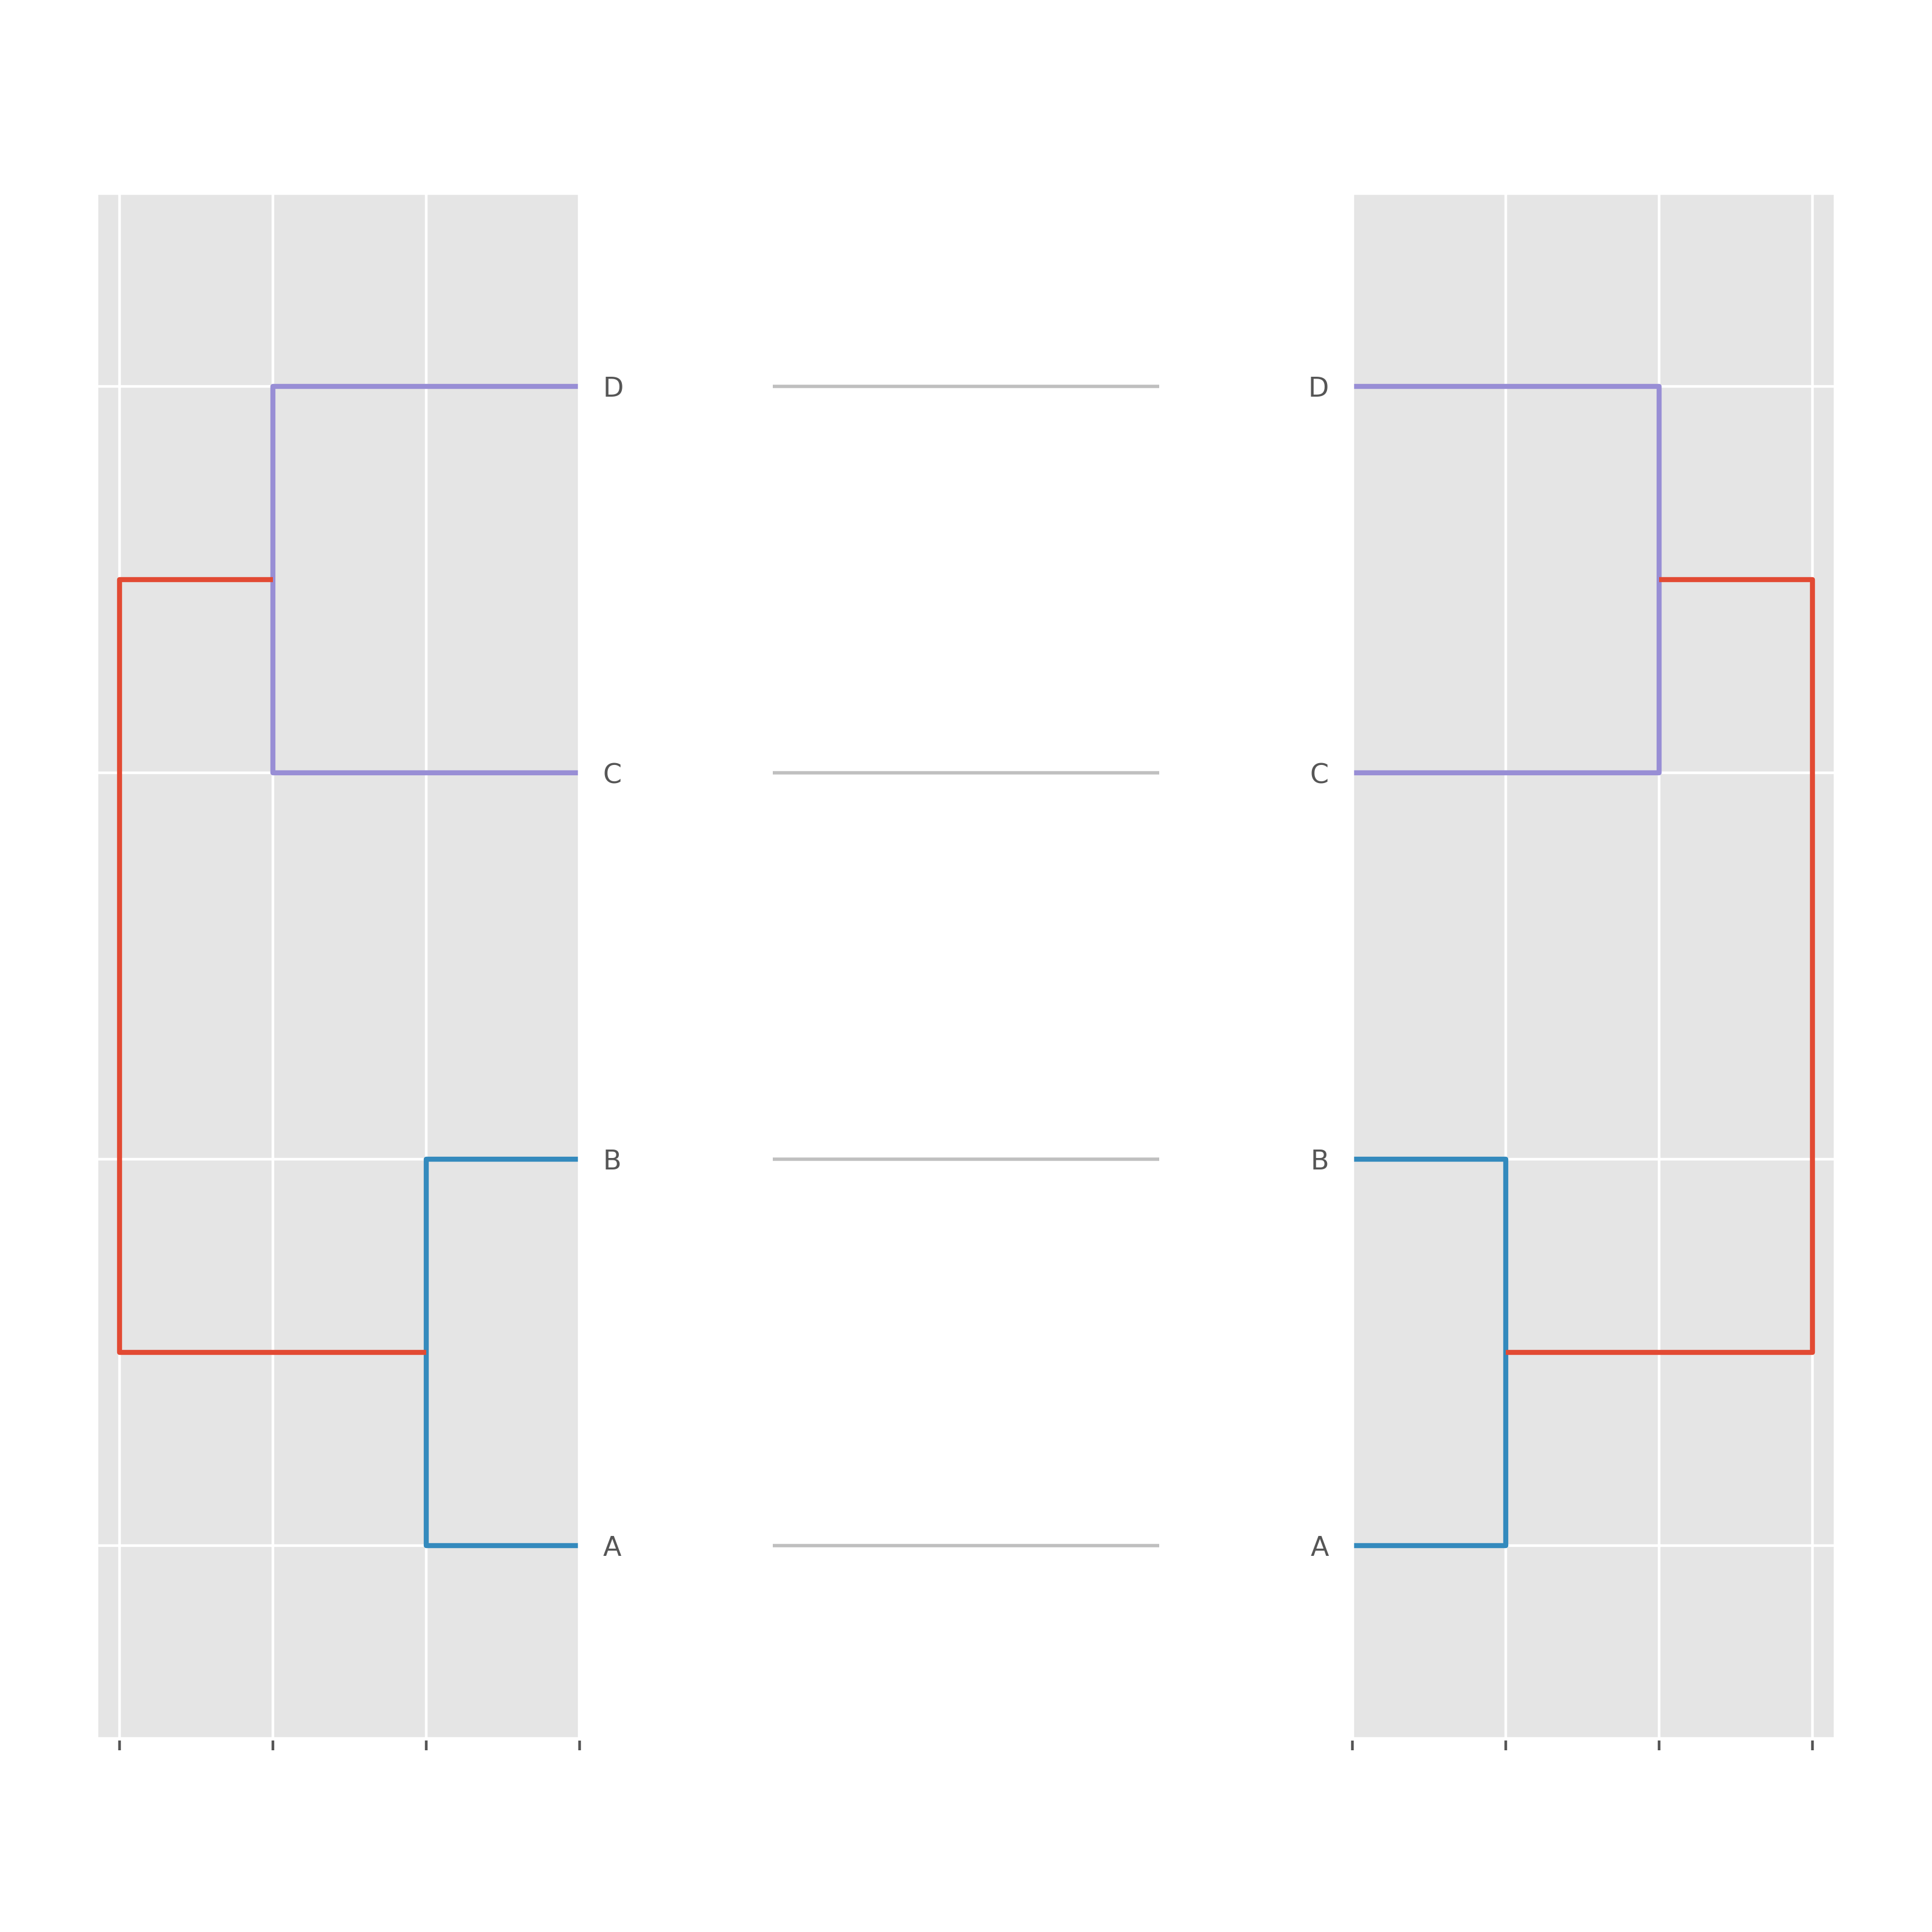
# Plot again but this time try minimizing cross-over
fig = tg.plot(mat1, mat2, sort=True)
plt.show()
Known Issues:
- layout does not scale well, i.e. small dendrograms look weird
License:
This code is under GNU GPL V3


Download files
Download the file for your platform. If you're not sure which to choose, learn more about installing packages.
Source Distribution
Built Distribution
Filter files by name, interpreter, ABI, and platform.
If you're not sure about the file name format, learn more about wheel file names.
Copy a direct link to the current filters
File details
Details for the file tanglegram-0.2.0.tar.gz.
File metadata
- Download URL: tanglegram-0.2.0.tar.gz
- Upload date:
- Size: 22.9 kB
- Tags: Source
- Uploaded using Trusted Publishing? No
- Uploaded via: twine/3.5.0 importlib_metadata/4.8.1 pkginfo/1.7.1 requests/2.26.0 requests-toolbelt/0.9.1 tqdm/4.62.3 CPython/3.9.7
File hashes
| Algorithm | Hash digest | |
|---|---|---|
| SHA256 |
8e170cd0c4150208019dced4130ed4f9a7481174d3ed0b7f0cb48fcb14ff2e90
|
|
| MD5 |
48b8582ec559cac78d8ef6085fe42e95
|
|
| BLAKE2b-256 |
5d5f767c486efd8e4f933149327545d9d7ade6c3a918a133292d860d232f896a
|
File details
Details for the file tanglegram-0.2.0-py3-none-any.whl.
File metadata
- Download URL: tanglegram-0.2.0-py3-none-any.whl
- Upload date:
- Size: 22.7 kB
- Tags: Python 3
- Uploaded using Trusted Publishing? No
- Uploaded via: twine/3.5.0 importlib_metadata/4.8.1 pkginfo/1.7.1 requests/2.26.0 requests-toolbelt/0.9.1 tqdm/4.62.3 CPython/3.9.7
File hashes
| Algorithm | Hash digest | |
|---|---|---|
| SHA256 |
b94fd9a23028e671dc5c1f9d98ef534c6301e5f52ac52584efeb197f0ea80c24
|
|
| MD5 |
c330cf0b4ee8fb3f1d801a62ce025c8d
|
|
| BLAKE2b-256 |
76cfbe88160f0dd4f452ca68045ac08f8c2c5135c4a03fb2870a8a776971e9ac
|


