A python package to visualize npath outputs in python and much more ...
Project description
tdnpathviz
tdnpathviz is a Python package that provides a set of convenient functions to generate various types of visualizations directly within a Teradata Vantage database. It leverages the in-database capabilities of Teradata Vantage including path analysis and in-database plotting (TD_PLOT) for Teradata SQLE 17.20 and later versions.
Installation
Install the package via pip:
pip install tdnpathviz
Usage
Here are the available functions in the Vantage Visualizer package:
plot_first_main_paths()create_all_pathes_views()scatter_plot()pair_plot()plot_correlation_heatmap()plotcurves()plotcurvescluster()plot_with_background_image()
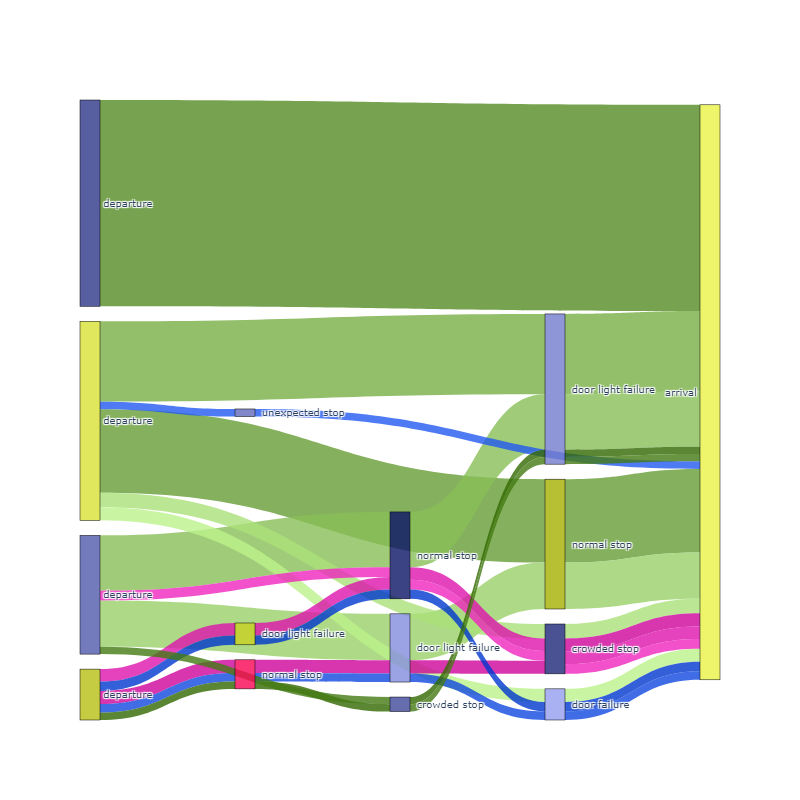
Example: Plotting First Main Paths
Here is an example of how to use the plot_first_main_paths() function:
from tdnpathviz.visualizations import plot_first_main_paths

# Assume 'myPathAnalysis' is your DataFrame which contains path analysis data

plot_first_main_paths(
    myPathAnalysis=myPathAnalysis,
    path_column='your_path_column',
    id_column='your_id_column',
    nb_paths=15,
    print_query=False,
    font_size=10,
    width=1200,
    height=800,
    weight_column = 'your_weight_column',
    weight_agg = 'count',
    justify='left'
)
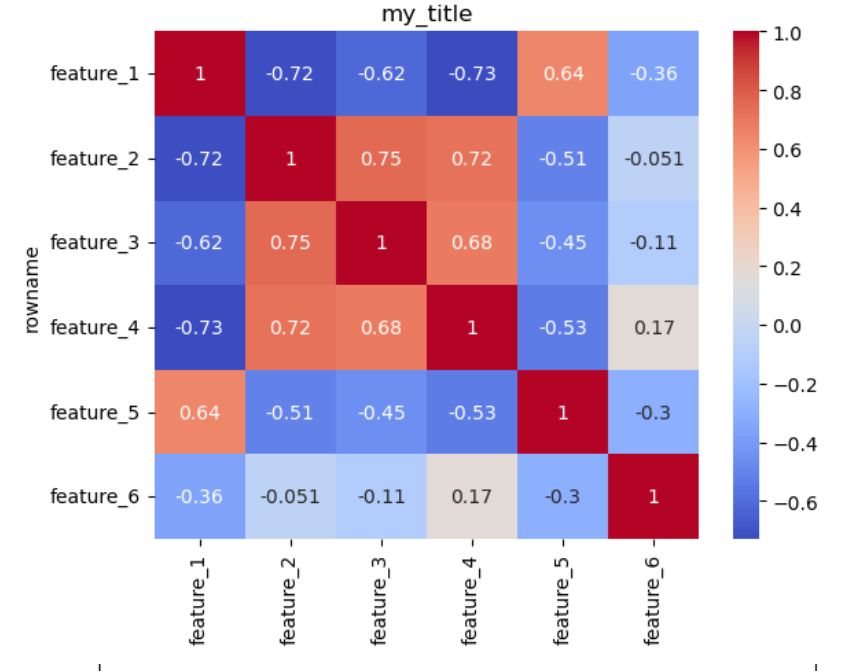
Example: Correlation Heatmap
Here is an example of how to use the plot_correlation_heatmap() function to create a correlation heatmap:
from tdnpathviz.visualizations import plot_correlation_heatmap

# Assume 'tddf' is your teradata DataFrame
plot_correlation_heatmap(tddf)

# You can pass additional parameters, e.g., ax for specific matplotlib axis, no_plot if you don't want to display the plot,
# or a title for your plot.
# plot_correlation_heatmap(tddf, ax=your_matplotlib_axis, no_plot=True, title="My Correlation Heatmap")
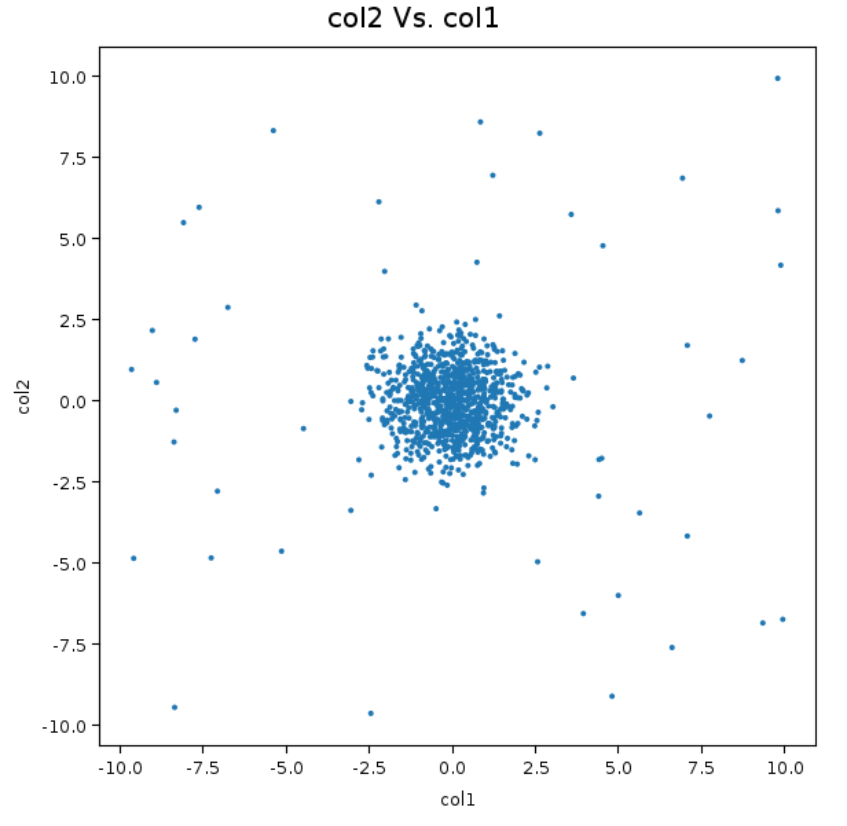
Example: Scatter Plot
Here is an example of how to use the scatter_plot() function:
from tdnpathviz.visualizations import scatter_plot

# Assume 'tddf' is your teradata DataFrame

scatter_plot(
    tddf=tddf,
    x_col='col1',
    y_col='col2'
)
Project details
Release history Release notifications | RSS feed
Download files
Download the file for your platform. If you're not sure which to choose, learn more about installing packages.
Source Distributions
Built Distribution
Hashes for tdnpathviz-0.1.2.23-py3-none-any.whl
| Algorithm | Hash digest | |
|---|---|---|
| SHA256 | 348638b7114a01c9363f5d650280bdd5ccbe011b62916ce488c4337ab6dbfb93 |
|
| MD5 | 10a58c9a73a4fcb08eede6d9df930d84 |
|
| BLAKE2b-256 | 40bf6e1926098146adc0c3e52b91656c5817f809623263e38d317588c873ddde |


