A tool to draw ascii line chart in terminal

Project description
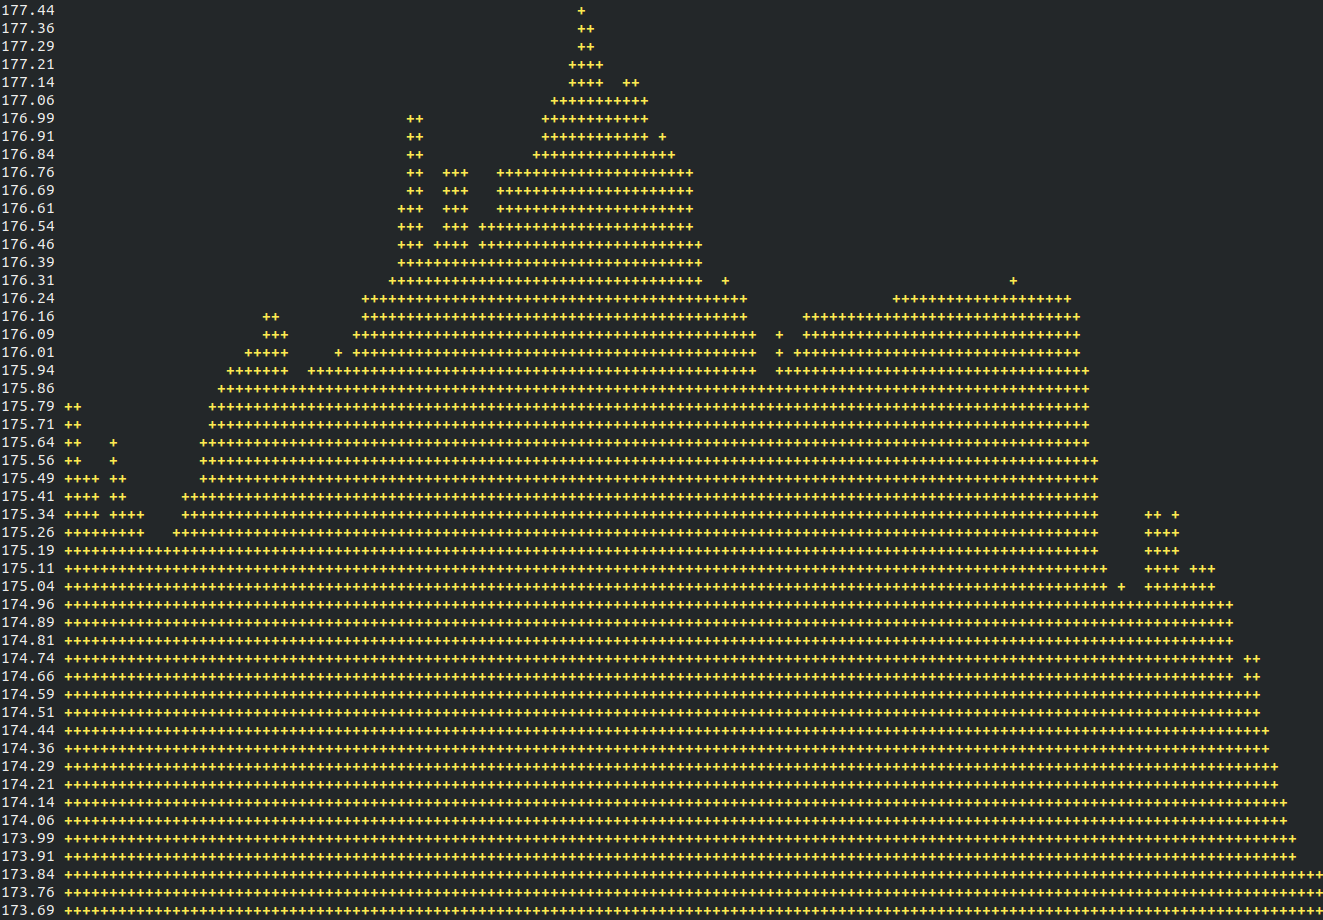
TermChart
Draw ascii line charts in terminal.
Install
pip3 install termchart
USage
Create a Python file :
import termchart

graph = termchart.Graph([1,2,3,2,5,1,-1,-5,-3])
graph.draw()
You can change the plot (default is +):
graph.setDot('|')
Change the width and height (default cols is 160x50)
graph.setCols(200)
graph.setRows(40)
Add values whenever you need it with addData(<Float>). Here is a full example for a live graph with random values :
import termchart
import time
import os
from random import randint

graph = termchart.Graph([])
while True:
    rand = randint(0, 9)
    graph.addData(rand)
    graph.draw()
    time.sleep(1)
    os.system('cls' if os.name == 'nt' else 'clear')
Donate
Release history Release notifications | RSS feed


Download files
Download the file for your platform. If you're not sure which to choose, learn more about installing packages.
Source Distribution
termchart-0.0.4.tar.gz
(2.5 kB
view details)
Built Distribution
Filter files by name, interpreter, ABI, and platform.
If you're not sure about the file name format, learn more about wheel file names.
Copy a direct link to the current filters
File details
Details for the file termchart-0.0.4.tar.gz.
File metadata
- Download URL: termchart-0.0.4.tar.gz
- Upload date:
- Size: 2.5 kB
- Tags: Source
- Uploaded using Trusted Publishing? No
- Uploaded via: twine/1.11.0 pkginfo/1.4.2 requests/2.19.1 setuptools/40.2.0 requests-toolbelt/0.8.0 tqdm/4.26.0 CPython/3.6.5
File hashes
| Algorithm | Hash digest | |
|---|---|---|
| SHA256 |
eea41f61472c8b2b438687e08b12585ea120e21aea39f15a46f0e749044c43e1
|
|
| MD5 |
0e73cf5cbb7797a8be3cceacd5546efd
|
|
| BLAKE2b-256 |
cc408c9ca187e8a145aac8795124517adc7dc576d3dcce218cf714107d9d53d2
|
File details
Details for the file termchart-0.0.4-py2.py3-none-any.whl.
File metadata
- Download URL: termchart-0.0.4-py2.py3-none-any.whl
- Upload date:
- Size: 2.9 kB
- Tags: Python 2, Python 3
- Uploaded using Trusted Publishing? No
- Uploaded via: twine/1.11.0 pkginfo/1.4.2 requests/2.19.1 setuptools/40.2.0 requests-toolbelt/0.8.0 tqdm/4.26.0 CPython/3.6.5
File hashes
| Algorithm | Hash digest | |
|---|---|---|
| SHA256 |
858b948feee7c21f9dda2c63fd820bd55a4d08d34bf45ba2a0f5b99efc873b18
|
|
| MD5 |
74d78732c71a49269f6ac33c04b25fd8
|
|
| BLAKE2b-256 |
84daf92eeb6629af47fc9f322b1585f02e6e63c880c80459e0df1fd89f2f1e88
|


