XANES package
Project description
Presentation of THORONDOR, a program for data analysis and treatment in NEXAFS
Authors : Simonne and Martini
The Program is meant to be imported as a python package, if you download it, please save the THORONDOR folder in ...\Anaconda3\Lib\site-packages
The installation command can be found here : https://pypi.org/project/THORONDOR/ There are two main classes at the core of THORONDOR:
Data should be of the same type, either .txt, .dat or .csv. Please use a comma instead of a dot as decimal separator.
The class Dataset
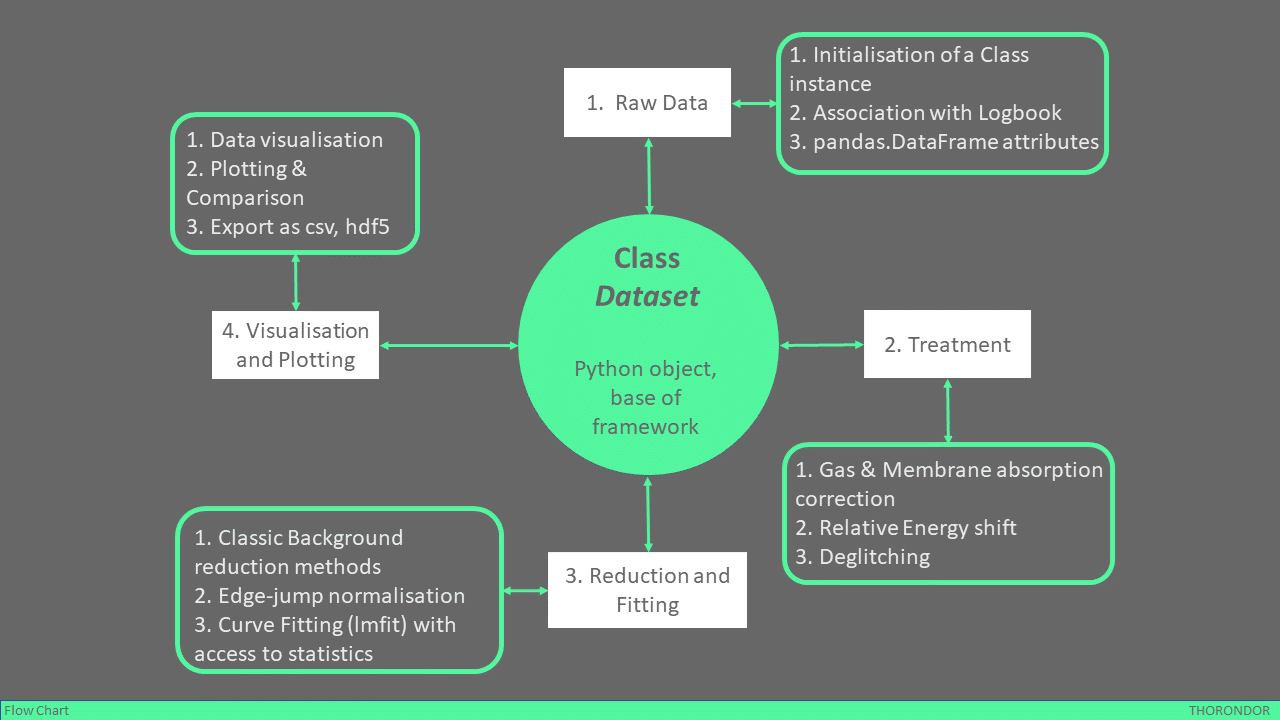
A new instance of the Dataset class will be initialized for each Dataset saved in the data folder. This object is then saved in the list "ClassList", attribute of the second class "GUI". For each Dataset, all the different dataframes that will be created as well as specific information e.g. $E_0$ the edge jump can be find as attributes of this class. Certain attributes are instanced directly with the class, such as:
- Name of Dataset
- Path of original dataset
- Timestamp
At the end of the data reduction, each Dataset should have at least three different data sets as attributes, saved as pandas.DataFrame():
- df : Original data
- ShiftedDf : If one shifts the energy
- ReducedDf : If one applies some background reduction or normalization method
- ReducedDfSplines : If one applied the specific Splines background reduction and normalization method.
A Logbook entry might also be associated, under Dataset.LogbookEntry, this is done via the GUI, the logbook should be in the common excel formats.
It is possible to add commentaries for each Dataset by using the Dataset.Comment() and to specify some additional inf with the function Dataset.AdditionalInfo().
Each Dataset can be retrieved by using the function Dataset.unpickle() with the path of the saved Class as an argument.
The class GUI
This class is a Graphical User Interface (GUI) that is meant to be used to process important amount of XAS datasets, that focus on similar energy range (same nb of points) and absorption edge. There are two ways of initializing the procedure in a jupyter notebook:
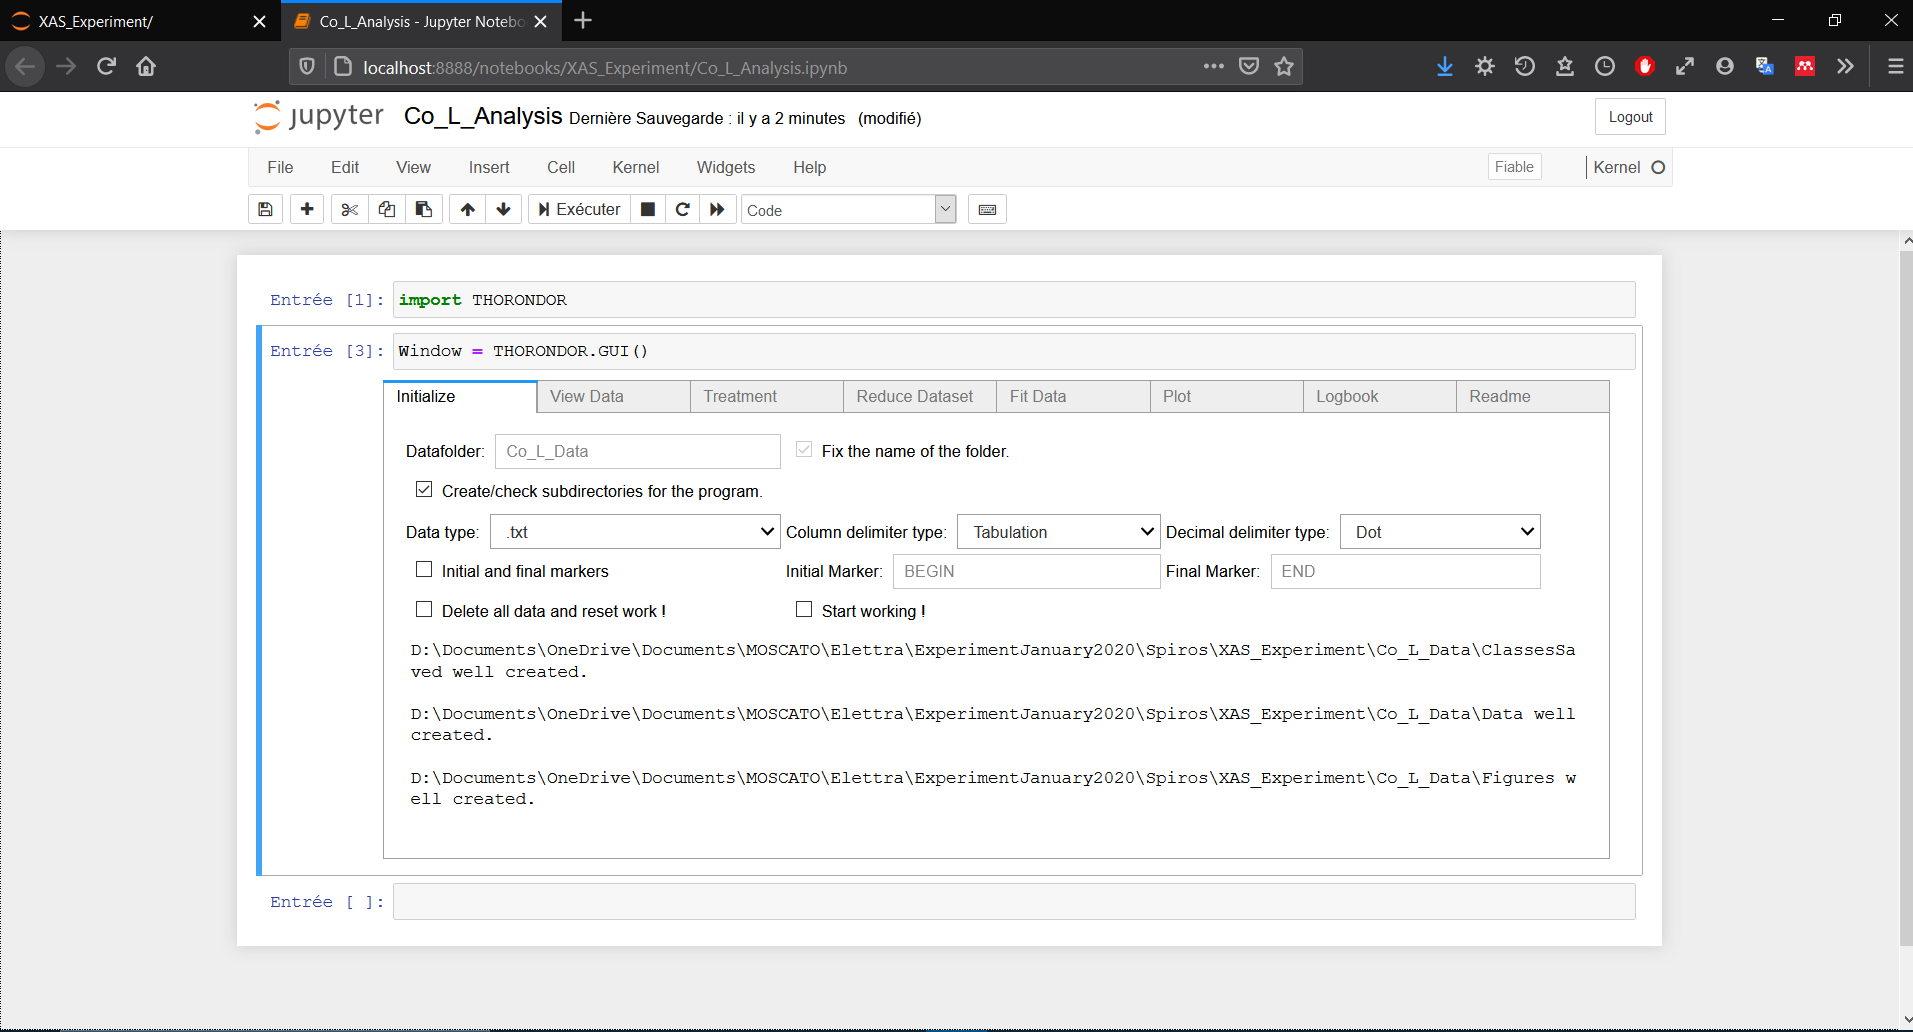
GUI = THORONDOR.GUI(); one will have to write the name of the data folder in which all his raw datasets are saved, in a .txt format.GUI = THORONDOR.GUI.GetClassList(DataFolder = "<yourdatafolder>");if one has already worked on a folder and wishes to retrieve his work.
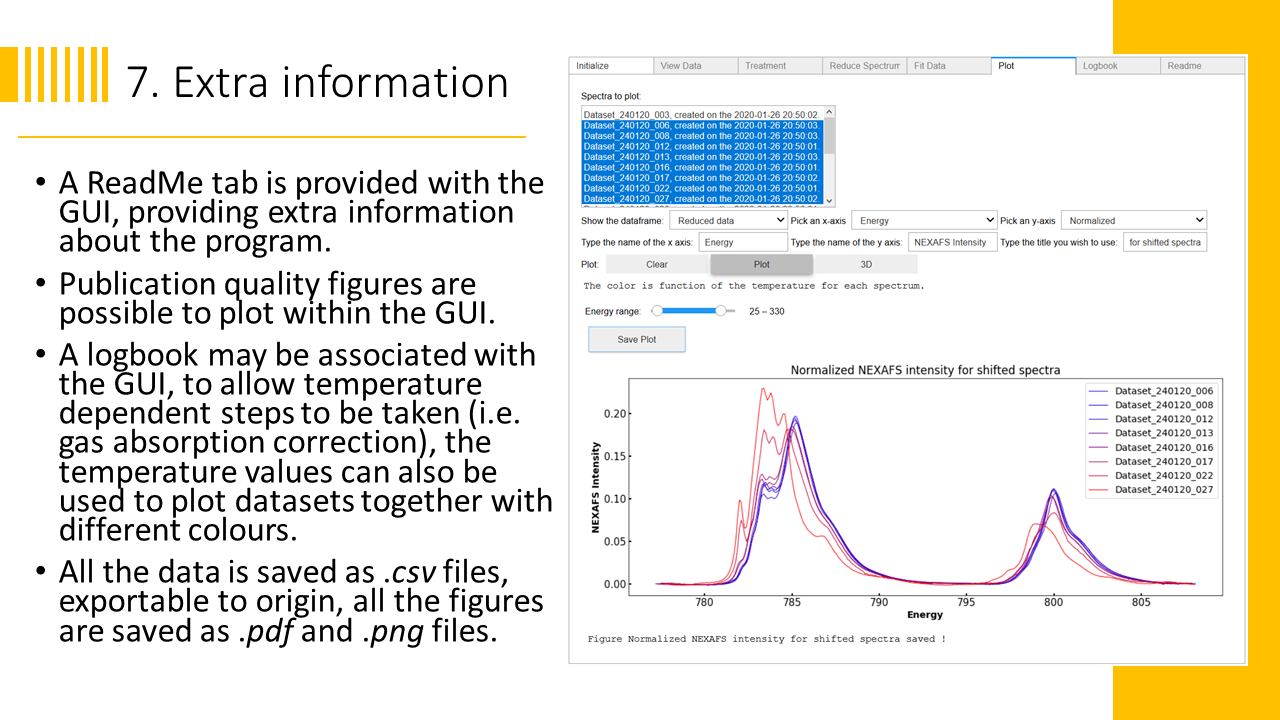
This class makes extensive use of the ipywidgets and is thus meant to be used with a jupyter notebook. Additional informations are provided in the "ReadMe" tab of the GUI.
All the different attributes of this class can also be exported in a single hdf5 file using the pandas .to_hdf5 methods. They should be accessed using the read_hdf methods from pandas.
The necessary Python packages are : numpy, pandas, matplotlib, glob, errno, os, shutil, ipywidgets, IPython, scipy, datetime, importlib, pickle, lmfit, encee and inspect.
FlowChart
Tutorial
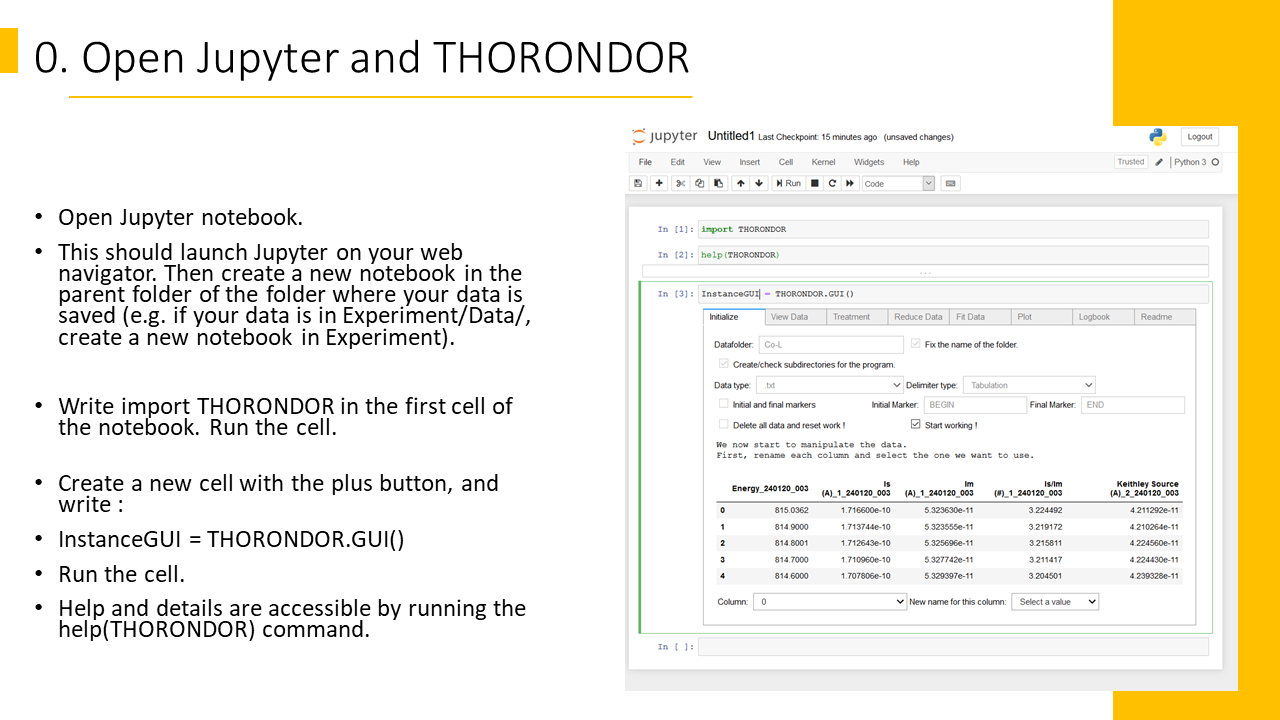
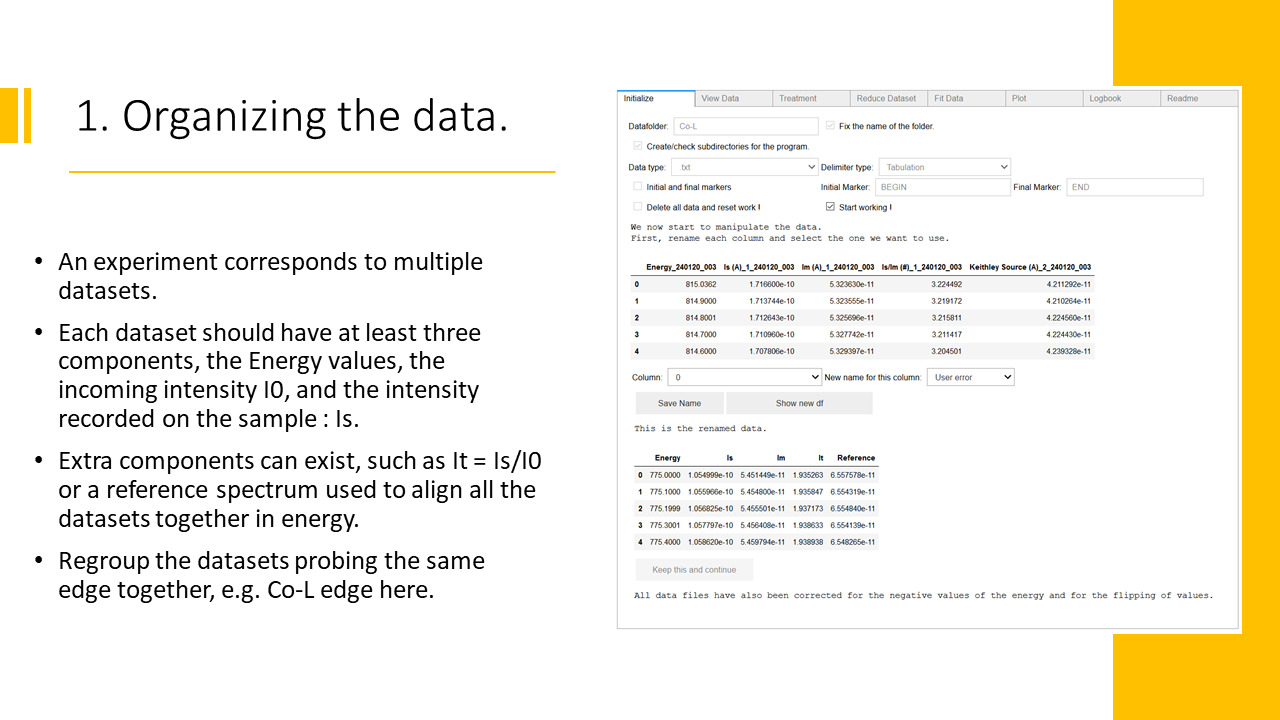
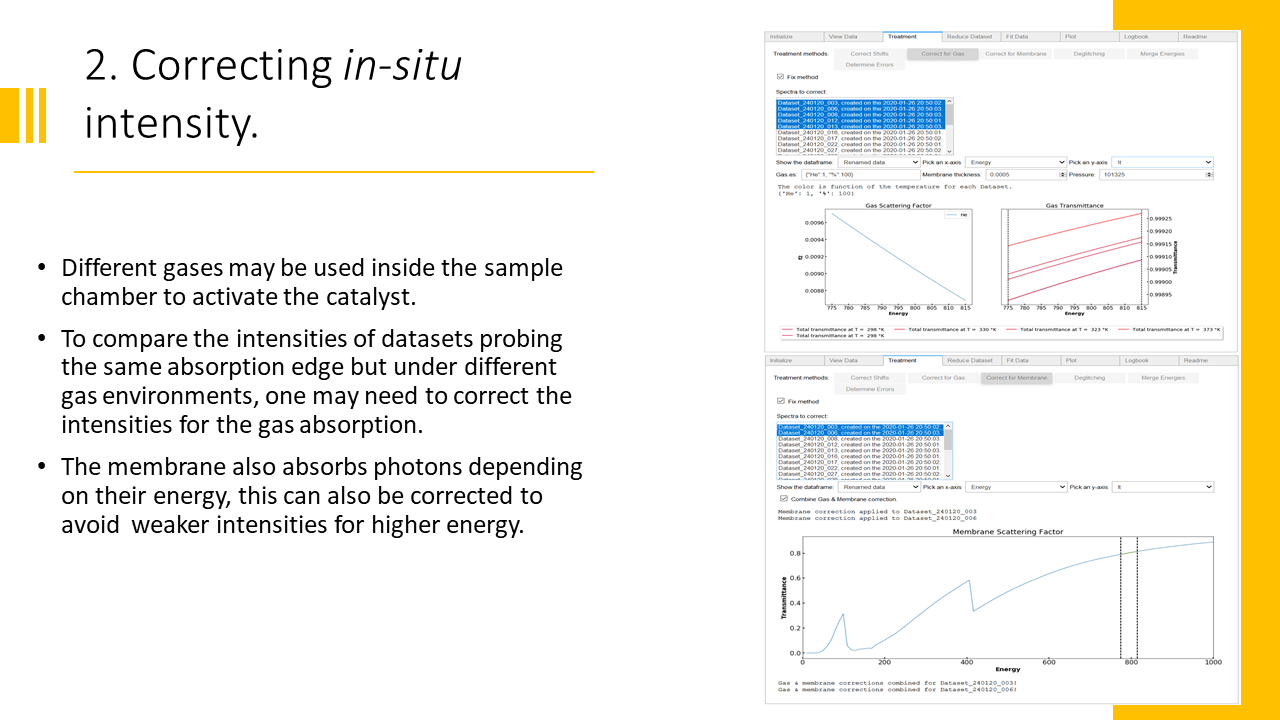
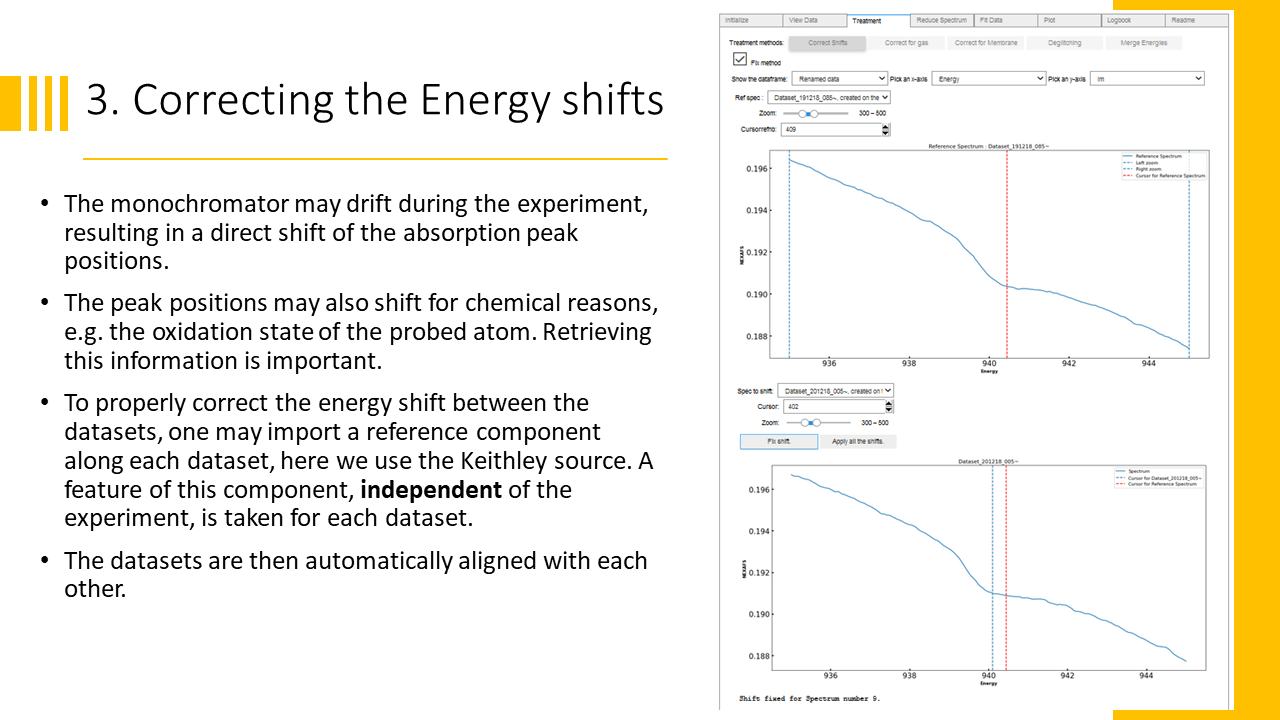
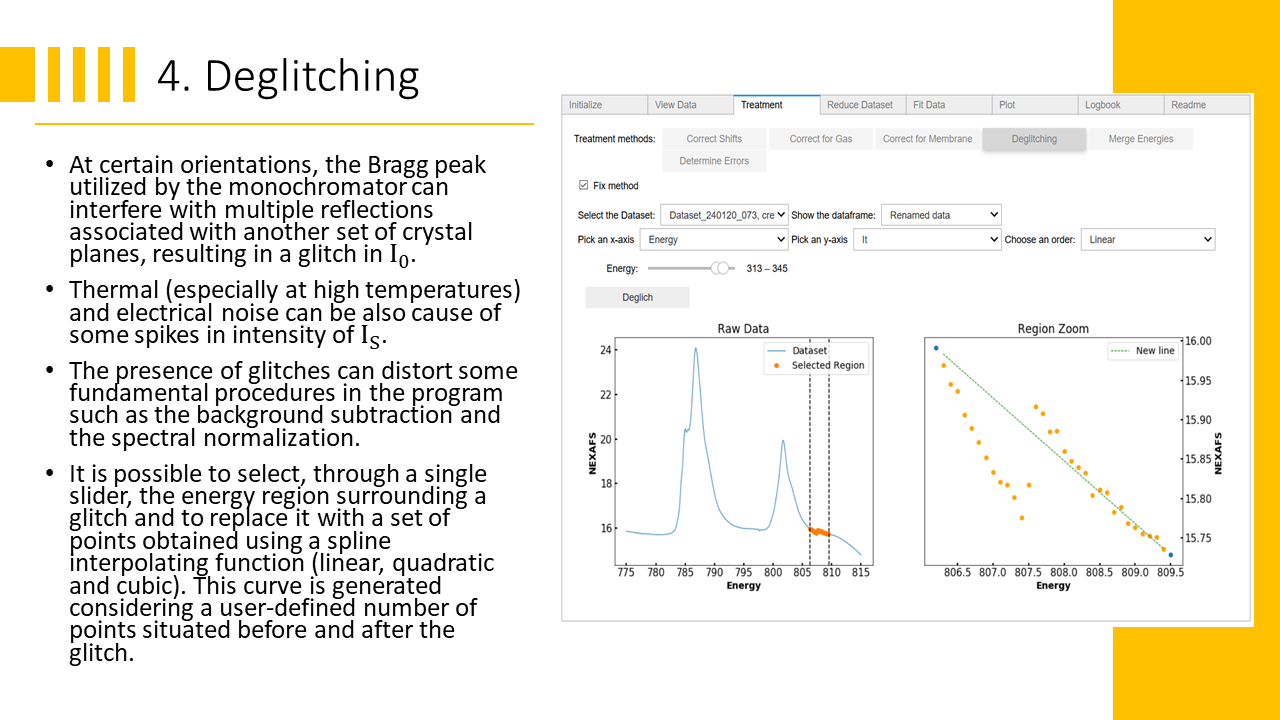
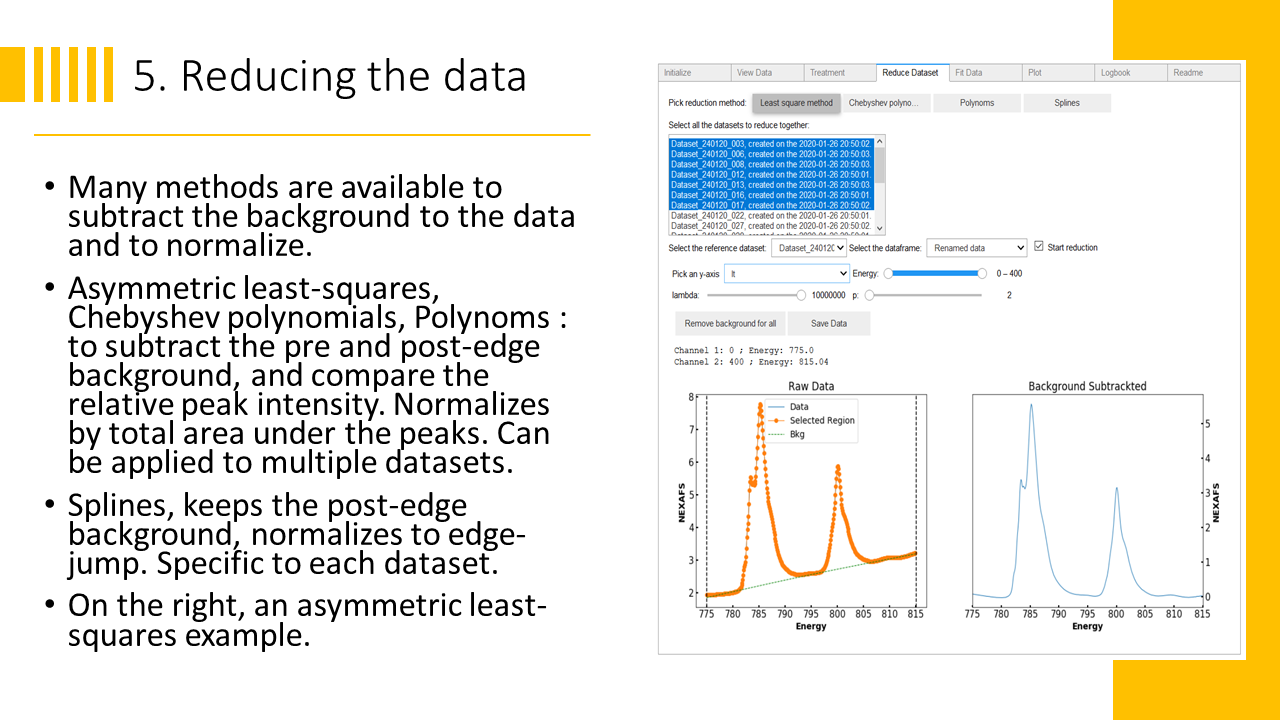
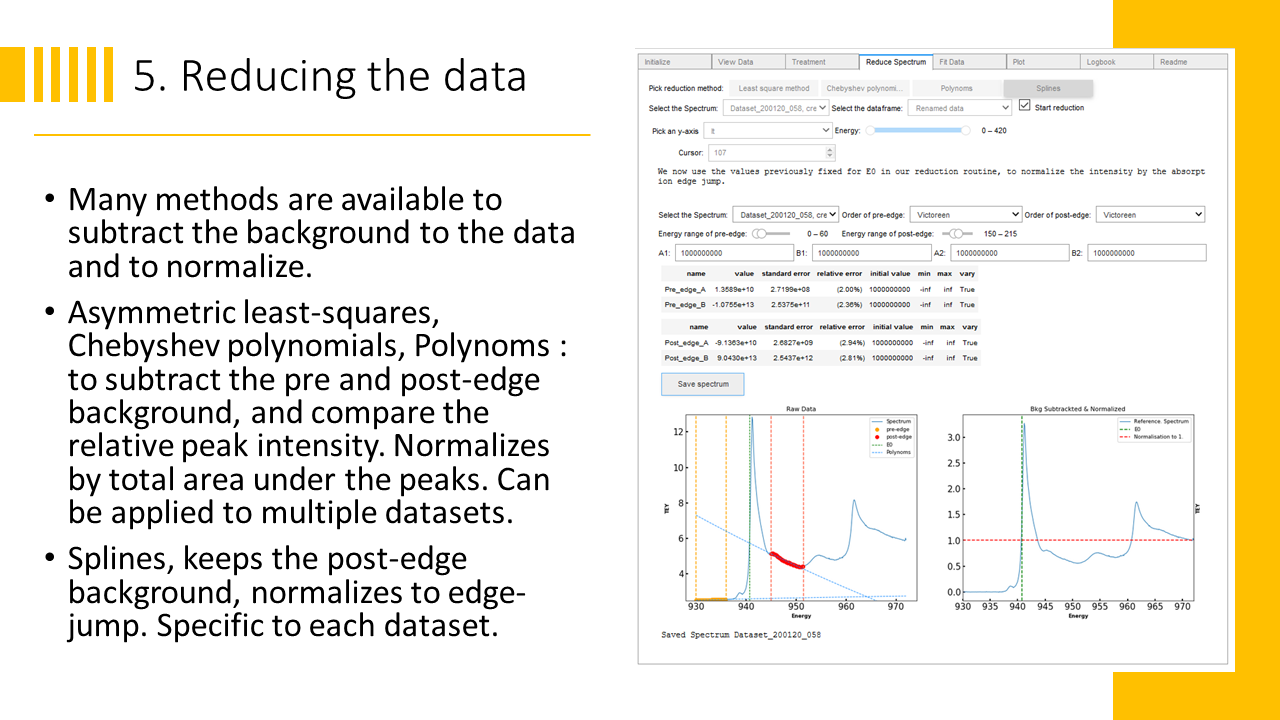
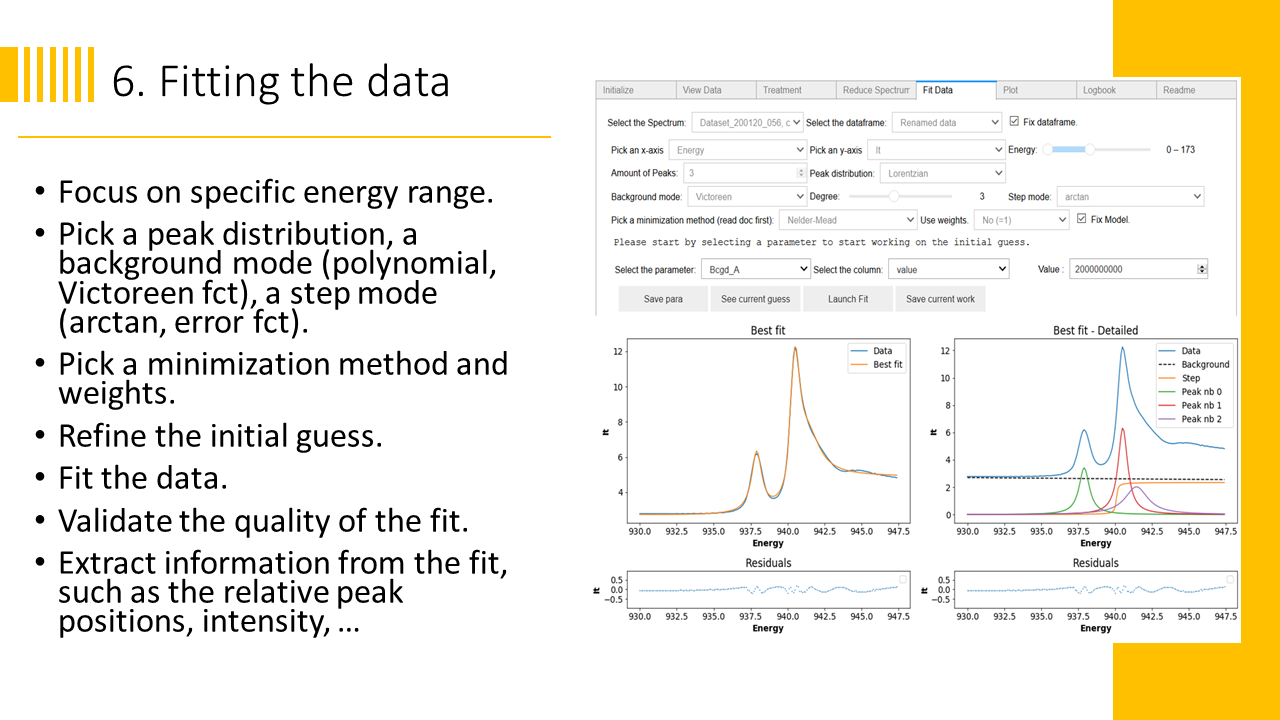
Please follow the following architecture when using the software
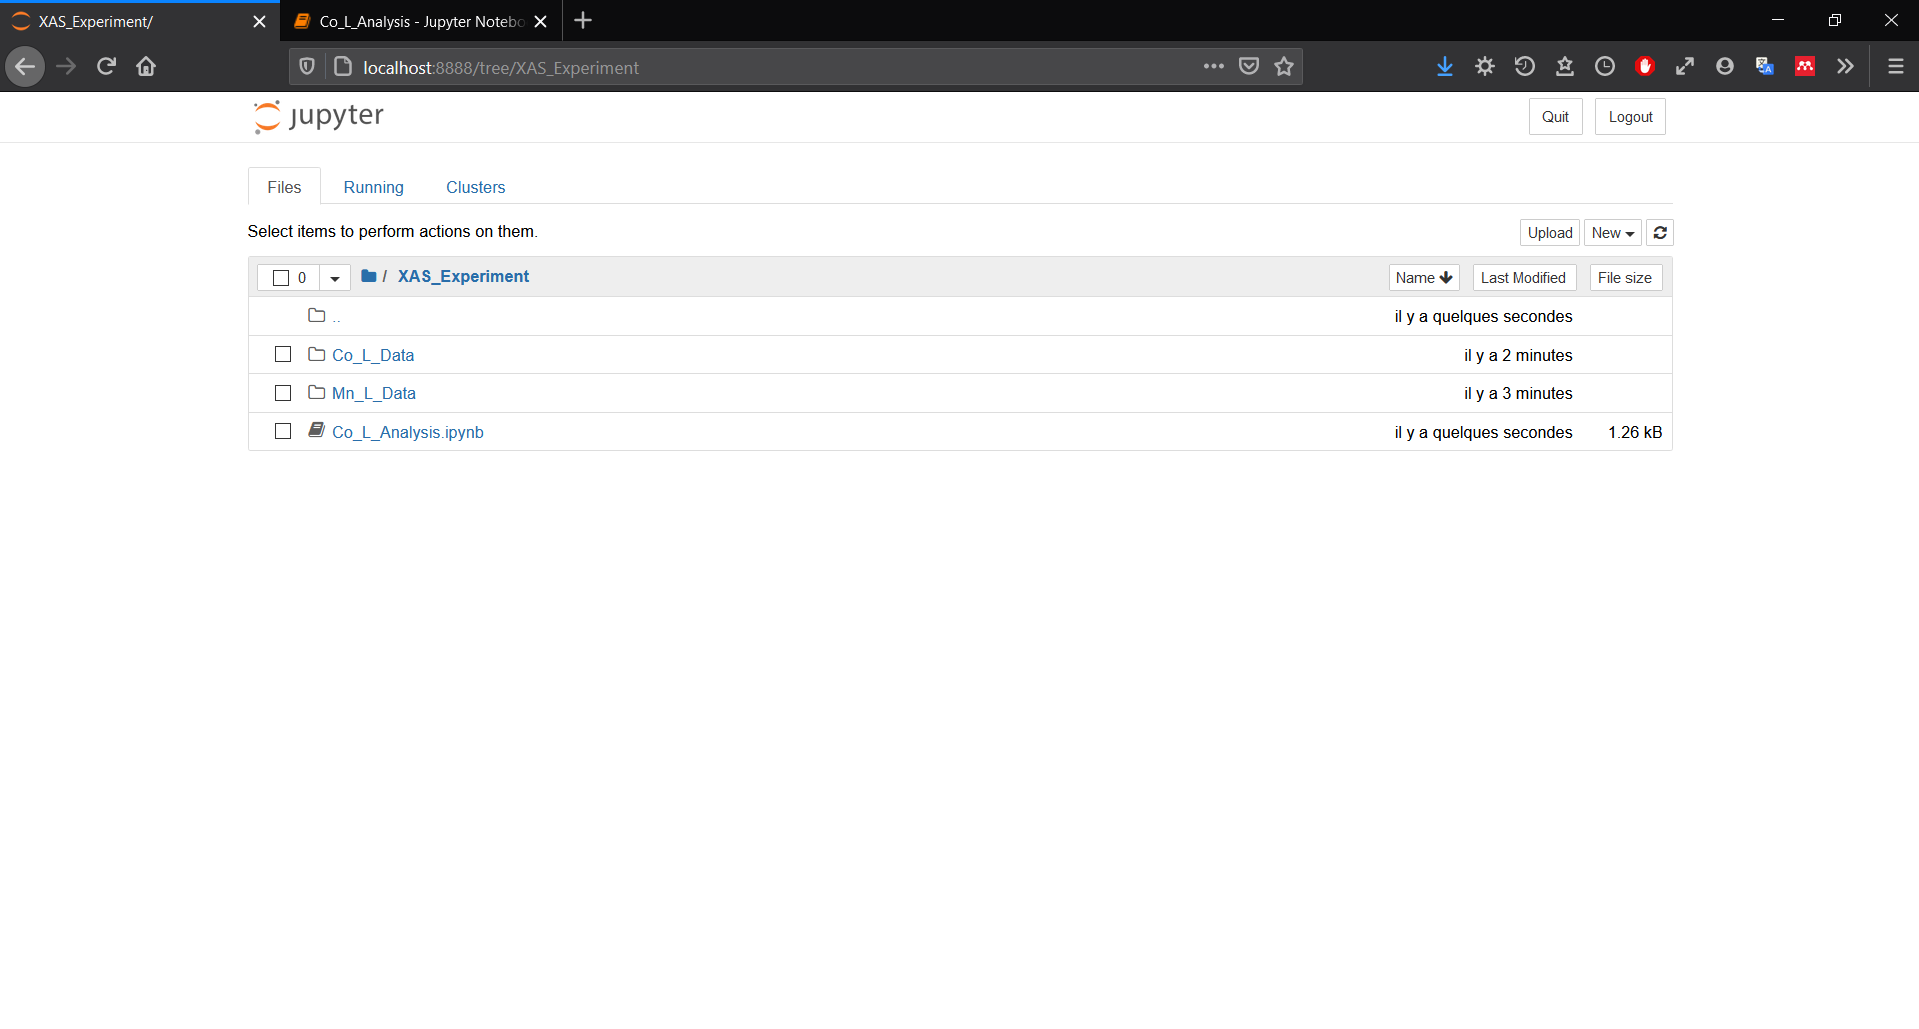
For users on Jupyter Lab, please follow this thread : https://stackoverflow.com/questions/49542417/how-to-get-ipywidgets-working-in-jupyter-lab
Project details
Release history Release notifications | RSS feed
Download files
Download the file for your platform. If you're not sure which to choose, learn more about installing packages.
Source Distribution
Built Distribution
Hashes for THORONDOR-0.2.3.5-py3-none-any.whl
| Algorithm | Hash digest | |
|---|---|---|
| SHA256 | 96d56d154f234a6a9401df720ea352a5cfd89fcbd193b7db63aeea000a0e7faf |
|
| MD5 | 602f83d245319f3d1950ae73d33ec85e |
|
| BLAKE2b-256 | ddefc8ff093461ad3477daa82f1fa6d420d716bc1c49337676162f84e5eac1f5 |


