
tmplot





tmplot is a comprehensive Python package for topic modeling analysis and visualization. Built for data scientists and researchers, it provides powerful interactive reports and advanced analytics that extend beyond traditional LDAvis/pyLDAvis capabilities.
Analyze • Visualize • Compare multiple topic models with ease
Key Features
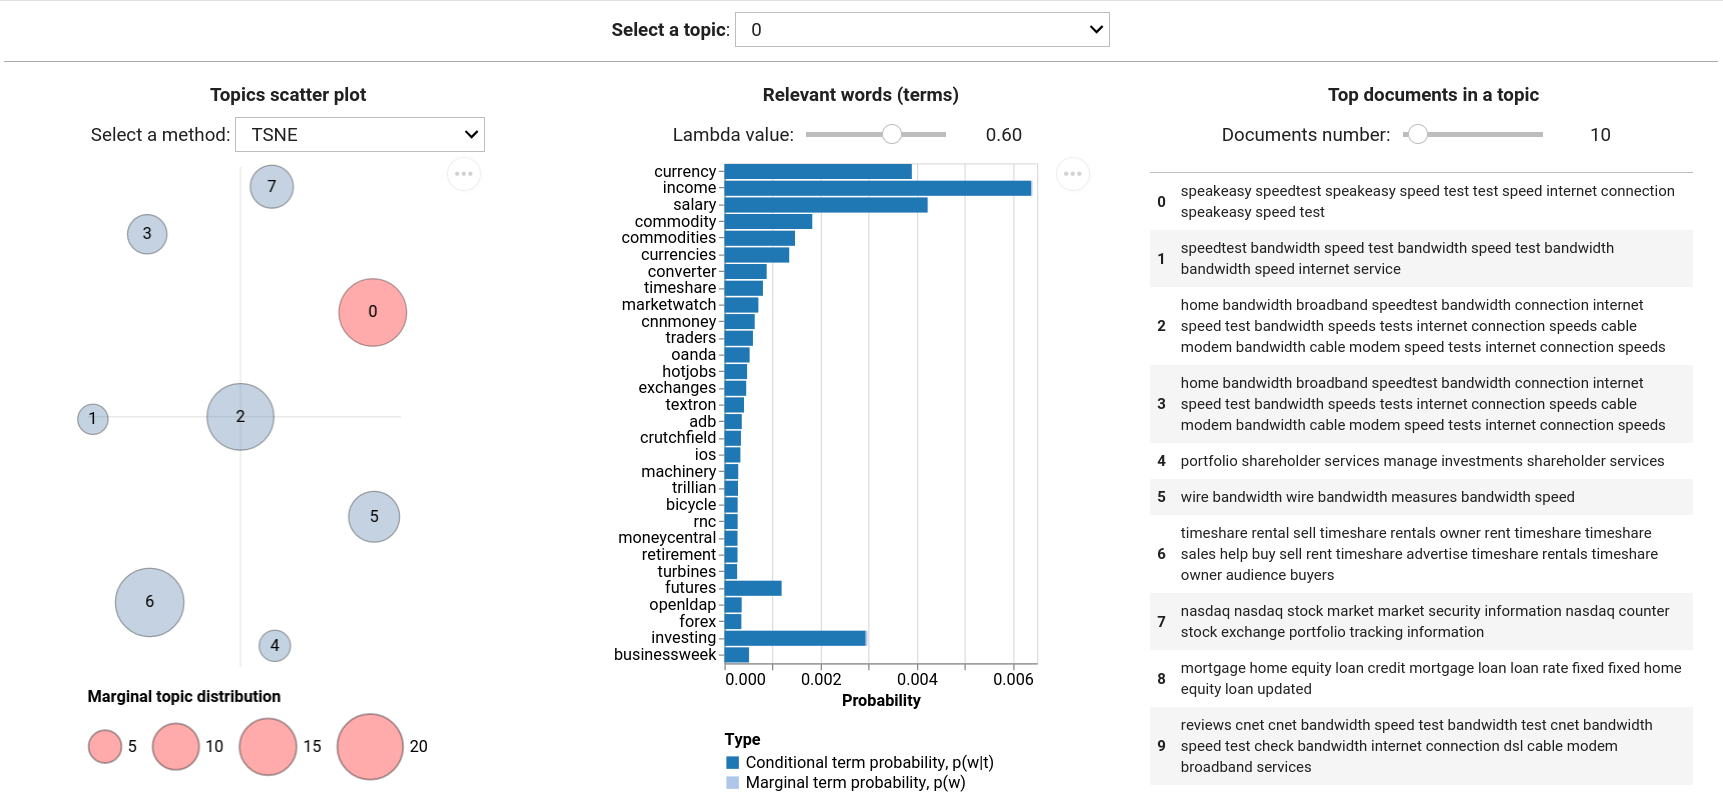
Interactive Visualization
- Topic scatter plots with customizable coordinates and sizing
- Term probability charts with relevance weighting
- Document analysis showing top documents per topic
- Interactive reports with real-time parameter adjustment
Advanced Analytics
- Topic stability analysis across multiple model runs
- Model comparison with sophisticated distance metrics
- Saliency calculations for term importance
- Entropy metrics for model optimization
Model Support
- tomotopy:
LDAModel,LLDAModel,CTModel,DMRModel,HDPModel,PTModel,SLDAModel,GDMRModel - gensim:
LdaModel,LdaMulticore - bitermplus:
BTM
Distance Metrics
- Kullback-Leibler (symmetric & non-symmetric)
- Jensen-Shannon divergence
- Jeffrey's divergence
- Hellinger & Bhattacharyya distances
- Total variation distance
- Jaccard index
Dimensionality Reduction
t-SNE, SpectralEmbedding, MDS, LocallyLinearEmbedding, Isomap
Donate
If you find this package useful, please consider donating any amount of money. This will help me spend more time on supporting open-source software.

Quick Start
Installation
# From PyPI (recommended)
pip install tmplot

# Development version
pip install git+https://github.com/maximtrp/tmplot.git
Basic Usage
import tmplot as tmp

# Load your topic model and documents
model = your_fitted_model  # tomotopy, gensim, or bitermplus
docs = your_documents

# Create interactive report
tmp.report(model, docs=docs)

# Or create individual visualizations
coords = tmp.prepare_coords(model)
tmp.plot_scatter_topics(coords, size_col='size')
Advanced Examples
Get Stable Topics
import tmplot as tmp

# Find stable topics across multiple models
models = [model1, model2, model3, model4]
closest_topics, distances = tmp.get_closest_topics(models)
stable_topics, stable_distances = tmp.get_stable_topics(closest_topics, distances)
Analyze Model
# Calculate entropy for model selection
entropy_score = tmp.entropy(phi_matrix)

# Analyze topic stability
saliency = tmp.get_salient_terms(phi, theta)
Visualize
# Create topic distance matrix with different metrics
topic_dists = tmp.get_topics_dist(phi, method='jsd')

# Generate coordinates with custom algorithm
coords = tmp.get_topics_scatter(topic_dists, theta, method='tsne')
tmp.plot_scatter_topics(coords, topic=3)  # Highlight topic 3
Documentation & Examples
- Complete Tutorial - Step-by-step guide
- API Reference - Full documentation
- Tutorial Notebook - Jupyter walkthrough
Requirements
Core dependencies: numpy, scipy, scikit-learn, pandas, altair, ipywidgets
Optional models: tomotopy, gensim, bitermplus
1 maintainer

Metadata
1 maintainer
Release files for tmplot 0.5.0
For a detailed explanation of source distributions (sdists) and built distributions (wheels), please see the package formats documentation.
Source distribution (sdist)
| File | Size | Uploaded | |
|---|---|---|---|
| tmplot-0.5.0.tar.gz | 27.1 kB | Details |
Built distribution (wheel)
| File | Interpreter | ABI | Platform | Reset |
|---|---|---|---|---|
| tmplot-0.5.0-py3-none-any.whl | Python 3 | none | any | Details |
Total release size: 54.0 kB
Release files / tmplot-0.5.0.tar.gz
| Download URL | tmplot-0.5.0.tar.gz |
|---|---|
| Size | 27.1 kB |
| Tags | Source |
|
SHA-256 checksum How to use checksums |
4f7b05c68d22e11b0cef3251e84299f99c3319221c926248bf5f70f440aaa233
|
|
BLAKE2b-256 checksum How to use checksums |
1b16f384723ef86236b67b3853ca79cd932b0b99872c2a92fad18a593ce71805
|
| Upload date | |
|
Uploaded using Trusted Publishing? What is trusted publishing? |
Yes |
| Uploaded via |
twine/7.0.0 CPython/3.13.14
|
Provenance
Provenance describes where a file came from. On PyPI, provenance is shared via attestations, which provide a verifiable record of the build or publishing details. View details, limitations and caveats.


PyPI Publish Attestation
PyPI verified that this artifact, at this checksum, originated from the publisher listed below.
Signed by GitHub Actions, verified by PyPI on Aug 29, 2026.
Transparency logRelease files / tmplot-0.5.0-py3-none-any.whl
| Download URL | tmplot-0.5.0-py3-none-any.whl |
|---|---|
| Size | 26.9 kB |
| Tags | Python 3 |
|
SHA-256 checksum How to use checksums |
0ace337c8fbe0bd3790de2e5afe6c9582f435c9a55c20541f163ffcad8c21aaa
|
|
BLAKE2b-256 checksum How to use checksums |
61a56802326a7054f2c6786be9cb9c0583374180dd9885a1483cd99c77f3b00b
|
| Upload date | |
|
Uploaded using Trusted Publishing? What is trusted publishing? |
Yes |
| Uploaded via |
twine/7.0.0 CPython/3.13.14
|
Provenance
Provenance describes where a file came from. On PyPI, provenance is shared via attestations, which provide a verifiable record of the build or publishing details. View details, limitations and caveats.
PyPI Publish Attestation
PyPI verified that this artifact, at this checksum, originated from the publisher listed below.
Signed by GitHub Actions, verified by PyPI on Aug 29, 2026.
Transparency log













