Explain your 🤗 transformers without effort! Display the internal behavior of your model.

Project description
Transformers visualizer
Explain your 🤗 transformers without effort!


Transformers visualizer is a python package designed to work with the 🤗 transformers package. Given a model and a tokenizer, this package supports multiple ways to explain your model by plotting its internal behavior.
This package is mostly based on the Captum tutorials [1] [2].
Installation
pip install transformers-visualizer
Quickstart
Let's define a model, a tokenizer and a text input for the following examples.
from transformers import AutoModel, AutoTokenizer

model_name = "bert-base-uncased"
model = AutoModel.from_pretrained(model_name)
tokenizer = AutoTokenizer.from_pretrained(model_name)
text = "The dominant sequence transduction models are based on complex recurrent or convolutional neural networks that include an encoder and a decoder."
Visualizers
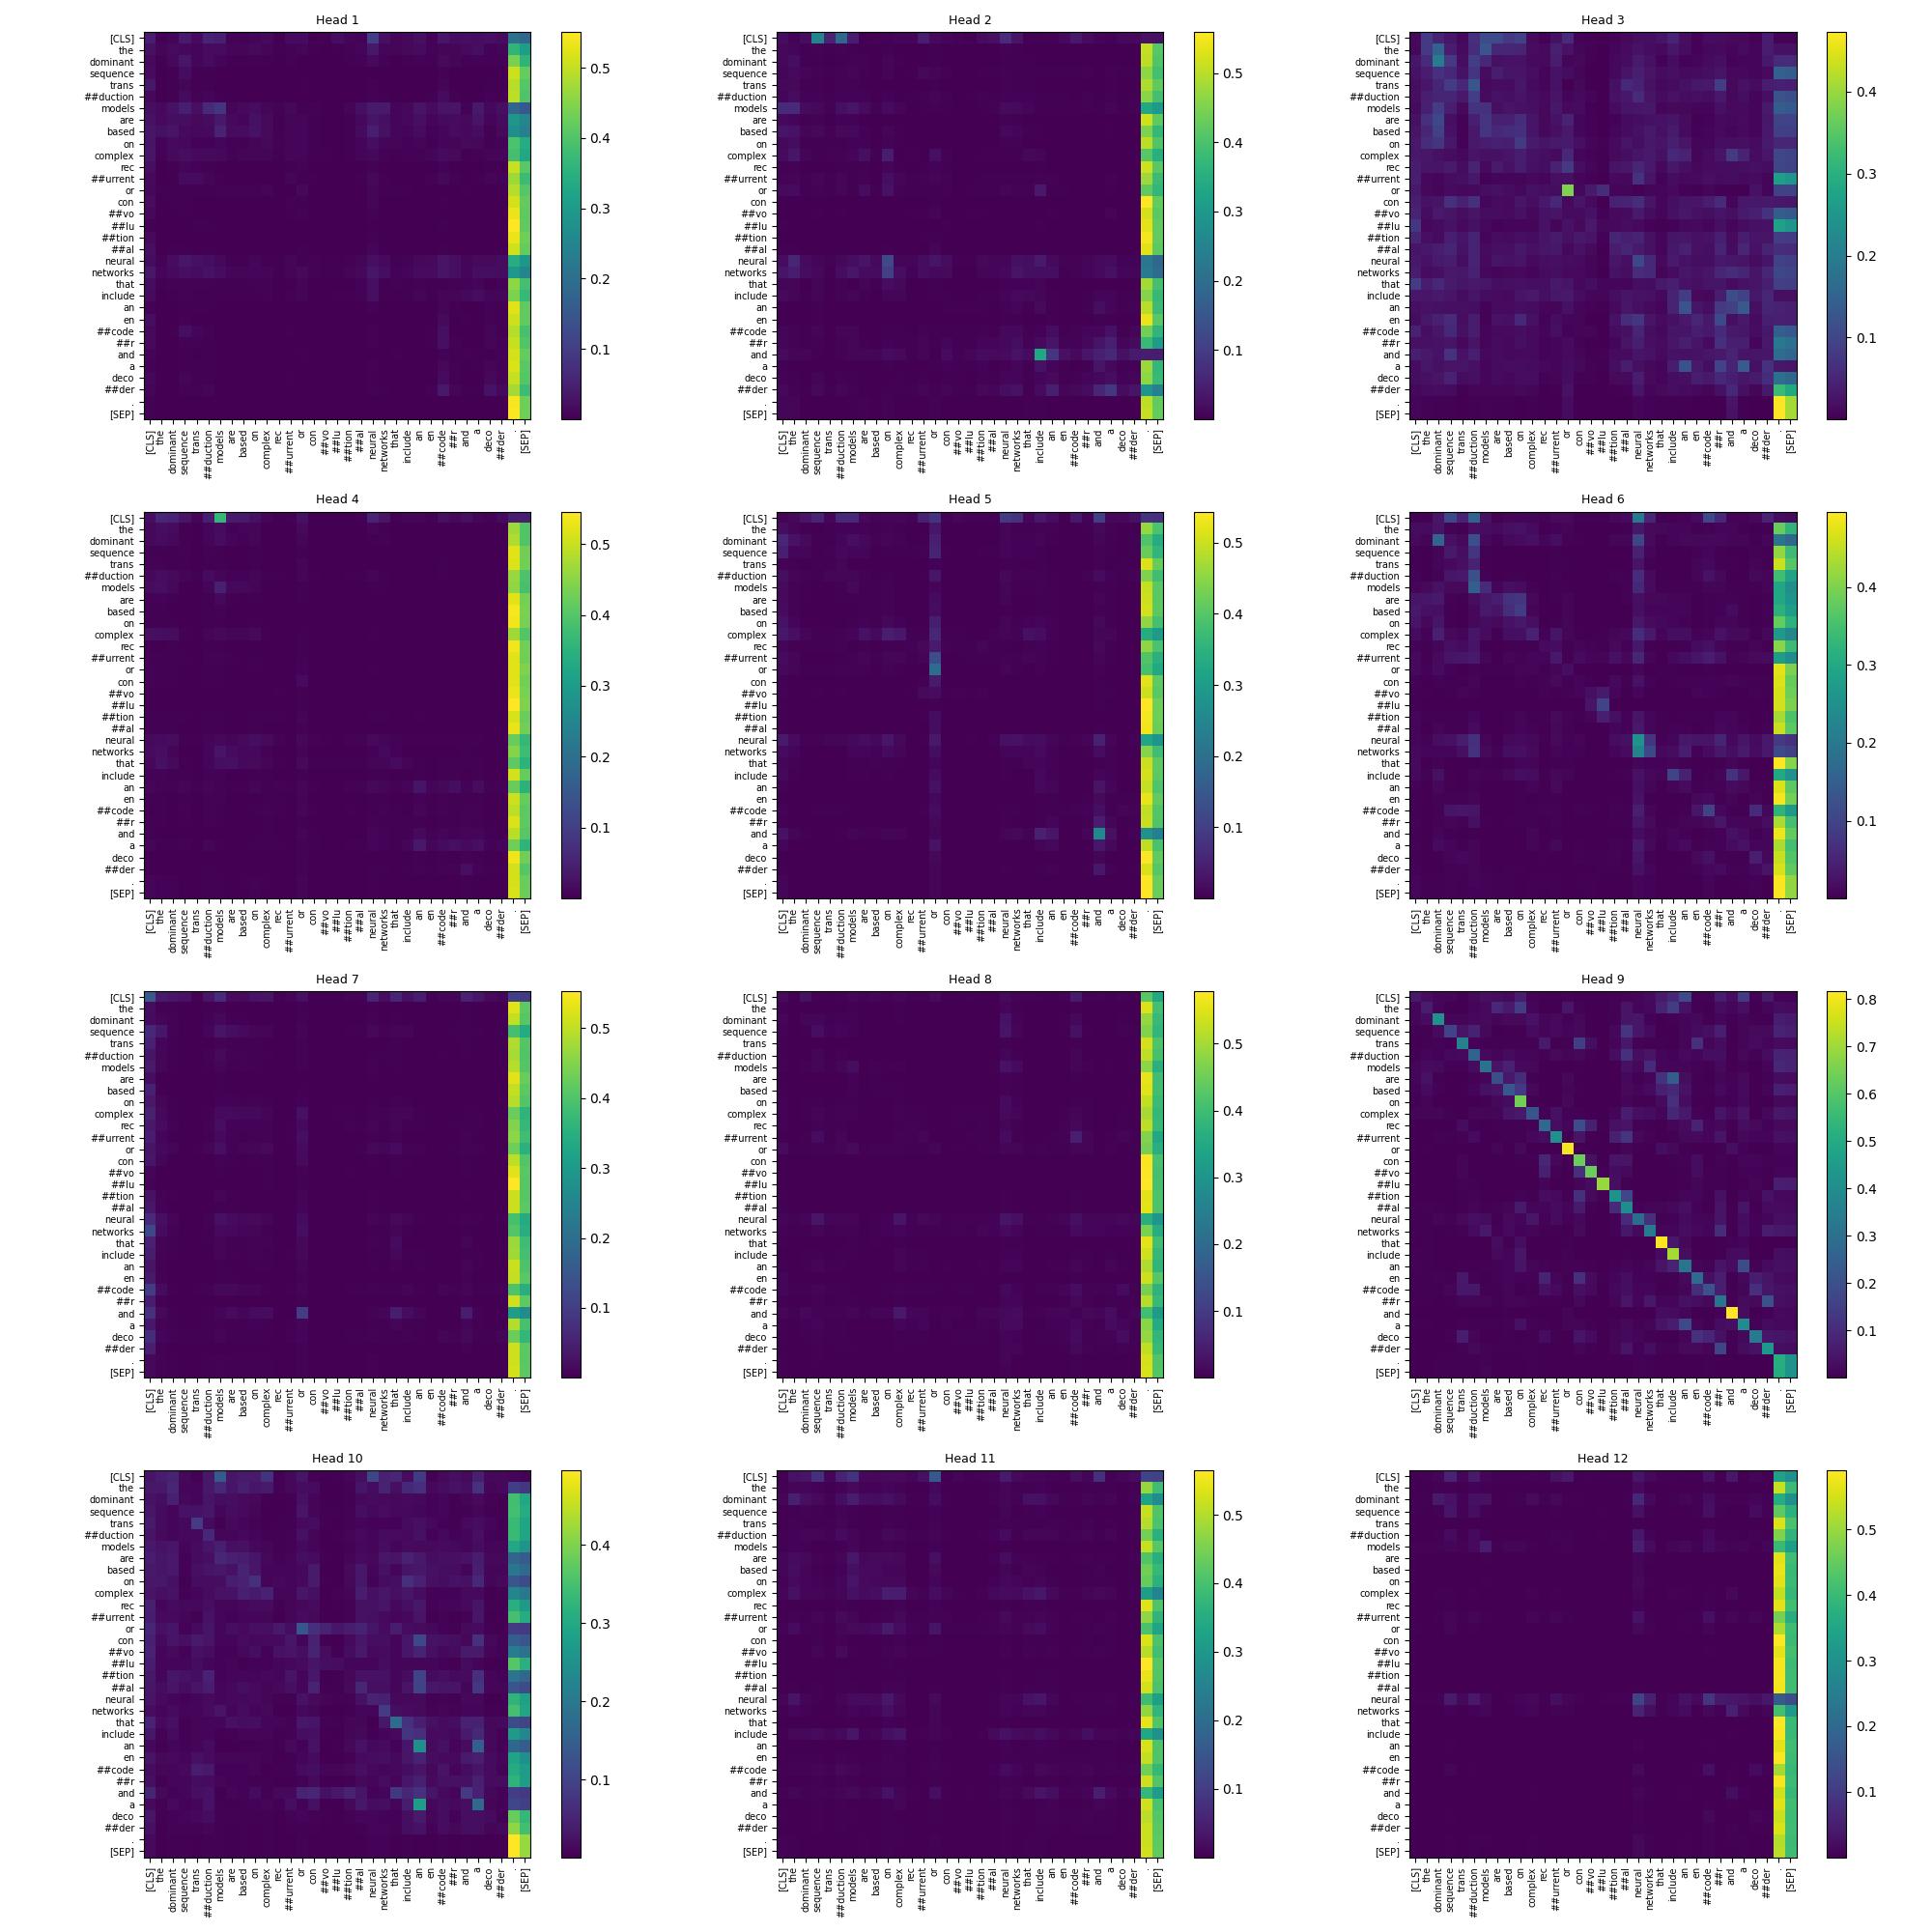
Attention matrices of a specific layer
from transformers_visualizer import TokenToTokenAttentions

visualizer = TokenToTokenAttentions(model, tokenizer)
visualizer(text)
Instead of using __call__ function, you can use the compute method. Both work in place, compute method allows chaining method.
plot method accept a layer index as parameter to specify which part of your model you want to plot. By default, the last layer is plotted.
import matplotlib.pyplot as plt

visualizer.plot(layer_index = 6)
plt.savefig("token_to_token.jpg")
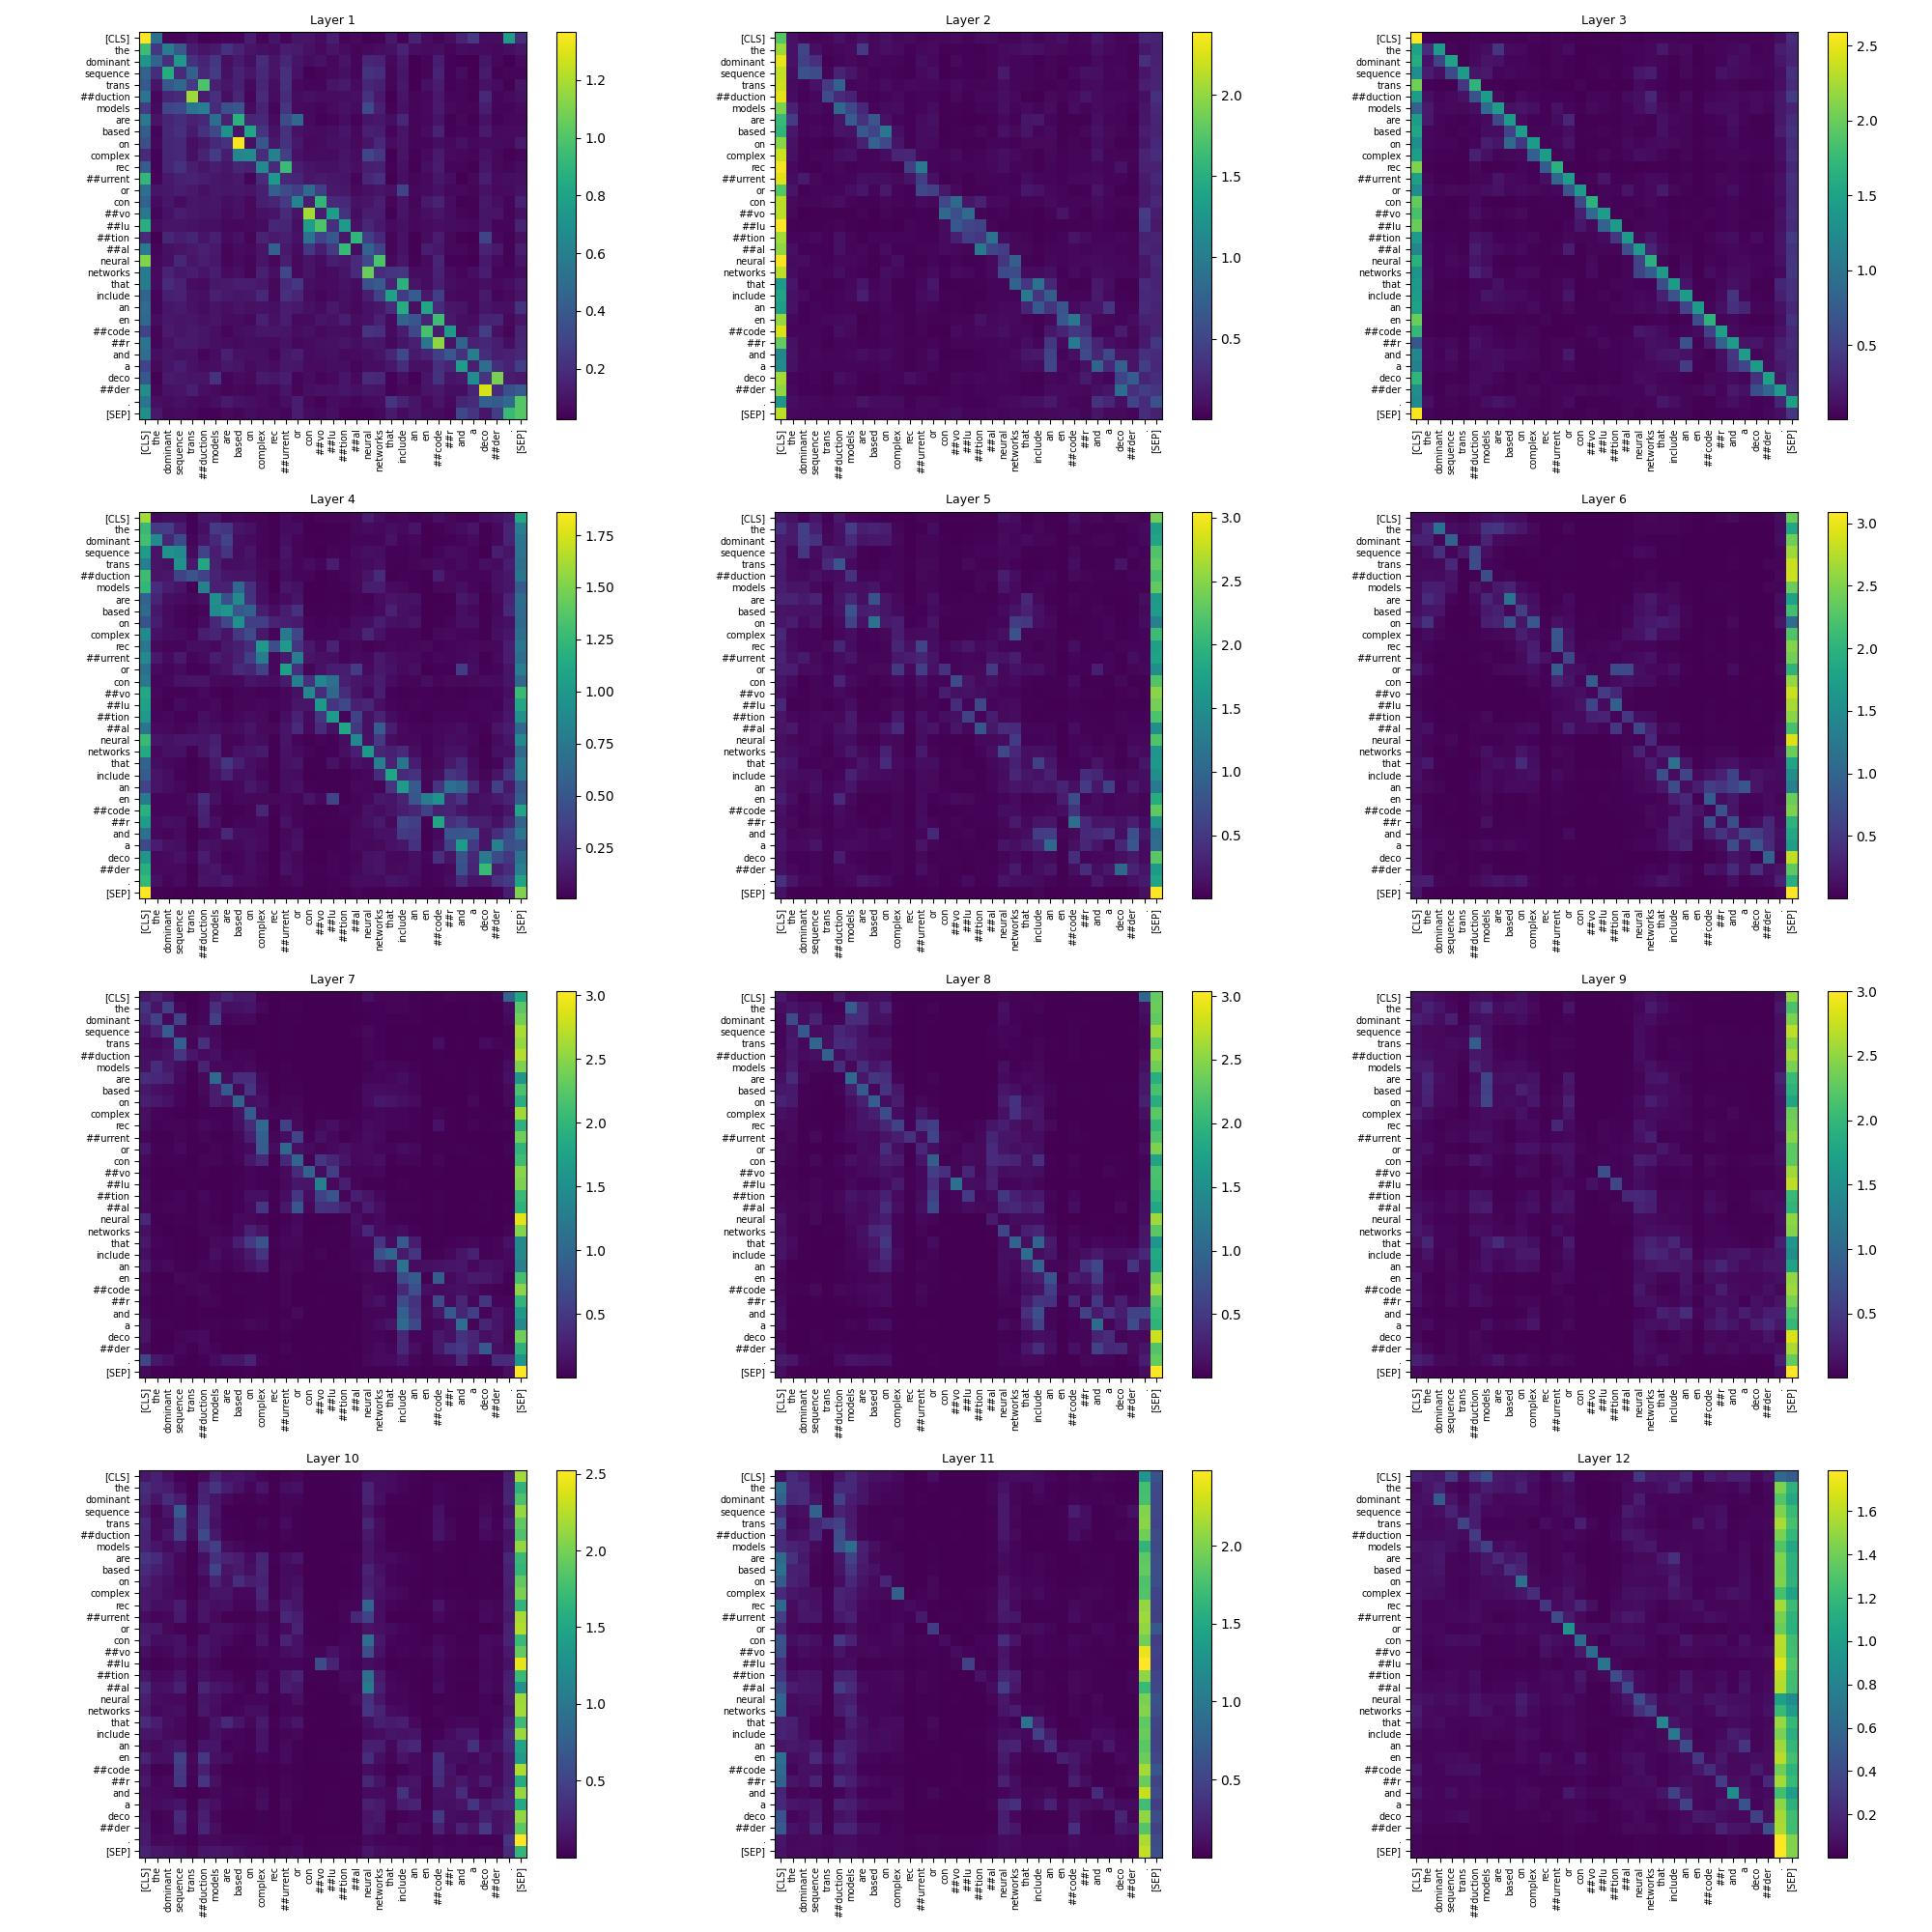
Attention matrices normalized across head axis
You can specify the order used in torch.linalg.norm in __call__ and compute methods. By default, an L2 norm is applied.
from transformers_visualizer import TokenToTokenNormalizedAttentions

visualizer = TokenToTokenNormalizedAttentions(model, tokenizer)
visualizer.compute(text).plot()
Plotting
plot method accept to skip special tokens with the parameter skip_special_tokens, by default it's set to False.
You can use the following imports to use plotting functions directly.
from transformers_visualizer.plotting import plot_token_to_token, plot_token_to_token_specific_dimension
These functions or the plot method of a visualizer can use the following parameters.
figsize (Tuple[int, int]): Figsize of the plot. Defaults to (20, 20).ticks_fontsize (int): Ticks fontsize. Defaults to 7.title_fontsize (int): Title fontsize. Defaults to 9.cmap (str): Colormap. Defaults to "viridis".colorbar (bool): Display colorbars. Defaults to True.
Upcoming features
- Add an option to mask special tokens.
- Add an option to specify head/layer indices to plot.
- Add other plotting backends such as Plotly, Bokeh, Altair.
- Implement other visualizers such as vector norm.
References
Acknowledgements
- Transformers Interpret for the idea of this project.
Release history Release notifications | RSS feed


Download files
Download the file for your platform. If you're not sure which to choose, learn more about installing packages.
Source Distribution
Built Distribution
Filter files by name, interpreter, ABI, and platform.
If you're not sure about the file name format, learn more about wheel file names.
Copy a direct link to the current filters
File details
Details for the file transformers_visualizer-0.2.2.tar.gz.
File metadata
- Download URL: transformers_visualizer-0.2.2.tar.gz
- Upload date:
- Size: 12.9 kB
- Tags: Source
- Uploaded using Trusted Publishing? No
- Uploaded via: poetry/1.3.1 CPython/3.10.9 Linux/5.15.0-1024-azure
File hashes
| Algorithm | Hash digest | |
|---|---|---|
| SHA256 |
e2edde56840dbebc8345c06906f8c17f3a66bb4b8512434bffa793ee77af6cd8
|
|
| MD5 |
3b9e1df6dfe6d8231d8c9b34457fb2e0
|
|
| BLAKE2b-256 |
ff3e5b9dd78e650e05a019f523a06c5fa4962efa976d8f9e42d6f83a6c1e200c
|
File details
Details for the file transformers_visualizer-0.2.2-py3-none-any.whl.
File metadata
- Download URL: transformers_visualizer-0.2.2-py3-none-any.whl
- Upload date:
- Size: 13.2 kB
- Tags: Python 3
- Uploaded using Trusted Publishing? No
- Uploaded via: poetry/1.3.1 CPython/3.10.9 Linux/5.15.0-1024-azure
File hashes
| Algorithm | Hash digest | |
|---|---|---|
| SHA256 |
854719c59fd5bda5fd014827e6bcb921b2be92ff33e36b9c5df9ae69ad226416
|
|
| MD5 |
695e2bde9418c49f0279bb89c3b6abb4
|
|
| BLAKE2b-256 |
05f177d72d5d6c1e1e3a2998b39cf89c1c92a33ac770e91b48ef64645fdc4d69
|


