Python client for Twelve Data

Project description


Twelve Data Python Client for financial API & WebSocket
Official python library for Twelve Data. This package supports all main features of the service:
- Get stock, forex, cryptocurrency, ETF, and index OHLC time series.
- Companies' profiles, financials, and much more fundamentals data.
- Get over 100+ technical indicators.
- Output data as:
json,csv,pandas - Full support for static and dynamic charts.
- Real-time WebSocket data stream.
API key is required. If you don't have it yet, get it by signing up here.
Installation
Use the package manager pip to install Twelve Data API library (without optional dependencies):
pip install twelvedata
Or install with pandas support:
pip install twelvedata[pandas]
Or install with pandas, matplotlib, plotly, and websocket support:
pip install twelvedata[pandas,matplotlib,plotly,websocket-client]
Usage
Supported parameters
| Parameter | Description | Type | Required |
|---|---|---|---|
| symbol | stock ticker (e.g. AAPL, MSFT); physical currency pair (e.g. EUR/USD, CNY/JPY); digital currency pair (BTC/USD, XRP/ETH) |
string | yes |
| interval | time frame: 1min, 5min, 15min, 30min, 45min, 1h, 2h, 4h, 8h, 1day, 1week, 1month | string | yes |
| apikey | your personal API Key, if you don't have one - get it here | string | yes |
| exchange | if symbol is traded in multiple exchanges specify the desired one, valid for both stocks and cryptocurrencies | string | no |
| mic_code | Market Identifier Code (MIC) under ISO 10383 standard, valid for stocks | string | no |
| country | if symbol is traded in multiple countries specify the desired one, valid for stocks | string | no |
| outputsize | number of data points to retrieve | int | no |
| timezone | timezone at which output datetime will be displayed, supports: UTC, Exchange or according to IANA Time Zone Database |
string | no |
| start_date | start date and time of sampling period, accepts yyyy-MM-dd or yyyy-MM-dd hh:mm:ss format |
string | no |
| end_date | end date and time of sampling period, accepts yyyy-MM-dd or yyyy-MM-dd hh:mm:ss format |
string | no |
| order | sorting order of the time series output, supports desc or asc |
string | no |
| date | Could be the exact date, e.g. 2021-10-27, or in human language today or yesterday |
string | no |
The basis for all methods is the TDClient object that takes the required apikey parameter.
Time series
TDClient.time_series()accepts all common parameters. Time series may be converted to several formats:ts.as_json()- will return JSON arrayts.as_csv()- will return CSV with headerts.as_pandas()- will return pandas.DataFramets.as_url()- will return list of URLs used
from twelvedata import TDClient

# Initialize client - apikey parameter is requiered
td = TDClient(apikey="YOUR_API_KEY_HERE")

# Construct the necessary time series
ts = td.time_series(
    symbol="AAPL",
    interval="1min",
    outputsize=10,
    timezone="America/New_York",
)

# Returns pandas.DataFrame
ts.as_pandas()
Other core data endpoints:
- Exchange rate -
TDClient.exchange_rate(symbol) - Currency conversion -
TDClient.currency_conversion(symbol, amount) - Quote -
TDClient.quote()takes parameters as.time_series() - Real-time price -
TDClient.price()takes parameters as.time_series() - End of day price -
TDClient.eod()takes parameters as.time_series()
Fundamentals
All fundamentals are supported across global markets. Refer to API documentation here and find out which countries support which fundamentals by visiting this page.
.get_logo(symbol, exchange, country, type).get_profile(symbol, exchange, country, type).get_dividends(symbol, exchange, country, type).get_splits(symbol, exchange, country, type).get_earnings(symbol, exchange, country, type, period, outputsize, start_date, end_date).get_earnings_calendar(symbol, exchange, country, period, start_date, end_date).get_ipo_calendar(symbol, exchange, country, start_date, end_date).get_statistics(symbol, exchange, country, type).get_insider_transactions(symbol, exchange, country, type).get_income_statement(symbol, exchange, country, type, period, start_date, end_date).get_balance_sheet(symbol, exchange, country, type, period, start_date, end_date).get_cash_flow(symbol, exchange, country, type, period, start_date, end_date).get_key_executives(symbol, exchange, country, type).get_institutional_holders(symbol, exchange, country, type).get_fund_holders(symbol, exchange, country, type)
Only JSON format is supported accessible via .as_json()
from twelvedata import TDClient

td = TDClient(apikey="YOUR_API_KEY_HERE")

# Get last dividends for AAPL
dividends = td.get_dividends(
    symbol="AAPL",
).as_json()
Technical indicators
This Python library supports all indicators implemented by Twelve Data. Full list of 100+ technical indicators may be found in API documentation.
- Technical indicators are part of
TDClient.time_series()object. - It shares the universal format
TDClient.time_series().with_{Technical Indicator Name}, e.g..with_bbands(),.with_percent_b(),.with_macd() - Indicator object accepts all parameters according to its specification in API documentation, e.g.
.with_bbands()accepts:series_type,time_period,sd,ma_type. If parameter is not provided it will be set to default value. - Indicators may be used in arbitrary order and conjugated, e.g.
TDClient.time_series().with_aroon().with_adx().with_ema() - By default, technical indicator will output with OHLC values. If you do not need OHLC, specify
TDClient.time_series().without_ohlc()
from twelvedata import TDClient

td = TDClient(apikey="YOUR_API_KEY_HERE")
ts = td.time_series(
    symbol="ETH/BTC",
    exchange="Huobi",
    interval="5min",
    outputsize=22,
    timezone="America/New_York",
)

# Returns: OHLC, BBANDS(close, 20, 2, EMA), PLUS_DI(9), WMA(20), WMA(40)
ts.with_bbands(ma_type="EMA").with_plus_di().with_wma(time_period=20).with_wma(time_period=40).as_pandas()

# Returns: STOCH(14, 1, 3, SMA, SMA), TSF(close, 9)
ts.without_ohlc().with_stoch().with_tsf().as_json()
Batch requests
With batch requests up to 120 symbols might be returned per single API call. There are two options on how to do this:
# 1. Pass instruments symbols as a string delimited by comma (,)
ts = td.time_series(
    symbol="V, RY, AUD/CAD, BTC/USD",
    interval="1day",
)

# 2. Pass as a list of symbols
ts = td.time_series(
    symbol=["V", "RY", "AUD/CAD", "BTC/USD"],
    interval="1day",
)
Important. Batch requests are only supported with .as_json() and .as_pandas() formats.
With .as_json() the output will be a dictionary with passed symbols as keys. The value will be a tuple with quotes, just the same as with a single request.
ts = td.time_series(symbol='AAPL,MSFT', interval="1min", outputsize=3)
df = ts.with_macd().with_macd(fast_period=10).with_stoch().as_json()

{
    "AAPL": ({'datetime': '2020-04-23 15:59:00', 'open': '275.23001', 'high': '275.25000', 'low': '274.92999', 'close': '275.01001', 'volume': '393317', 'macd_1': '-0.33538', 'macd_signal_1': '-0.24294', 'macd_hist_1': '-0.09244', 'macd_2': '-0.40894', 'macd_signal_2': '-0.29719', 'macd_hist_2': '-0.11175', 'slow_k': '4.52069', 'slow_d': '7.92871'}, {'datetime': '2020-04-23 15:58:00', 'open': '275.07001', 'high': '275.26999', 'low': '275.00000', 'close': '275.25000', 'volume': '177685', 'macd_1': '-0.31486', 'macd_signal_1': '-0.21983', 'macd_hist_1': '-0.09503', 'macd_2': '-0.38598', 'macd_signal_2': '-0.26925', 'macd_hist_2': '-0.11672', 'slow_k': '14.70578', 'slow_d': '6.82079'}, {'datetime': '2020-04-23 15:57:00', 'open': '275.07001', 'high': '275.16000', 'low': '275.00000', 'close': '275.07751', 'volume': '151169', 'macd_1': '-0.30852', 'macd_signal_1': '-0.19607', 'macd_hist_1': '-0.11245', 'macd_2': '-0.38293', 'macd_signal_2': '-0.24007', 'macd_hist_2': '-0.14286', 'slow_k': '4.55965', 'slow_d': '2.75237'}),
    "MSFT": ({'datetime': '2020-04-23 15:59:00', 'open': '171.59000', 'high': '171.64000', 'low': '171.22000', 'close': '171.42000', 'volume': '477631', 'macd_1': '-0.12756', 'macd_signal_1': '-0.10878', 'macd_hist_1': '-0.01878', 'macd_2': '-0.15109', 'macd_signal_2': '-0.12915', 'macd_hist_2': '-0.02193', 'slow_k': '20.95244', 'slow_d': '26.34919'}, {'datetime': '2020-04-23 15:58:00', 'open': '171.41000', 'high': '171.61000', 'low': '171.33501', 'close': '171.61000', 'volume': '209594', 'macd_1': '-0.12440', 'macd_signal_1': '-0.10408', 'macd_hist_1': '-0.02032', 'macd_2': '-0.14786', 'macd_signal_2': '-0.12367', 'macd_hist_2': '-0.02419', 'slow_k': '39.04785', 'slow_d': '23.80945'}, {'datetime': '2020-04-23 15:57:00', 'open': '171.34500', 'high': '171.48000', 'low': '171.25999', 'close': '171.39999', 'volume': '142450', 'macd_1': '-0.13791', 'macd_signal_1': '-0.09900', 'macd_hist_1': '-0.03891', 'macd_2': '-0.16800', 'macd_signal_2': '-0.11762', 'macd_hist_2': '-0.05037', 'slow_k': '19.04727', 'slow_d': '14.92063'})
}
With .as_pandas() the output will be a 3D DataFrame with MultiIndex for (symbol, datetime).
ts = td.time_series(symbol='AAPL,MSFT', interval="1min", outputsize=3)
df = ts.with_macd().with_macd(fast_period=10).with_stoch().as_pandas()

#                                open       high  ...    slow_k    slow_d
# AAPL 2020-04-23 15:59:00  275.23001  275.25000  ...   4.52069   7.92871
#      2020-04-23 15:58:00  275.07001  275.26999  ...  14.70578   6.82079
#      2020-04-23 15:57:00  275.07001  275.16000  ...   4.55965   2.75237
# MSFT 2020-04-23 15:59:00  171.59000  171.64000  ...  20.95244  26.34919
#      2020-04-23 15:58:00  171.41000  171.61000  ...  39.04785  23.80945
#      2020-04-23 15:57:00  171.34500  171.48000  ...  19.04727  14.92063
#
# [6 rows x 13 columns]

df.loc['AAPL']

#                           open       high  ...    slow_k   slow_d
# 2020-04-23 15:59:00  275.23001  275.25000  ...   4.52069  7.92871
# 2020-04-23 15:58:00  275.07001  275.26999  ...  14.70578  6.82079
# 2020-04-23 15:57:00  275.07001  275.16000  ...   4.55965  2.75237
#
# [3 rows x 13 columns]

df.columns

# Index(['open', 'high', 'low', 'close', 'volume', 'macd1', 'macd_signal1',
#        'macd_hist1', 'macd2', 'macd_signal2', 'macd_hist2', 'slow_k',
#        'slow_d'],
#       dtype='object')
Charts
Charts support OHLC, technical indicators and custom bars.
Static
Static charts are based on matplotlib library and require mplfinance package to be installed.
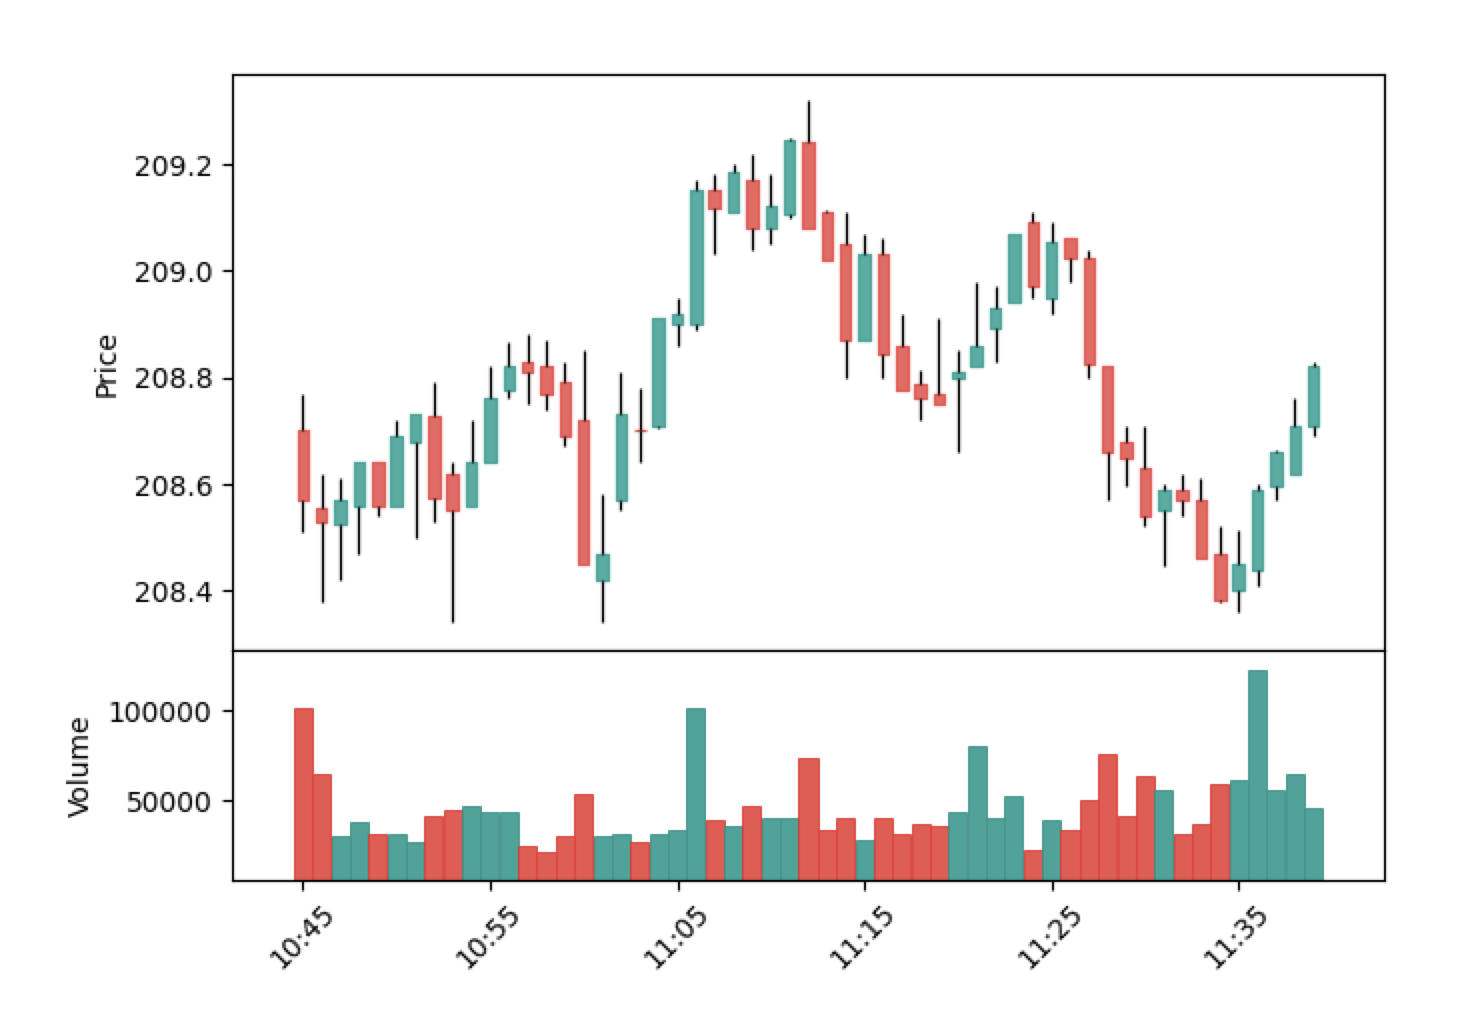
- Use
.as_pyplot_figure()
from twelvedata import TDClient

td = TDClient(apikey="YOUR_API_KEY_HERE")
ts = td.time_series(
    symbol="MSFT",
    outputsize=75,
    interval="1day",
)

# 1. Returns OHLCV chart
ts.as_pyplot_figure()

# 2. Returns OHLCV + BBANDS(close, 20, 2, SMA) + %B(close, 20, 2 SMA) + STOCH(14, 3, 3, SMA, SMA)
ts.with_bbands().with_percent_b().with_stoch(slow_k_period=3).as_pyplot_figure()
Interactive
Interactive charts are built on top of plotly library.
- Use
.as_plotly_figure().show()
from twelvedata import TDClient

td = TDClient(apikey="YOUR_API_KEY_HERE")
ts = td.time_series(
    symbol="DNR",
    outputsize=50,
    interval="1week",
)

# 1. Returns OHLCV chart
ts.as_plotly_figure()

# 2. Returns OHLCV + EMA(close, 7) + MAMA(close, 0.5, 0.05) + MOM(close, 9) + MACD(close, 12, 26, 9)
ts.with_ema(time_period=7).with_mama().with_mom().with_macd().as_plotly_figure().show()
WebSocket
With the WebSocket, a duplex communication channel with the server is established.
Make sure to have websocket_client package installed.
Features
- Real-time low latency stream of financial quotes.
- You might subscribe to stocks, forex, and crypto.
Example
import time
from twelvedata import TDClient


messages_history = []


def on_event(e):
    # do whatever is needed with data
    print(e)
    messages_history.append(e)


td = TDClient(apikey="YOUR_API_KEY_HERE")
ws = td.websocket(symbols="BTC/USD", on_event=on_event)
ws.subscribe(['ETH/BTC', 'AAPL'])
ws.connect()
while True:
    print('messages received: ', len(messages_history))
    ws.heartbeat()
    time.sleep(10)
Parameters accepted by the .websocket() object:
- symbols list of symbols to subscribe
- on_event function that invokes when event from server is received
- logger instance of logger, otherwise set to default
- max_queue_size maximum size of queue, default
12000 - log_level accepts
debugorinfo, otherwise not set
Applicable methods on .websocket() object:
ws.subscribe([list of symbols]): get data from the symbols passedws.unsubscribe([list of symbols]): stop receiving data from the symbols passedws.reset(): unsubscribe from all symbolsws.connect(): establish connection with WebSocket serverws.disconnect(): close connection with WebSocket serverws.heartbeat(): send heartbeat to server
Important. Do not forget that WebSockets are only available for Twelve Data users on the Pro plan and above. Checkout the trial here.
Advanced
Custom endpoint
This method is used to request unrepresented endpoints on this package, but which are available at Twelve Data.
endpoint = td.custom_endpoint(
    name="quote",
    symbol="AAPL",
)
endpoint.as_json()
The only required parameter is name which should be identical to the endpoint used at Twelve Data. All others can be custom and will vary according to the method.
Debugging
When the method doesn't return the desired data or throws an error, it might be helpful to understand and analyze the API query behind it.
Add .as_url() to any method or chain of methods, and it will return the list of used URLs.
ts = td.time_series(
    symbol="AAPL",
    interval="1min",
    outputsize=10,
    timezone="America/New_York",
).with_bbands().with_ema()

ts.as_url()
# ['https://api.twelvedata.com/time_series?symbol=AAPL&interval=1min&outputsize=10&dp=5&timezone=America/New_York&order=desc&prepost=false&format=JSON&apikey=demo',
# 'https://api.twelvedata.com/bbands?symbol=AAPL&interval=1min&series_type=close&time_period=20&sd=2&ma_type=SMA&outputsize=10&dp=5&timezone=America/New_York&order=desc&prepost=false&format=JSON&apikey=demo',
# 'https://api.twelvedata.com/ema?symbol=AAPL&interval=1min&series_type=close&time_period=9&outputsize=10&dp=5&timezone=America/New_York&order=desc&prepost=false&format=JSON&apikey=demo']
API usage
This method gives an overview of the current API credits consumption.
api = td.api_usage()
Support
Visit our official website contact page or support center.
Announcements
Follow us for announcements and updates about this library.
Roadmap
- Fundamentals
- WebSocket
- Batch requests
- Custom plots coloring
- Interactive charts (plotly)
- Static charts (matplotlib)
- Pandas support
Contributing
- Clone repo and create a new branch:
$ git checkout https://github.com/twelvedata/twelvedata -b name_for_new_branch. - Make changes and test.
- Submit Pull Request with comprehensive description of changes.
License
This package is open-sourced software licensed under the MIT license.
Release history Release notifications | RSS feed


Download files
Download the file for your platform. If you're not sure which to choose, learn more about installing packages.
Source Distribution
Built Distribution
Filter files by name, interpreter, ABI, and platform.
If you're not sure about the file name format, learn more about wheel file names.
Copy a direct link to the current filters
File details
Details for the file twelvedata-1.4.0.tar.gz.
File metadata
- Download URL: twelvedata-1.4.0.tar.gz
- Upload date:
- Size: 13.1 MB
- Tags: Source
- Uploaded using Trusted Publishing? No
- Uploaded via: twine/6.2.0 CPython/3.12.3
File hashes
| Algorithm | Hash digest | |
|---|---|---|
| SHA256 |
7f05f5a47171fb640d53c7f304a082c5697313f6525c0e7fcc284d49625a67f1
|
|
| MD5 |
d71f9ddb76431d26714a84cceb6db639
|
|
| BLAKE2b-256 |
8028445ed67ee810bb062304fb6d4a7982d4b6678bd7fec2d219180741c21f20
|
File details
Details for the file twelvedata-1.4.0-py3-none-any.whl.
File metadata
- Download URL: twelvedata-1.4.0-py3-none-any.whl
- Upload date:
- Size: 57.5 kB
- Tags: Python 3
- Uploaded using Trusted Publishing? No
- Uploaded via: twine/6.2.0 CPython/3.12.3
File hashes
| Algorithm | Hash digest | |
|---|---|---|
| SHA256 |
13b4c1852a478d8ada1d65dcad9c71c8f4e9e1b080de31092b44232c360cadae
|
|
| MD5 |
6f45952c8987d289be5d2c2342098478
|
|
| BLAKE2b-256 |
f0b501b6f53c448041c8fa885b10e83acbda9776185c007cde4ef7b23859151d
|


