Visualization of co2 emissions from 1990 to 2018 for each country
Project description
kotonohatango-getter
ことのはたんごのプレイヤーの集計データを可視化できる Python Package。
Python Package for visualization of aggregate data of players in "Kotoha Tango".
Example of use
pip install kotonohagetter
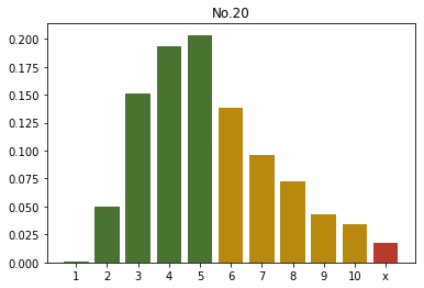
python kotonohagetter.py 20
usage: kg.py [-h] [--F F] Number
visualization of aggregate data of players in Kotoha Tango
positional arguments:
Number Get the [Number]th data.(int)
optional arguments:
-h, --help show this help message and exit
--F F Getting word data?(bool:[y,t,true]or[n,f,false])[Default:True]
output
1-10 Percentage of users cleared there.
x Percentage of users who could not clear.
Project details
Download files
Download the file for your platform. If you're not sure which to choose, learn more about installing packages.
Source Distributions
No source distribution files available for this release.See tutorial on generating distribution archives.
Built Distributions
visco2-0.0.3-py3.8.egg
(3.1 kB
view hashes)
VISCO2-0.0.3-py3.8.egg
(3.7 kB
view hashes)


