A python library for visualising bivariate data using glyphs and node-link diagrams with matplotlib.


Project description

vizent

A python library for visualising bivariate data using glyphs and node-link diagrams with matplotlib
This library allows the user to create scatter plots and node-link diagrams using Visual Entropy Glyphs[1] and network edges [2]. Vizent glyphs and network edges are designed to help when you need to add an extra variable to a scatter plot, map, or graph.
Vizent glyphs are bivariate, that is they allow you to represent two variables at each point on your plot. A central colored disc is able to represent a continuous variable, an enclosing shape can represent a continuous interval or categorical variable using increasing levels of visual entropy (shape complexity).
Vizent network edges enable additional bivariate data representation and can be used in combination with the glyphs. The edges represent data via colored edges and a visual entropy component on top of the colored edge capable of representing ordered data.
Applications for the Vizent glyphs include:
- when you need represent uncertainty at a point or edge, eg a mean and a standard deviation
- when you need to represent derivatives at a point or edge, eg a rate and an acceleration
- any other pair of values at a point on a plot or on a network edge.
The vizent library provides an interface to matplotlib axes and figures that supports the drawing of vizent glyphs and network edges. The matplotlib artists, figures and axes objects are returned for further editing using the broader matplotlib library if required.
The library also provides functionality to plot vizent glyphs and networks edges with a map background (requires Cartopy) or using an image provided by the user (requires pillow).
The gallery gives example plots demonstrating the library capability. A more detailed tutorial is also available here.
Installation
vizent can be installed using pip
pip install vizent
or via conda:
conda install -c conda-forge vizent
Dependencies:
- matplotlib
- numpy
- scipy
Optional dependencies:
- pillow (for image backgrounds)
- cartopy (for map backgrounds)
Using vizent
Library documentation is available at at: https://cusplondon.ac.uk/vizent
Glyph Designs
The available glyph shape designs are shown here in full. Value increases with frequency from left (lowest) to right (highest).
sine

saw

reverse_saw

square

triangular

concave

star

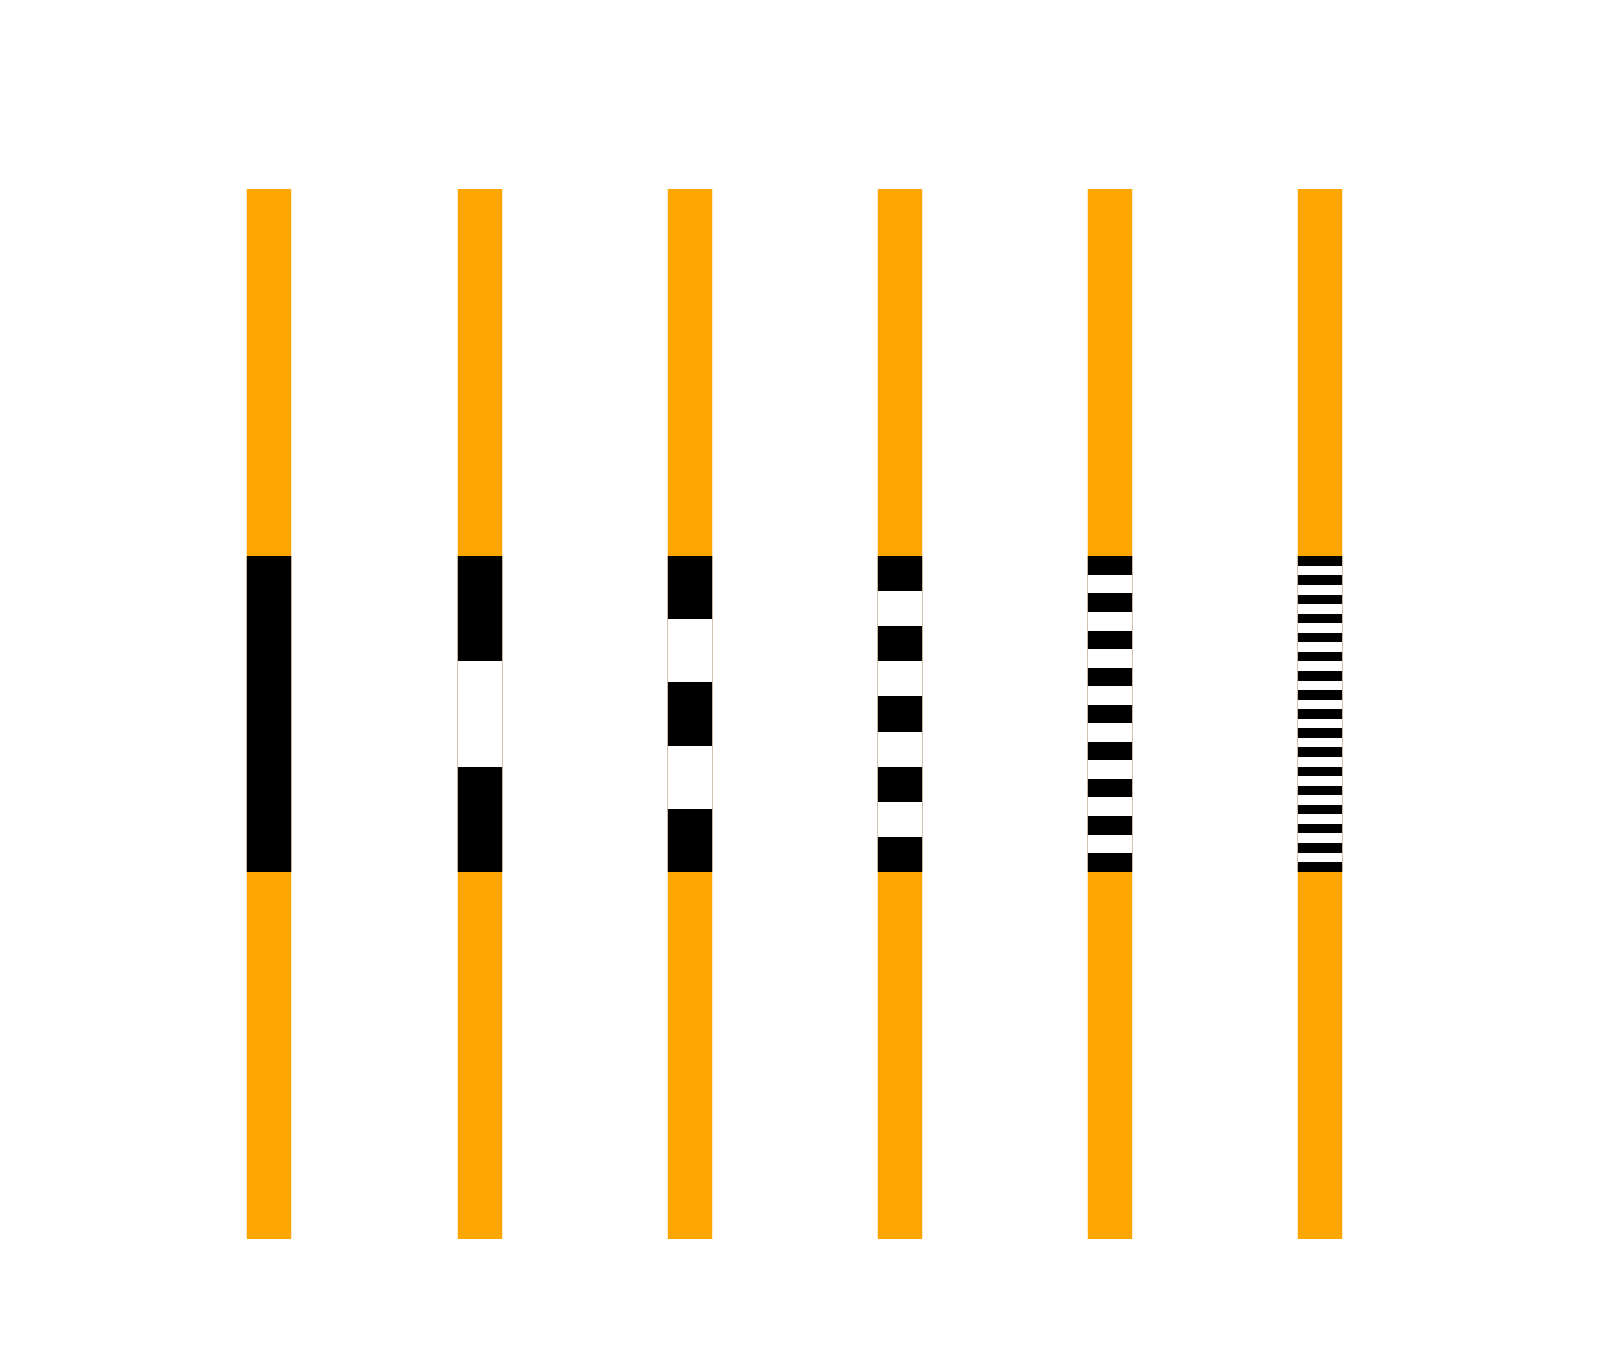
Edge Designs
Default sample lines for a variety of frequency values are shown below. The left-most line is used when the data contains numpy.nan (i.e. for missing data).
Examples
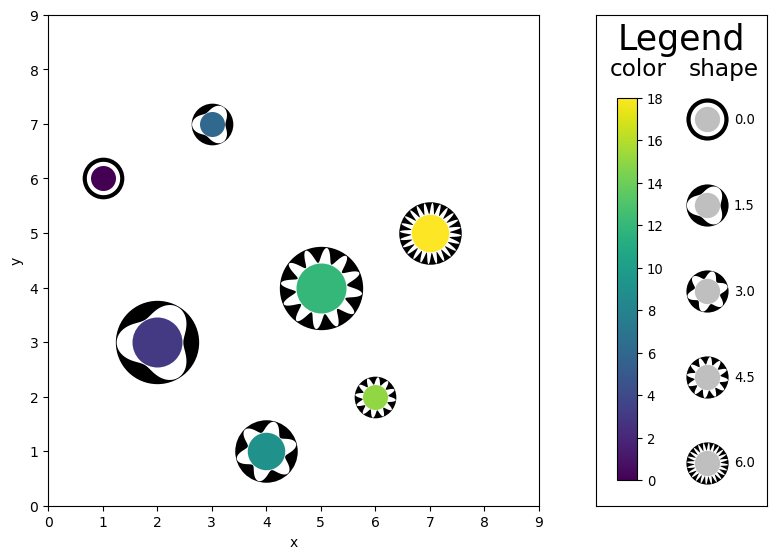
Create a basic scatterplot:
from vizent import vizent_plot

x_values = [1,2,3,4,5,6,7]
y_values = [6,3,7,1,4,2,5]
color_values = [0,3,6,9,12,15,18]
shape_values= [0,1,2,3,4,5,6]
size_values = [30,60,30,45,60,30,45]

extent = [0, 9, 0, 9]

fig = vizent_plot(x_values, y_values, color_values, shape_values, size_values,
                  color_label="color", shape_label="shape", glyph_legend_title='Legend',
                  extent=extent)

fig.axes[1].set_xlabel('x')
fig.axes[1].set_ylabel('y')
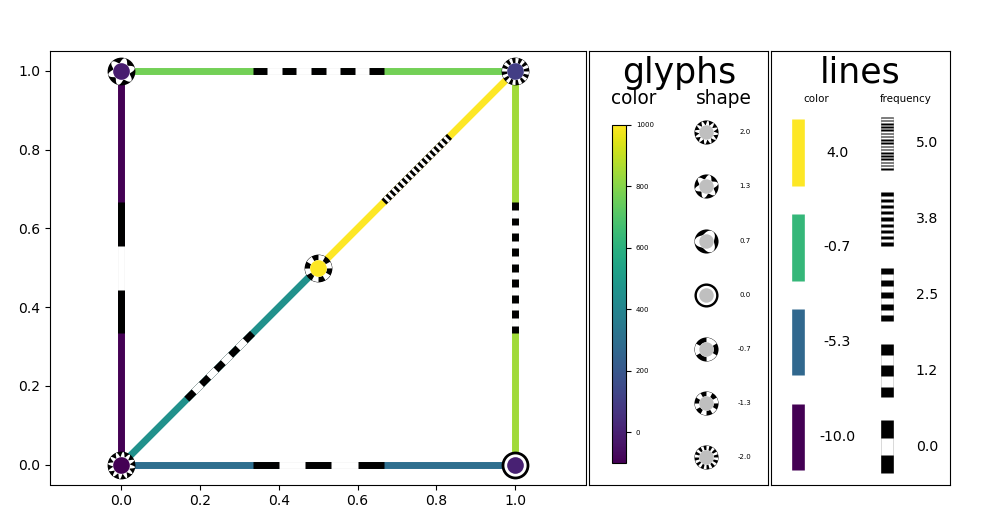
Create a vizent plot with edges:
import numpy as np
from vizent import vizent_plot

x_values = [0, 0, 1, 1, 0.5]
y_values = [0, 1, 0, 1, 0.5]

color_values = [-100, -10, 0.01, 100, 1000]
shape_values = [2, 1, 0, -2, -1]

edge_color_values = [-10, -5, -3, 1, 2, 4]
edge_freq_values = range(6)
color_values = [-100, -10, 0.01, 100, 1000]
shape_values = [2, 1, 0, -2, -1]

# Build a sample network based on these points
x_start = []
x_end = []
y_start = []
y_end = []
for x1,y1 in zip(x_values, y_values):
    for x2,y2 in zip(x_values, y_values):
        if x1 <= x2 and y1 <= y2:
            line_distance =  np.sqrt((x1 - x2)**2 + (y1 - y2)**2)
            if line_distance <= 1 and line_distance > 10e-5:
                x_start.append(x1)
                y_start.append(y1)
                x_end.append(x2)
                y_end.append(y2)

fig = vizent_plot(x_values=x_values,
                  y_values=y_values,
                  colour_values=color_values,
                  shape_values=shape_values,
                  size_values=[20 for i in range(len(x_values))],
                  edge_start_points=[(x,y) for x,y in zip(x_start, y_start)],
                  edge_end_points=[(x,y) for x,y in zip(x_end, y_end)],
                  edge_colors=edge_color_values,
                  edge_frequencies=edge_freq_values,
                  edge_widths=[5 for i in range(len(x_start))],
                  edge_color_n=4,
                  scale_x=15)
Other examples, including those using background maps for geospatial data can be found at https://cusplondon.ac.uk/vizent/gallery.
Release History
- 1.0 First release 24/02/2021
- 1.1 Added vizent network edges 13/09/2023
Meta
Distributed under the MIT license. See LICENSE for more information.
Acknowledgments: The Alan Turing Institute for funding the Newcastle Seedcorn project "Automating visualization", under the EPSRC grant EP/N510129/1 and for Nick Holliman's Turing Fellowship 2018-2024. For supporting Lucy McLaughlin's PhD, the EPSRC Centre for Doctoral Training in Cloud Computing for Big Data EP/L015358/1. For Osman Akbulut's PhD support the Turkish Government. CUSP London, the Department of Informatics and the Faculty of NMES at King's College for supporting Dr Peter Baudains' time. A Department of Informatics Impact Acceleration Award for summer 2023 funding to develop new Vizent test cases for Kabir Chhabra.
[1] "Visual Entropy and the Visualization of Uncertainty", Holliman et al, arXiv:1907.12879
[2] "Visualising ordered bivariate data on node-link diagrams", O Akbulut, L McLaughlin, T Xin et al. Visual Informatics (2023) doi:10.1016/j.visinf.2023.06.003
Release history Release notifications | RSS feed


Download files
Download the file for your platform. If you're not sure which to choose, learn more about installing packages.
Source Distribution
Built Distribution
Filter files by name, interpreter, ABI, and platform.
If you're not sure about the file name format, learn more about wheel file names.
Copy a direct link to the current filters
File details
Details for the file vizent-1.1.2.tar.gz.
File metadata
- Download URL: vizent-1.1.2.tar.gz
- Upload date:
- Size: 46.3 MB
- Tags: Source
- Uploaded using Trusted Publishing? No
- Uploaded via: twine/4.0.2 CPython/3.11.5
File hashes
| Algorithm | Hash digest | |
|---|---|---|
| SHA256 |
efca9278ac602335718764604ffdbb004bbc357a9286ec620fe7fba7cb6c58db
|
|
| MD5 |
150377d7e25e19945703a66e0463d2db
|
|
| BLAKE2b-256 |
cafb0b7999c4bf015b24f15399bf04fc820b33125fe06f0dfc8532360ede23c9
|
File details
Details for the file vizent-1.1.2-py3-none-any.whl.
File metadata
- Download URL: vizent-1.1.2-py3-none-any.whl
- Upload date:
- Size: 46.3 MB
- Tags: Python 3
- Uploaded using Trusted Publishing? No
- Uploaded via: twine/4.0.2 CPython/3.11.5
File hashes
| Algorithm | Hash digest | |
|---|---|---|
| SHA256 |
8d9a8024dcadd3d6bdacb697ab459ca74b38d0d0f3024a7ba55bd80b40e9110b
|
|
| MD5 |
be933b2b2b74a4fc97b24e41f83ee4ab
|
|
| BLAKE2b-256 |
1183874d5b52246ca5d2ae49f5f9e879602882e61c2e549258196bd2b071ca61
|


