Generate waveform and spectrogram png images from a wav file

Project description
WAVPLOT
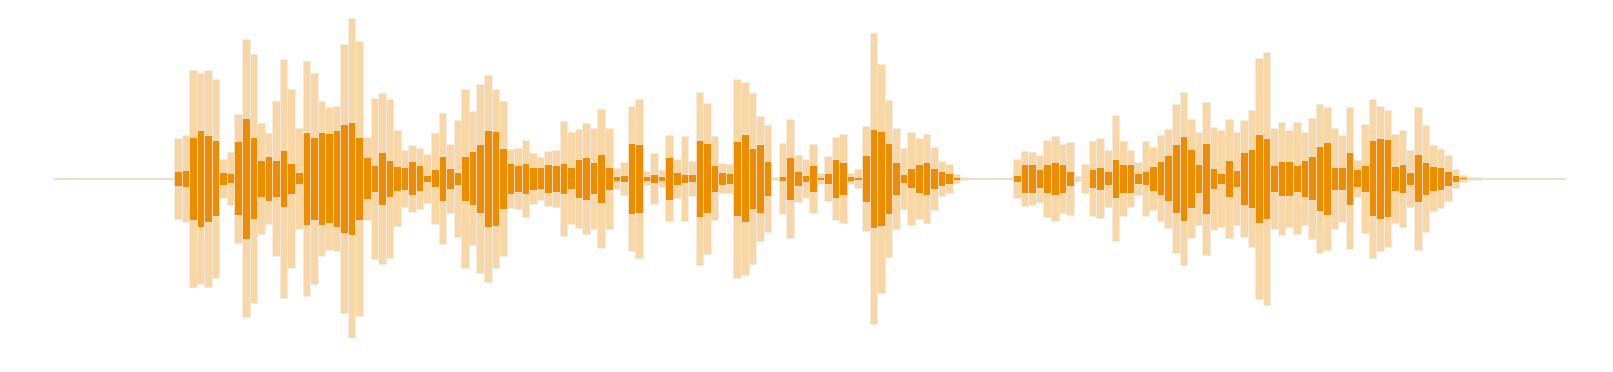
Tired of waveform plots that blow up your paper?
Here comes a matplotlib wavform plot that gives soundcloud like plots in just a few lines of code!
Features
- Freely selectable width, height, DPI and number of bars to plot
- Writes transparent pngs
Installation
pip install wavplot
Usage
wavplot violin.wav violin.png
for additional parameters please inspect the help using
wavplot -h
Release history Release notifications | RSS feed

Download files
Download the file for your platform. If you're not sure which to choose, learn more about installing packages.
Source Distribution
wavplot-0.1.1.tar.gz
(3.5 kB
view details)
Built Distribution
Filter files by name, interpreter, ABI, and platform.
If you're not sure about the file name format, learn more about wheel file names.
Copy a direct link to the current filters
File details
Details for the file wavplot-0.1.1.tar.gz.
File metadata
- Download URL: wavplot-0.1.1.tar.gz
- Upload date:
- Size: 3.5 kB
- Tags: Source
- Uploaded using Trusted Publishing? No
- Uploaded via: twine/3.2.0 pkginfo/1.5.0.1 requests/2.24.0 setuptools/47.1.1 requests-toolbelt/0.9.1 tqdm/4.49.0 CPython/3.8.5
File hashes
| Algorithm | Hash digest | |
|---|---|---|
| SHA256 |
ef570eb76f6a46cb87b39c3d9e0ba921807014b1db09507aa0aa872c37c0b5a8
|
|
| MD5 |
81ed457de5098507b4067c97040f84f3
|
|
| BLAKE2b-256 |
41769daa1da2deced8def792f926187c9d2923270e29299f01fc4688f79547fd
|
File details
Details for the file wavplot-0.1.1-py3-none-any.whl.
File metadata
- Download URL: wavplot-0.1.1-py3-none-any.whl
- Upload date:
- Size: 3.6 kB
- Tags: Python 3
- Uploaded using Trusted Publishing? No
- Uploaded via: twine/3.2.0 pkginfo/1.5.0.1 requests/2.24.0 setuptools/47.1.1 requests-toolbelt/0.9.1 tqdm/4.49.0 CPython/3.8.5
File hashes
| Algorithm | Hash digest | |
|---|---|---|
| SHA256 |
e7ec46c37271b89864110723673a3320c51e061ba69f0e6b83d8193cf1b02537
|
|
| MD5 |
c5c3d062f3e395b69f1687bf5262fb9b
|
|
| BLAKE2b-256 |
b243bc4006cc63e69127aca60bc715a1f77206fb3daa5eec622d568fed84ed01
|


