





CHAID — Chi-Squared Automatic Interaction Detection
A Python implementation of the CHAID decision tree, including Exhaustive CHAID.
CHAID answers the question "which of my variables best explains this outcome, and for which groups of people?" Given an outcome (the dependent variable) and a set of categorical predictors (the independent variables), it repeatedly divides the data into the groups that differ most in their outcome, and reports the statistical evidence for every division. It is widely used for survey analysis and market segmentation because the result is a tree a person can read.
Contents
- How CHAID works
- Installation
- Quick start
- How to read the tree
- Building a tree
- Parameters
- Working with the result
- Continuous dependent variables
- Weights
- Missing values
- Exhaustive CHAID
- Tree visualisation
- Command-line interface
- Caveats
How CHAID works
At each node, starting with the whole dataset, the algorithm does the following for every independent variable:
- Merge categories that behave alike. Every allowed pair of categories is tested against the dependent variable. If the least different pair is not significantly different (its p-value is above
alpha_merge), the two are merged into one group and the tests are repeated. Merging stops when every remaining pair is significantly different. - Score the variable. The groups that remain are tested together against the dependent variable, giving the variable a p-value and a test score.
The node is then split on the variable with the lowest p-value (ties go to the higher score), creating one child node per group. Each child is processed the same way until a stopping rule applies: the maximum depth is reached, the node is too small, the node contains a single outcome, or no variable produces a significant split.
Which pairs may be merged depends on the type of the independent variable:
| Type | Meaning | Pairs that may merge |
|---|---|---|
nominal |
Categories with no order, such as region or gender | Any two categories |
ordinal |
Categories with an order, such as age band or a 1–5 rating | Only neighbouring categories, so groups stay contiguous |
The statistical test depends on the type of the dependent variable:
| Dependent variable | Test |
|---|---|
categorical (default) |
Pearson's chi-squared test |
continuous |
Bartlett's test if the dependent variable is normally distributed, otherwise Levene's test |
Installation
CHAID requires Python 3.9+ and is distributed via PyPI:
pip install CHAID
Optional extras
pip install 'CHAID[graph]'        # Tree visualisation
pip install 'CHAID[spss]'         # Reading SPSS .sav files from the command line
pip install 'CHAID[graph,spss]'   # Both
The graph extra draws trees with Plotly, Kaleido and Graphviz, and needs two things that pip does not install:
- The Graphviz system package:
brew install graphvizon macOS,sudo apt-get install graphvizon Debian/Ubuntu, or see the Graphviz downloads. - Google Chrome or Chromium, which Kaleido 1 uses to draw the charts. If neither is installed, run
plotly_get_chromeafter installing the extra to download a private copy. See Plotly's image export setup for details.
Quick start
The examples below use the Titanic passenger list that ships with this repository in tests/data/titanic.csv.
import pandas as pd
from CHAID import Tree

df = pd.read_csv('tests/data/titanic.csv')

tree = Tree.from_pandas_df(
    df,
    dict(sex='nominal', embarked='nominal', pclass='ordinal'),  # independent variables and their types
    'survived',                                                 # dependent variable
)
tree.print_tree()
([], {0: 809.0, 1: 500.0}, (sex, p=1.4714531016922666e-81, score=365.8869478111205, groups=[['female'], ['male']]), dof=1))
|-- (['female'], {0: 127.0, 1: 339.0}, (pclass, p=7.507187065692296e-26, score=115.70270316146012, groups=[[1], [2], [3]]), dof=2))
|   |-- ([1], {0: 5.0, 1: 139.0}, <Invalid Chaid Split> - the max depth has been reached)
|   |-- ([2], {0: 12.0, 1: 94.0}, <Invalid Chaid Split> - the max depth has been reached)
|   +-- ([3], {0: 110.0, 1: 106.0}, <Invalid Chaid Split> - the max depth has been reached)
+-- (['male'], {0: 682.0, 1: 161.0}, (pclass, p=9.1968624901058e-09, score=33.004017660910904, groups=[[1], [2, 3]]), dof=1))
    |-- ([1], {0: 118.0, 1: 61.0}, <Invalid Chaid Split> - the max depth has been reached)
    +-- ([2, 3], {0: 564.0, 1: 100.0}, <Invalid Chaid Split> - the max depth has been reached)
How to read the tree
Each line is one node, written as (choices, members, split):
| Part | Example | Meaning |
|---|---|---|
| Choices | ['female'] |
The categories of the parent's split variable that lead to this node. Empty for the root. |
| Members | {0: 127.0, 1: 339.0} |
How many observations in the node have each value of the dependent variable: 127 women died and 339 survived. |
| Split | (pclass, p=7.5e-26, score=115.7, groups=[[1], [2], [3]], dof=2) |
The variable this node is divided on, the p-value and score of the test, the groups of categories that form the children, and the degrees of freedom. |
| Invalid split | <Invalid Chaid Split> - the max depth has been reached |
The node is terminal, followed by the reason it was not split. |
Reading the example from the top:
- Sex is the strongest predictor of survival (p ≈ 10⁻⁸¹). 73% of women survived (339 of 466) against 19% of men (161 of 843).
- Among women, passenger class matters and all three classes differ: 97% survived in first class, 89% in second and 49% in third.
- Among men, class matters too, but second and third class were not significantly different from each other, so they were merged into one group (
[2, 3]). 34% of first-class men survived against 15% of the rest. embarkedwas never chosen: at every node another variable had a lower p-value.
Building a tree
There are three ways to construct a tree. All three give the same result.
from CHAID import Tree, NominalColumn, OrdinalColumn

# 1. From a pandas DataFrame: pass a dict of column name -> variable type
tree = Tree.from_pandas_df(df, dict(sex='nominal', pclass='ordinal'), 'survived')

# 2. From numpy arrays: one column per independent variable
tree = Tree.from_numpy(
    df[['sex', 'pclass']].values,
    df['survived'].values,
    split_titles=['sex', 'pclass'],
    variable_types=['nominal', 'ordinal'],   # defaults to all nominal
)

# 3. From columns you construct yourself, with the parameters in a dict
tree = Tree(
    [NominalColumn(df['sex'].values, name='sex'), OrdinalColumn(df['pclass'].values, name='pclass')],
    NominalColumn(df['survived'].values),
    {'max_depth': 2},
)
The tree is built the first time you use it, for example by printing it or reading tree.tree_store.
Ordinal variables must be numeric, as their numeric order is the category order. Nominal variables can hold any values, including strings.
Parameters
Tree.from_pandas_df and Tree.from_numpy take these as keyword arguments. The Tree constructor takes the first seven as keys of its config dict.
| Parameter | Default | Description |
|---|---|---|
alpha_merge |
0.05 |
The significance level. Two categories are merged when the test between them has a p-value above this, so a split is only made between groups that all differ at this level. Lower values give fewer, more strongly supported splits. |
max_depth |
2 |
The maximum number of levels below the root. |
min_parent_node_size |
30 |
A node must contain more than this many observations to be split. A value between 0 and 1 is read as a fraction of the dataset. |
min_child_node_size |
30 |
The minimum size of every child created by a split. Categories are merged to respect it, and if it cannot be met the node is not split. A value between 0 and 1 is read as a fraction of the dataset. |
max_splits |
None |
The maximum number of children a split may create. Categories keep merging until no more than this many groups remain. None means no limit. |
split_threshold |
0 |
How close a competing variable's score must be to the winner's to be kept as a surrogate split. 0 keeps none. |
is_exhaustive |
False |
Use Exhaustive CHAID. |
dep_variable_type |
'categorical' |
'categorical' or 'continuous'. See Continuous dependent variables. |
weight / weights |
None |
Observation weights. from_pandas_df takes weight, the name of a column; from_numpy takes weights, an array. See Weights. |
The defaults of 30 for the node sizes suit datasets of a few hundred rows or more. On a small dataset, lower them or no split will be made.
Working with the result
Nodes and splits
tree.tree_store is a list of every node, ordered by node_id, with the root first. tree.get_node(node_id) returns one node, and iterating over the tree yields each node in turn.
root = tree.get_node(0)

>>> root.members
{0: 809.0, 1: 500.0}
>>> root.is_terminal
False
>>> root.indices          # row positions in the original data that fall in this node
array([   0,    1,    2, ..., 1306, 1307, 1308])

>>> root.split.column
'sex'
>>> root.split.p
1.4714531016922666e-81
>>> root.split.score
365.8869478111205
>>> root.split.dof
1
>>> root.split.split_groups
[['female'], ['male']]

node = tree.get_node(2)
>>> node.choices, node.parent
([1], 1)
>>> str(node.split.invalid_reason)
'the max depth has been reached'
A terminal node's split.invalid_reason is an InvalidSplitReason, one of:
| Reason | Meaning |
|---|---|
MAX_DEPTH |
The node is at max_depth. |
MIN_PARENT_NODE_SIZE |
The node has too few observations to be split. |
MIN_CHILD_NODE_SIZE |
Any split would create a child that is too small. |
ALPHA_MERGE |
No variable separates the node at the alpha_merge level. |
PURE_NODE |
Every observation has the same outcome, or the variables have only one category left. |
MAX_SPLITS |
The split could not be reduced to max_splits groups. |
NODE_NOT_EXHAUSTIVE |
Exhaustive CHAID could not reduce the variable to two groups. |
Predictions
>>> tree.node_predictions()      # the id of the terminal node each row falls in
array([2., 6., 2., ..., 7., 7., 7.])

>>> tree.model_predictions()     # the most common outcome in that terminal node
array([1, 0, 1, ..., 0, 0, 0], dtype=object)

>>> tree.accuracy()              # share of rows whose prediction matches the data
0.7830404889228418
>>> tree.risk()                  # 1 - accuracy
0.21695951107715816
These describe the data the tree was built on. model_predictions and accuracy apply to categorical dependent variables only.
Classification rules
classification_rules() returns, for every terminal node, the conditions an observation must satisfy to land in it:
>>> tree.classification_rules()
[
    {'node': 2, 'rules': [{'variable': 'pclass', 'data': [1]}, {'variable': 'sex', 'data': ['female']}]},
    {'node': 3, 'rules': [{'variable': 'pclass', 'data': [2]}, {'variable': 'sex', 'data': ['female']}]},
    ...
]
Node 2 is therefore "first-class women". Rules are listed from the node upwards to the root.
Surrogate splits
Sometimes a second variable separates a node almost as well as the one that was chosen. Setting split_threshold keeps those runners-up: any variable whose score is at least (1 - split_threshold) times the winning score is stored in split.surrogates.
tree = Tree.from_pandas_df(df, dict(sex='nominal', embarked='nominal', pclass='ordinal'),
                           'survived', split_threshold=0.9, max_depth=1)

>>> tree.get_node(0).split.surrogates
[(embarked, p=1.5344209629612067e-11, score=45.489719507994074, groups=[['<missing>', 'C'], ['S', 'Q']]), dof=1),
 (pclass, p=1.7208259588256175e-28, score=127.85915643930326, groups=[[1], [2], [3]]), dof=2)]
As a treelib tree
>>> tree.to_tree()
<treelib.tree.Tree object at 0x114e2e350>
Continuous dependent variables
Pass dep_variable_type='continuous' when the outcome is a number rather than a category. Groups are then compared on their variance with Bartlett's or Levene's test, chosen automatically from whether the dependent variable is normally distributed.
tree = Tree.from_pandas_df(df, dict(sex='nominal', embarked='nominal', pclass='ordinal'),
                           'fare', dep_variable_type='continuous', max_depth=1)
tree.print_tree()
([], {'mean': 33.270043468296414, 's.t.d': 51.7272930772313}, (pclass, p=2.398642777475668e-74, score=193.55353679486745, groups=[[1], [2], [3]]), dof=1307))
|-- ([1], {'mean': 87.50899164086688, 's.t.d': 80.32255047732433}, <Invalid Chaid Split> - the max depth has been reached)
|-- ([2], {'mean': 21.179196389891697, 's.t.d': 13.582538255772286}, <Invalid Chaid Split> - the max depth has been reached)
+-- ([3], {'mean': 13.284125811001411, 's.t.d': 11.488987341254242}, <Invalid Chaid Split> - the max depth has been reached)
A node's members are the mean and standard deviation of the dependent variable instead of category counts.
Weights
Survey data often carries a weight per respondent. Pass the name of the weight column to from_pandas_df (weight='my_weights') or an array to from_numpy (weights=array).
For a categorical dependent variable the chi-squared test is then computed on weighted counts, following the method SPSS uses; the derivation is in docs/chaid_weighting.rst. Node members become weighted totals. For a continuous dependent variable each value is multiplied by its weight before testing.
Missing values
- Nominal independent variables:
NaNbecomes its own category, shown as<missing>, which can merge with any other category. - Ordinal independent variables:
NaNis kept out of the ordering and may merge with any group, shown as<missing>. - Continuous dependent variables:
NaNis replaced with0.0. Remove those rows first if that is not what you want.
No rows are dropped.
Exhaustive CHAID
With is_exhaustive=True, merging does not stop once the remaining groups are significantly different. It continues until each variable is reduced to two groups, so every split is binary.
tree = Tree.from_pandas_df(df, dict(embarked='nominal', pclass='ordinal'), 'survived',
                           max_depth=1, is_exhaustive=True)
tree.print_tree()
([], {0: 809.0, 1: 500.0}, (pclass, p=1.1302700870998275e-24, score=105.15357908571468, groups=[[1, 2], [3]]), dof=1))
|-- ([1, 2], {0: 281.0, 1: 319.0}, <Invalid Chaid Split> - the max depth has been reached)
+-- ([3], {0: 528.0, 1: 181.0}, <Invalid Chaid Split> - the max depth has been reached)
Without it, the same call splits pclass into three groups, [[1], [2], [3]].
Tree visualisation
With the graph extra installed:
tree.render(path='my_tree', view=False)
This writes a Graphviz source file at my_tree and the image at my_tree.png. With no path, the files go to a trees/ directory under a timestamped name. view=True opens the image when it is ready.
Each node is drawn as a chart of its members, with the p-value, score and split variable beneath it for nodes that are split.
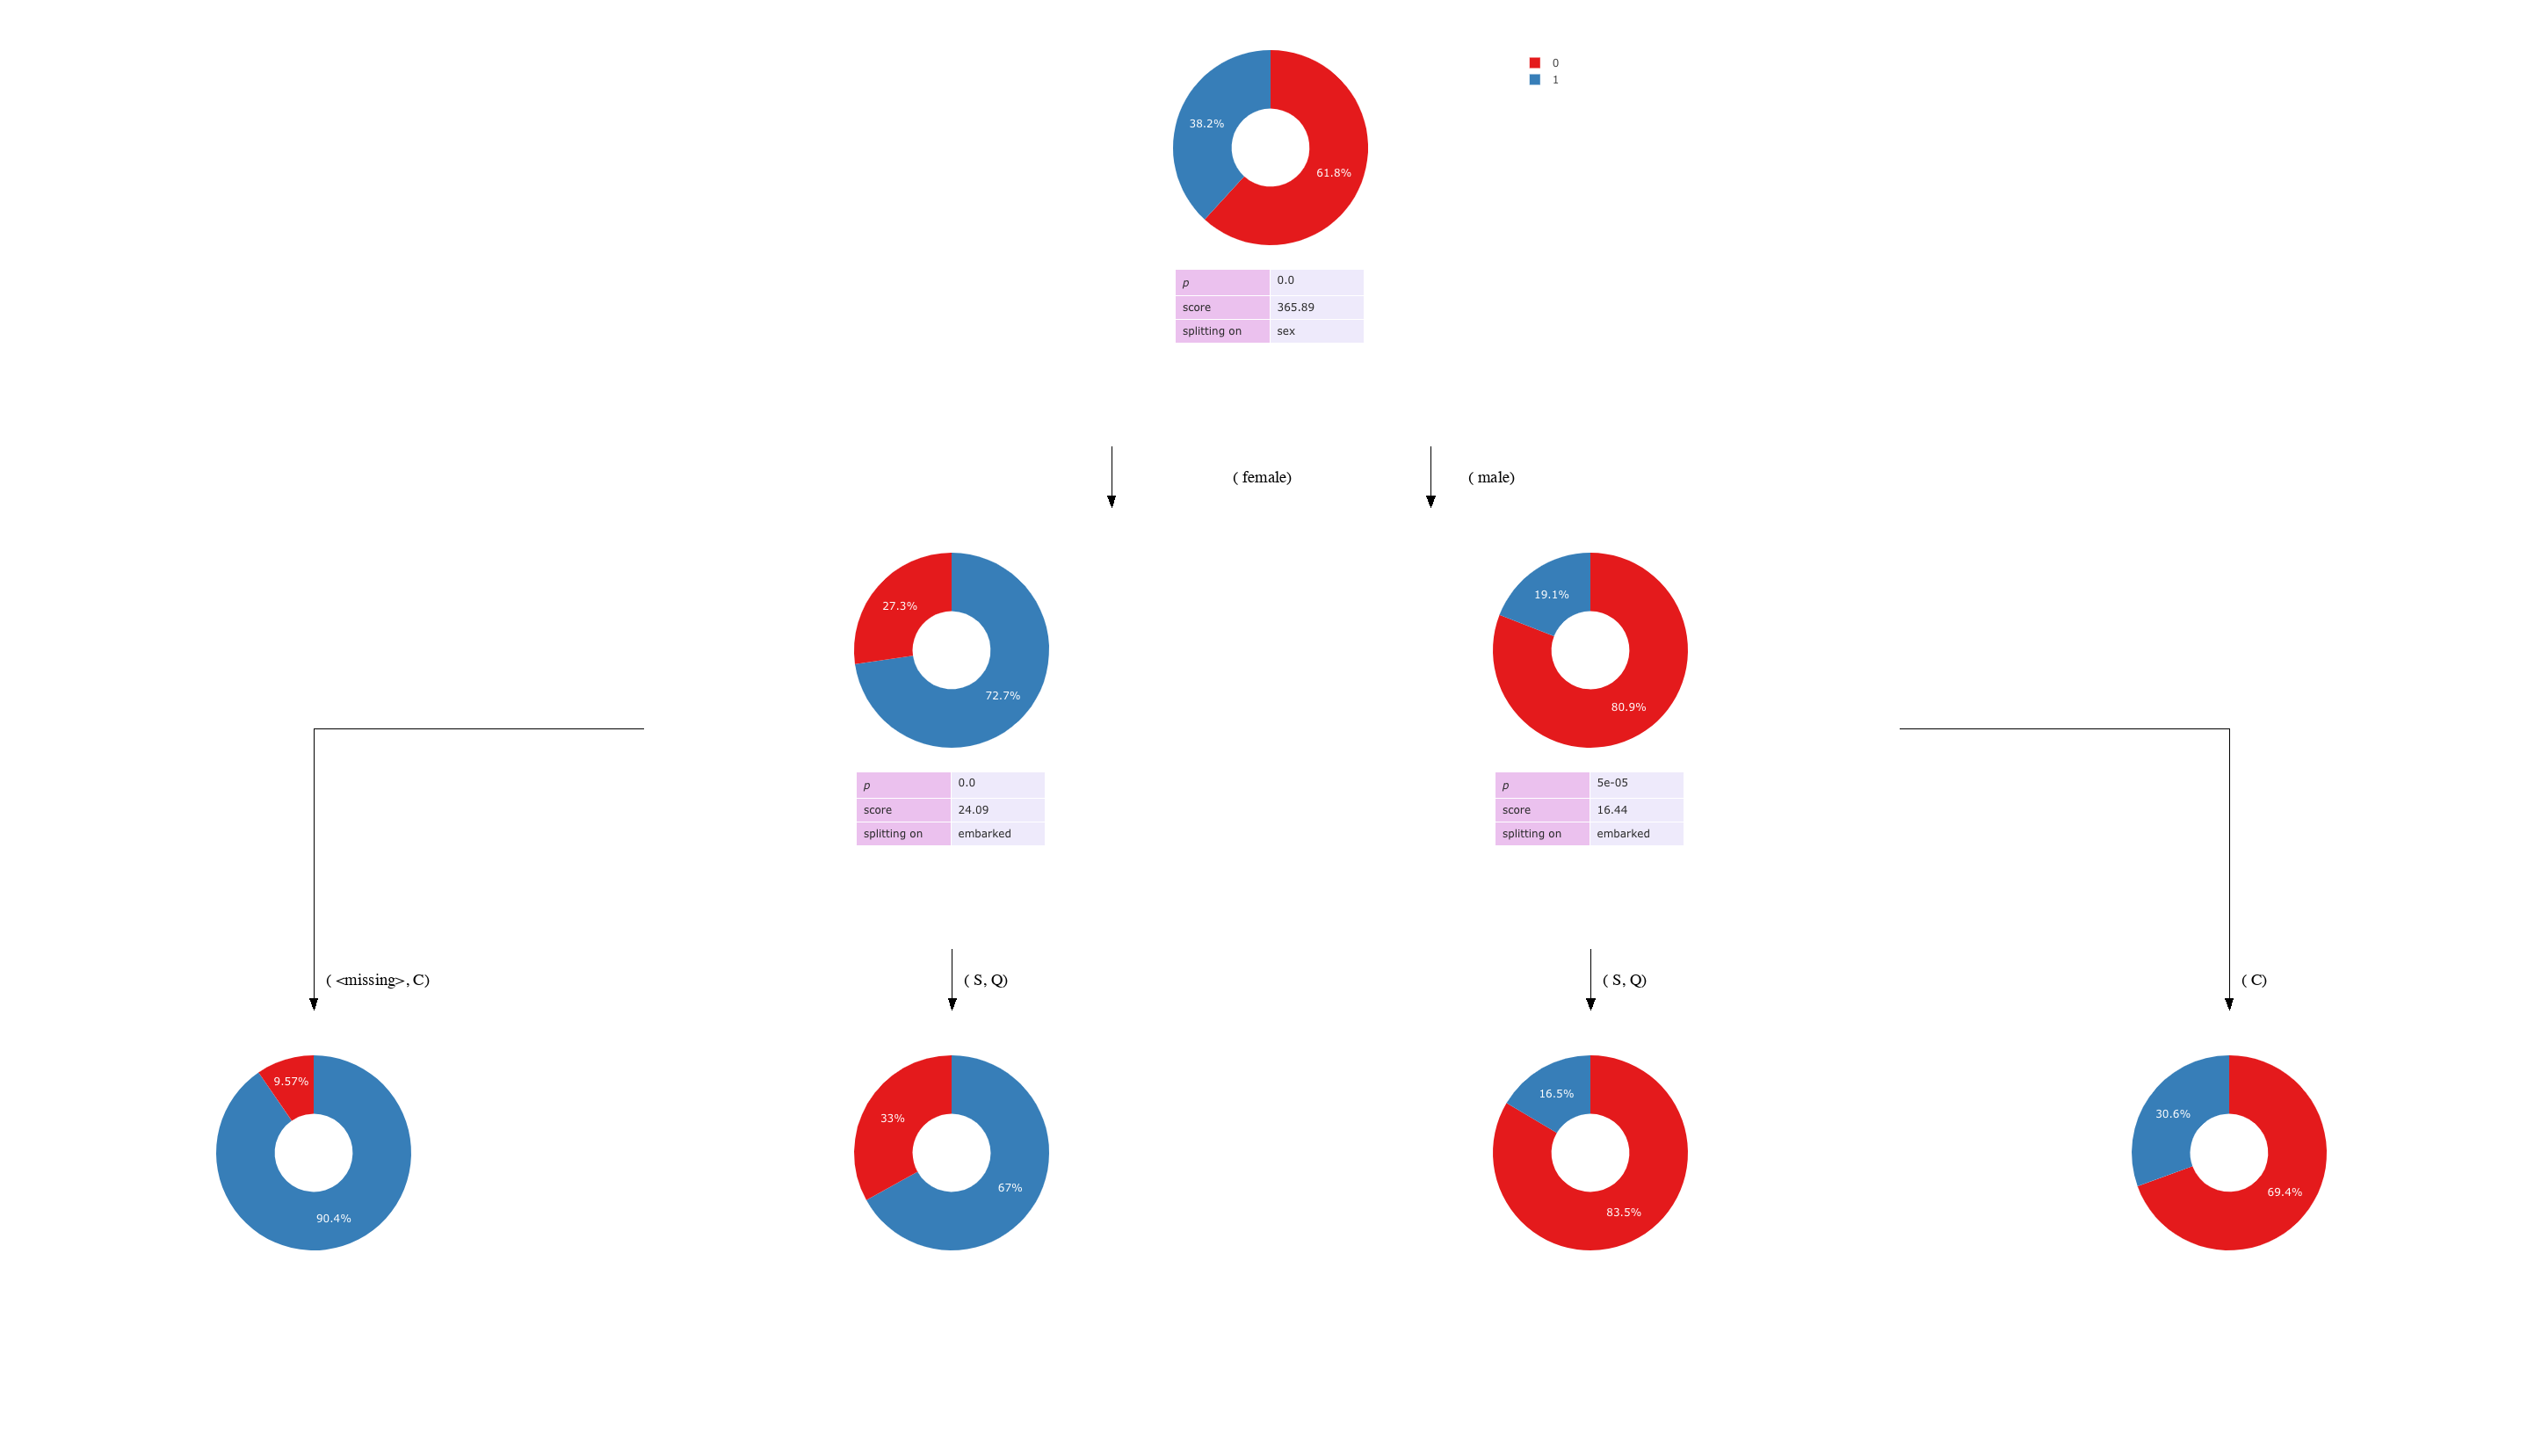
To get the tree structure as Graphviz DOT without the charts, which needs no extra:
tree.to_tree().to_graphviz()
Command-line interface
CHAID can be run on a CSV file, or an SPSS .sav file with the spss extra:
python -m CHAID <file> <dependent_variable> <nominal_variables...> [options]
Variables named after the dependent variable are treated as nominal. Ordinal variables are passed with --ordinal-variables.
| Option | Effect |
|---|---|
--ordinal-variables A B ... |
Independent variables to treat as ordinal |
--dependent-variable-type TYPE |
categorical (default) or continuous |
--weights COLUMN |
Name of the weight column |
--max-depth N |
See Parameters |
--min-parent-node-size N |
See Parameters |
--min-child-node-size N |
See Parameters |
--alpha-merge P |
See Parameters |
--exhaustive |
Use Exhaustive CHAID |
--export-path PATH |
Render the tree image to PATH |
By default the tree and its accuracy are printed. One of these changes what is output:
| Option | Output |
|---|---|
--rules |
The classification rules |
--classify |
The input data as CSV, with a node_id column giving each row's terminal node |
--predict |
The input data as CSV, with a predicted column giving each row's predicted outcome |
--export |
The tree image, in a trees/ directory |
Examples
# Basic tree
python -m CHAID tests/data/titanic.csv survived sex embarked --max-depth 4 --min-parent-node-size 2

# With an ordinal variable
python -m CHAID tests/data/titanic.csv survived sex embarked --ordinal-variables pclass

# Continuous dependent variable
python -m CHAID tests/data/titanic.csv fare sex embarked --dependent-variable-type continuous

# Classification rules from Exhaustive CHAID
python -m CHAID tests/data/titanic.csv survived sex embarked --exhaustive --rules

# Save the tree image
python -m CHAID tests/data/titanic.csv survived sex embarked --export-path my_tree
Run python -m CHAID -h for the full list of options.
Caveats
- p-values are not Bonferroni-adjusted for the number of category merges, so they will differ from tools that apply that adjustment.
- Unlike SPSS, this library does not modify data internally: weights are not rounded.
- Every row is included in the analysis, even if all of its independent variables are
NaN. SPSS excludes such rows in the weighted case.
Testing
pip install -e '.[test,graph]'
pytest
The graph test needs the Graphviz system package and Chrome, as described under Optional extras.
Contributing
Contributions are welcome. Please open an issue or submit a pull request on GitHub.
License
Apache License 2.0 — see LICENSE.txt for details.
1 maintainer

Metadata
1 maintainer
Release files for CHAID 5.5.1
For a detailed explanation of source distributions (sdists) and built distributions (wheels), please see the package formats documentation.
Source distribution (sdist)
| File | Size | Uploaded | Provenance | |
|---|---|---|---|---|
| chaid-5.5.1.tar.gz | 49.8 kB | Without provenance | Details |
Built distribution (wheel)
| File | Interpreter | ABI | Platform | Reset |
|---|---|---|---|---|
| chaid-5.5.1-py3-none-any.whl | Python 3 | none | any | Details |
Total release size: 79.1 kB
Release files / chaid-5.5.1.tar.gz
| Download URL | chaid-5.5.1.tar.gz |
|---|---|
| Size | 49.8 kB |
| Tags | Source |
|
SHA-256 checksum How to use checksums |
5e41798f6018bdeadfe22dbab050941b2e5cb5df59a66adf96eceab8f7d21c56
|
|
BLAKE2b-256 checksum How to use checksums |
4443dc6b4f4346192ebcc7864acdfb435c7a2fd40b806458369e79b2b38ec5ed
|
| Upload date | |
|
Uploaded using Trusted Publishing? What is trusted publishing? |
No |
| Uploaded via |
twine/7.0.0 CPython/3.14.4
|
Release files / chaid-5.5.1-py3-none-any.whl
| Download URL | chaid-5.5.1-py3-none-any.whl |
|---|---|
| Size | 29.3 kB |
| Tags | Python 3 |
|
SHA-256 checksum How to use checksums |
4ae31ec8df04b221d056da923279a27319c654f90de36a20dc6ac31fedaa716b
|
|
BLAKE2b-256 checksum How to use checksums |
fafd815a564142d48e5c9179a275dbf72a115d18e887cb40be4642caf154ec76
|
| Upload date | |
|
Uploaded using Trusted Publishing? What is trusted publishing? |
No |
| Uploaded via |
twine/7.0.0 CPython/3.14.4
|
Security for CHAID 5.5.1
Provenance
Provenance describes where a file came from. On PyPI, provenance is shared via attestations, which provide a verifiable record of the build or publishing details. View details, limitations and caveats.
No provenance found
None of the files in this release were uploaded with provenance metadata.
A note on package security
PyPI is a repository for distributing packages, not a service for auditing them. While third-party security researchers and our staff do their best to detect and remove malicious packages, PyPI cannot guarantee the quality, security or suitability of any given package.














