
Spectrum analyzer for RTL-SDR (GUI for rtl_power based on PyQtGraph)
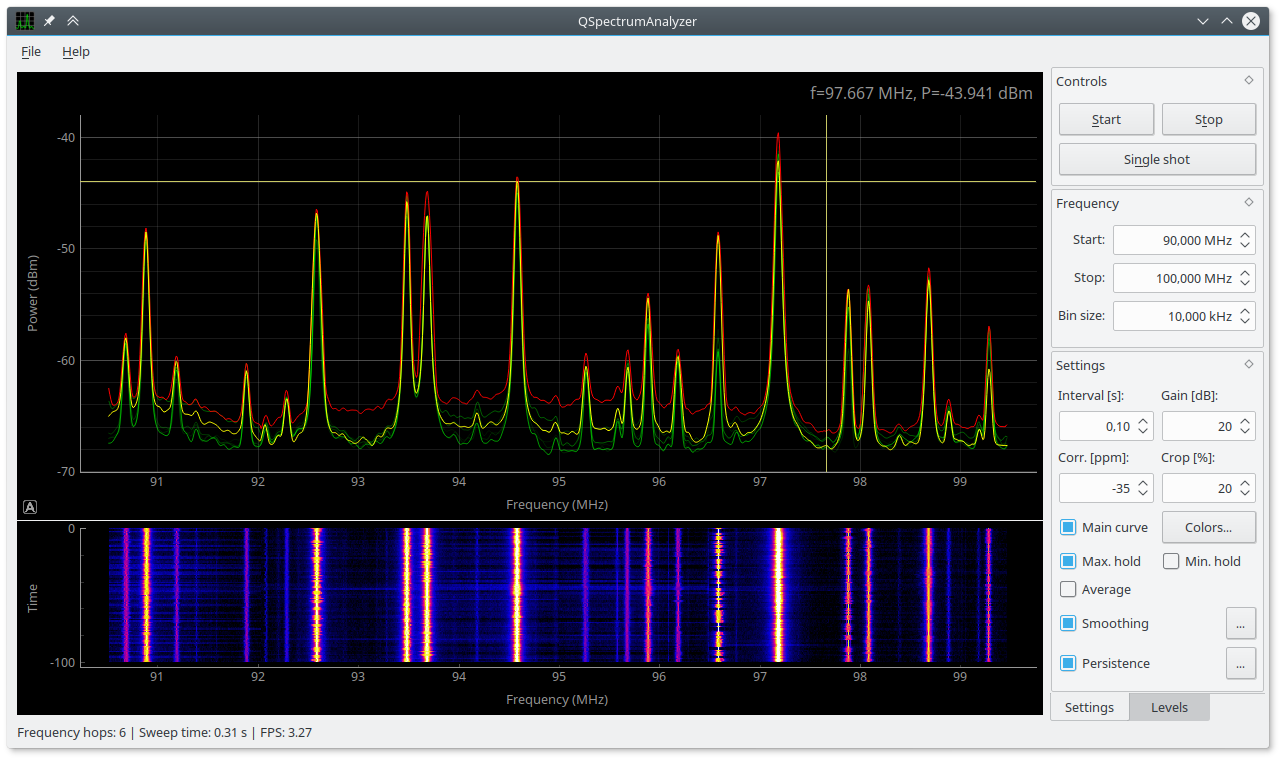
Screenshot
Requirements
Python >= 3.3
PyQt >= 4.5
PyQtGraph (http://www.pyqtgraph.org)
rtl-sdr (https://github.com/keenerd/rtl-sdr)
You should use Keenerds fork of rtl-sdr (latest Git revision), bacause rtl_power in original rtl-sdr (from osmocom.org) is broken (especially when used with cropping).
Usage
Start QSpectrumAnalyzer by running qspectrumanalyzer.
If you don’t have rtl_power executable in system path, you can specify location of it manually in File -> Settings. You can also specify waterfall plot history size in there. Default is 100 lines, be aware that really large sweeps (with a lot of bins) would require a lot of system memory, so don’t make this number too big.
Controls should be intuitive, but if you want consistent results, you should turn off automatic gain control (set it to some fixed number) and also set crop to 20% or more. For finding out ppm correction factor for your rtl-sdr stick, use kalibrate-rtl.
You can move and zoom plot with mouse, change plot settings or export plots from right-click menu. Waterfall plot black/white levels and color lookup table can be changed in mini-histogram widget.
1 maintainer

Metadata
1 maintainer
Release files for QSpectrumAnalyzer 1.1.1
For a detailed explanation of source distributions (sdists) and built distributions (wheels), please see the package formats documentation.
Source distribution (sdist)
| File | Size | Uploaded | |
|---|---|---|---|
| QSpectrumAnalyzer-1.1.1.tar.gz | 29.1 kB | Details |
Release files / QSpectrumAnalyzer-1.1.1.tar.gz
| Download URL | QSpectrumAnalyzer-1.1.1.tar.gz |
|---|---|
| Size | 29.1 kB |
| Tags | Source |
|
SHA-256 checksum How to use checksums |
d3f5dfaa846beb402d8f402f38c79f174815e11a1a062bd4ea7dbd581758e53e
|
|
BLAKE2b-256 checksum How to use checksums |
21c87e6346e56539bc001e405ff88becf14abbf6c77334a6d5864b3d684b1070
|
| Upload date | |
|
Uploaded using Trusted Publishing? What is trusted publishing? |
No |














