
RadViz-Plotly
| Latest Release |

|
| Examples |

|
| PyPI Downloads |

|
| License |

|
Overview
RadViz-Plotly is an open-source Python package designed for data scientists to create 2D and 3D Radial Visualization (RadViz) plots for high-dimensional datasets. These visualizations provide a comprehensive view of data distribution across dimensions, enabling better understanding and discovery of hidden insights. The package leverages the powerful interactive tools of the Plotly library.
Key Features
- 2DRadViz: Generates 2D Radial Visualizations.
- 3DRadViz: Creates 3D Radial Visualizations.
- 3DRadViz with Attribute Sorting: Creates 3D Radial Visualizations with intelligent attribute sorting based on correlation analysis.
- Interactive Visualizations: Zoom, filter labels, and rotate 3D graphs.
- Correlation-Based Grouping: Automatically groups highly correlated attributes and separates negatively correlated ones.
Quickstart
Try Online with Google Colab (Recommended)
Click the Colab badge above to open an interactive notebook demonstrating all three RadViz functions with the Breast Cancer dataset. No installation required - runs entirely in the cloud!
Steps:
- Click the Colab badge in the table above
- Wait for the notebook to load (~10 seconds)
- Run all cells (Runtime → Run all)
- Explore interactive visualizations
Try with Binder (Alternative)
Alternatively, you can try RadViz-Plotly using Binder:
- Click here to access interactive Jupyter notebooks. This repository contains three folders, each with datasets and a Jupyter notebook demonstrating RadViz-Plotly.
- Note: The Jupyter environment may take some time to load.
- Open one of the folders (e.g., Car Evaluation Dataset, Election Dataset, or Iris Dataset).
- Open the file with the
.ipynbextension (Jupyter notebook). - From the Cell menu in the toolbar, select Run All to execute the notebook.
Hints:
- The first run may take time to install dependencies.
- The package supports interactive features like zooming, filtering labels, and rotating 3D graphs.
- RadViz-Plotly depends on the Plotly library.
With Local Installation
- Install RadViz-Plotly using pip:
pip install RadViz-Plotly
- Clone the examples repository:
git clone https://github.com/elewah/RadViz-Plotly-Examples.git
Alternatively, download the repository as a ZIP file here. - Run the examples using Jupyter Lab to understand how to use the RadViz-Plotly package.
Gallery
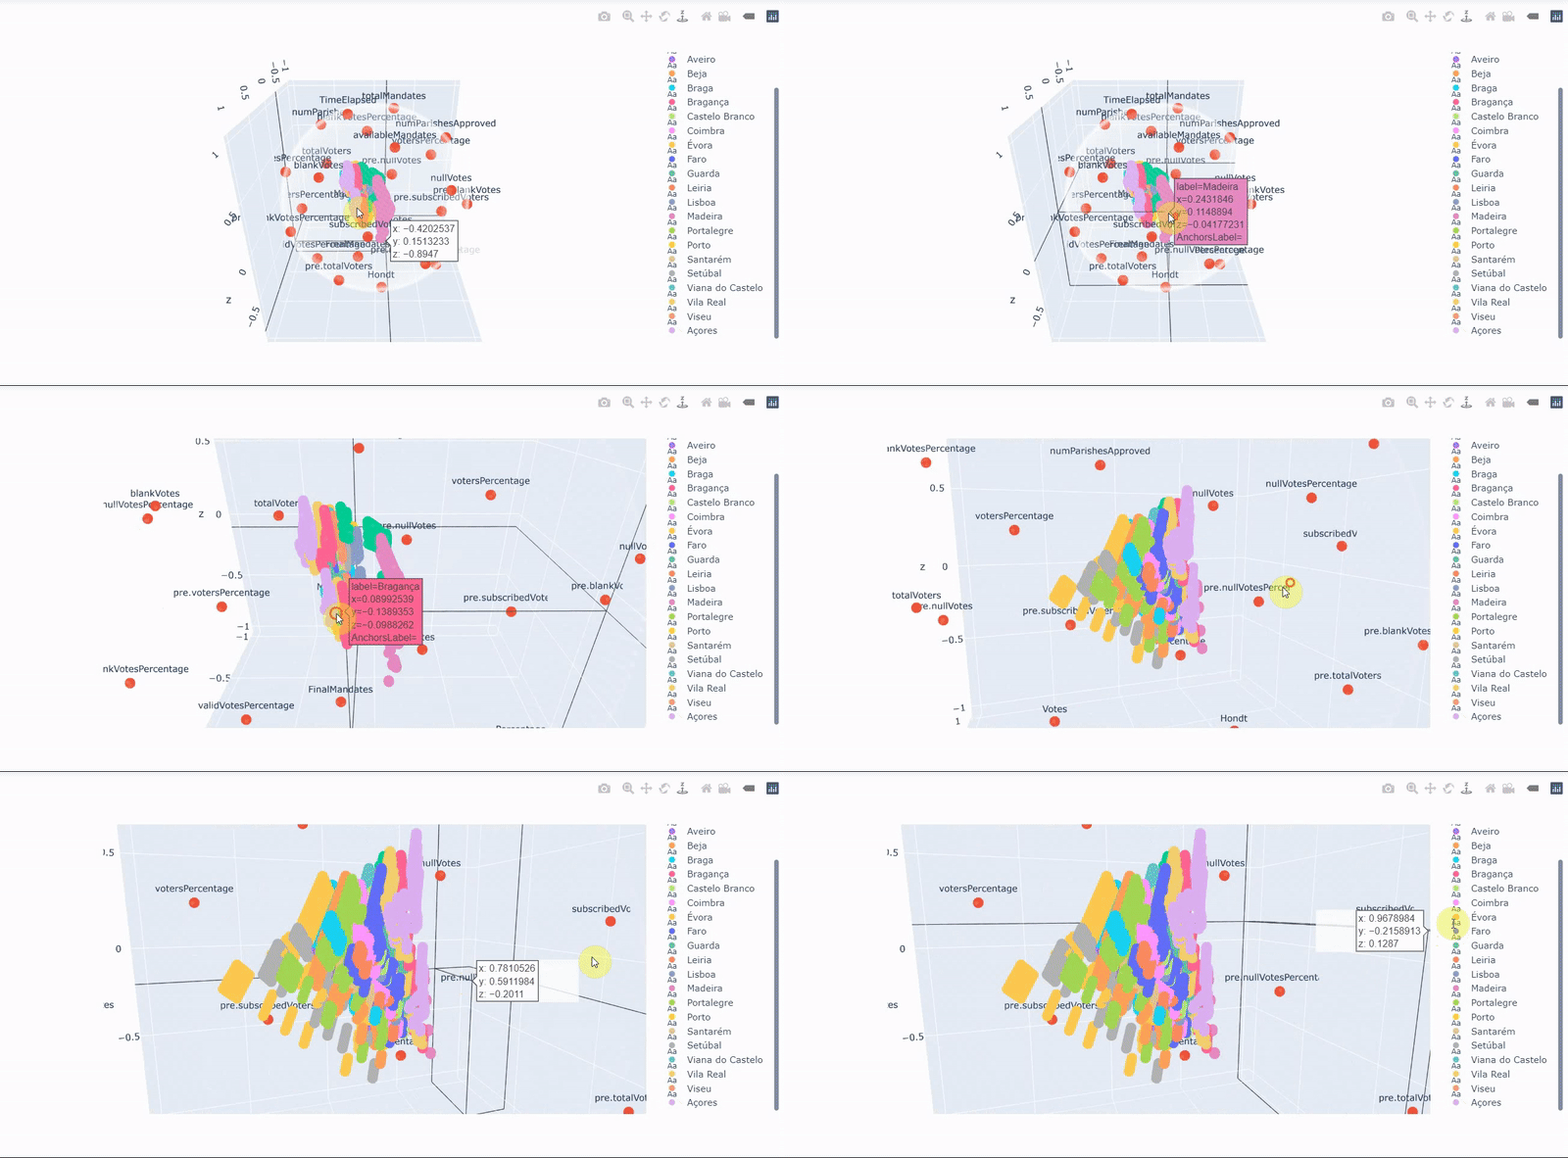
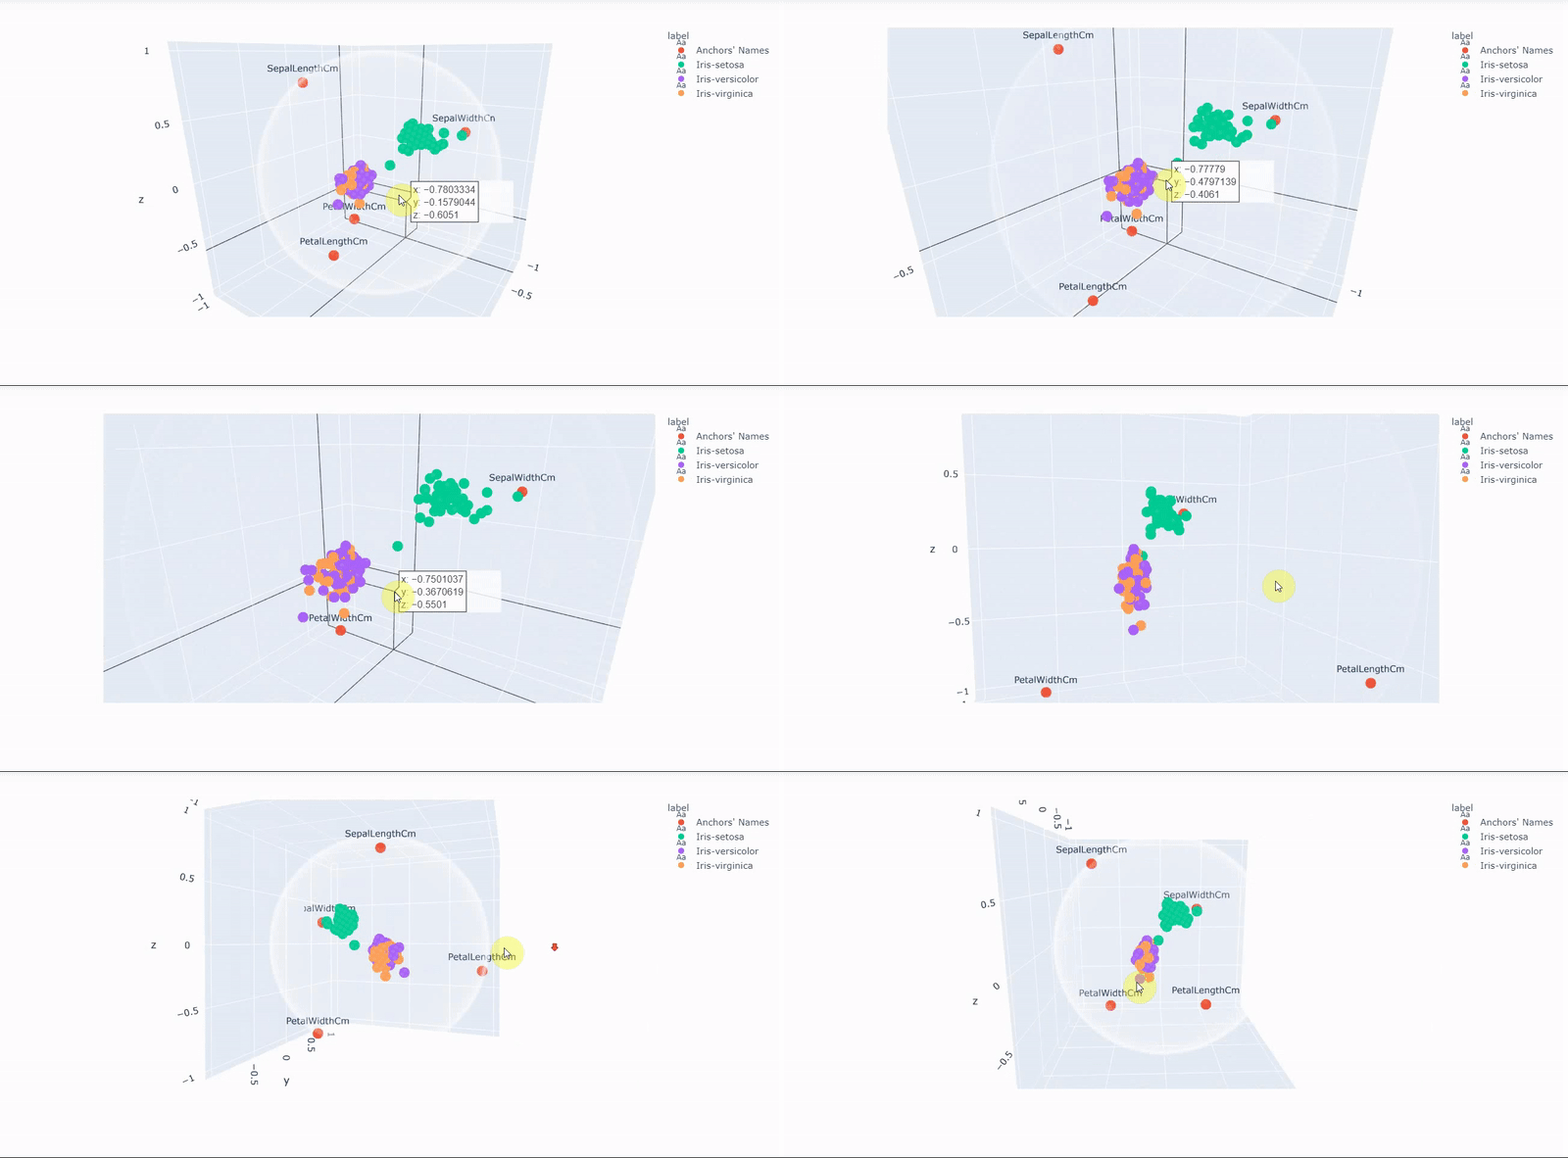
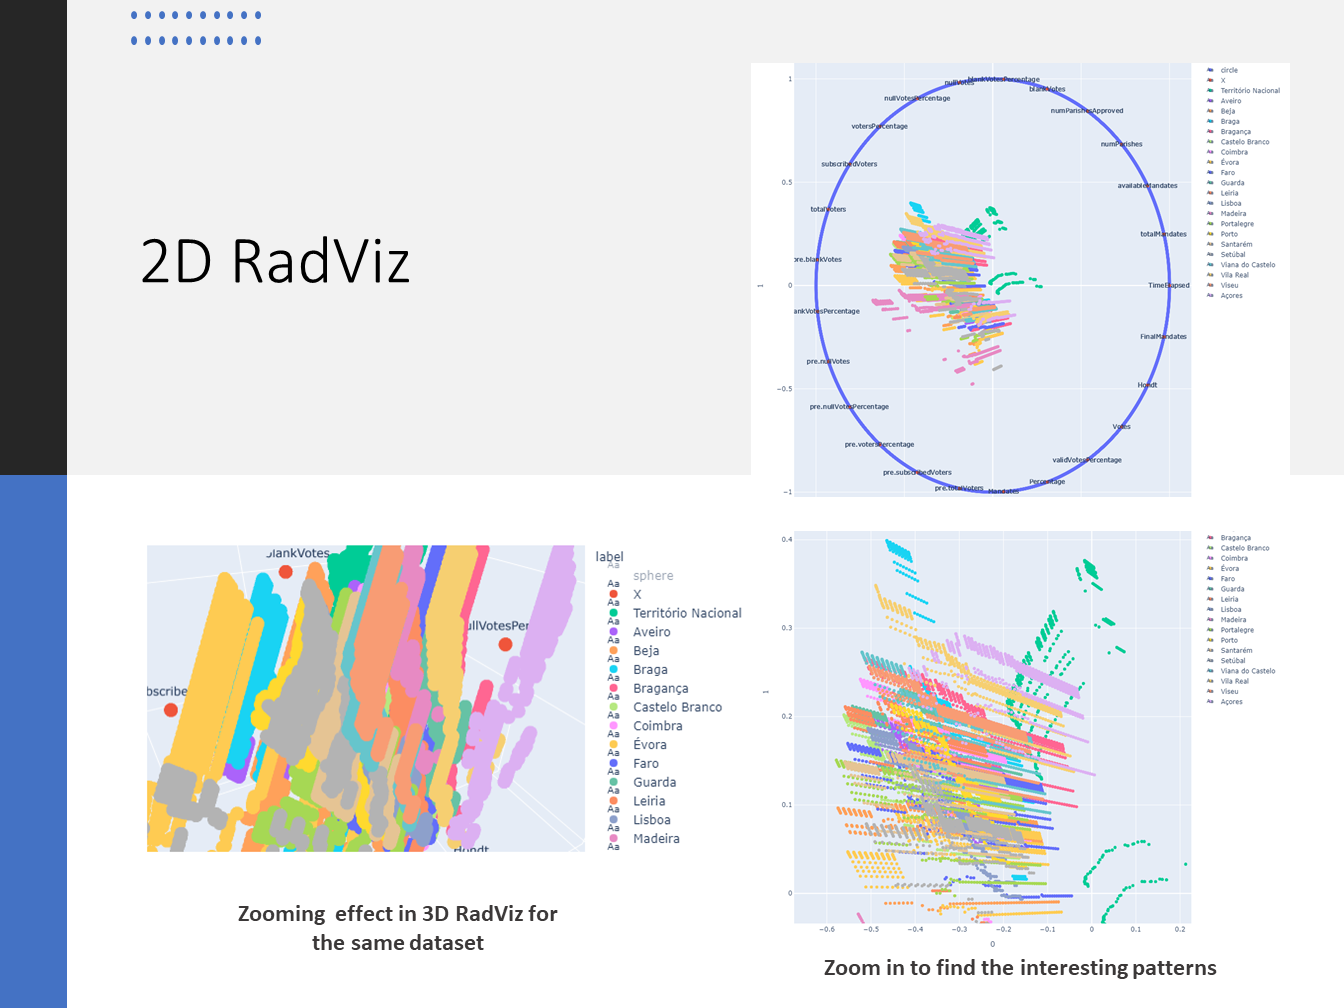
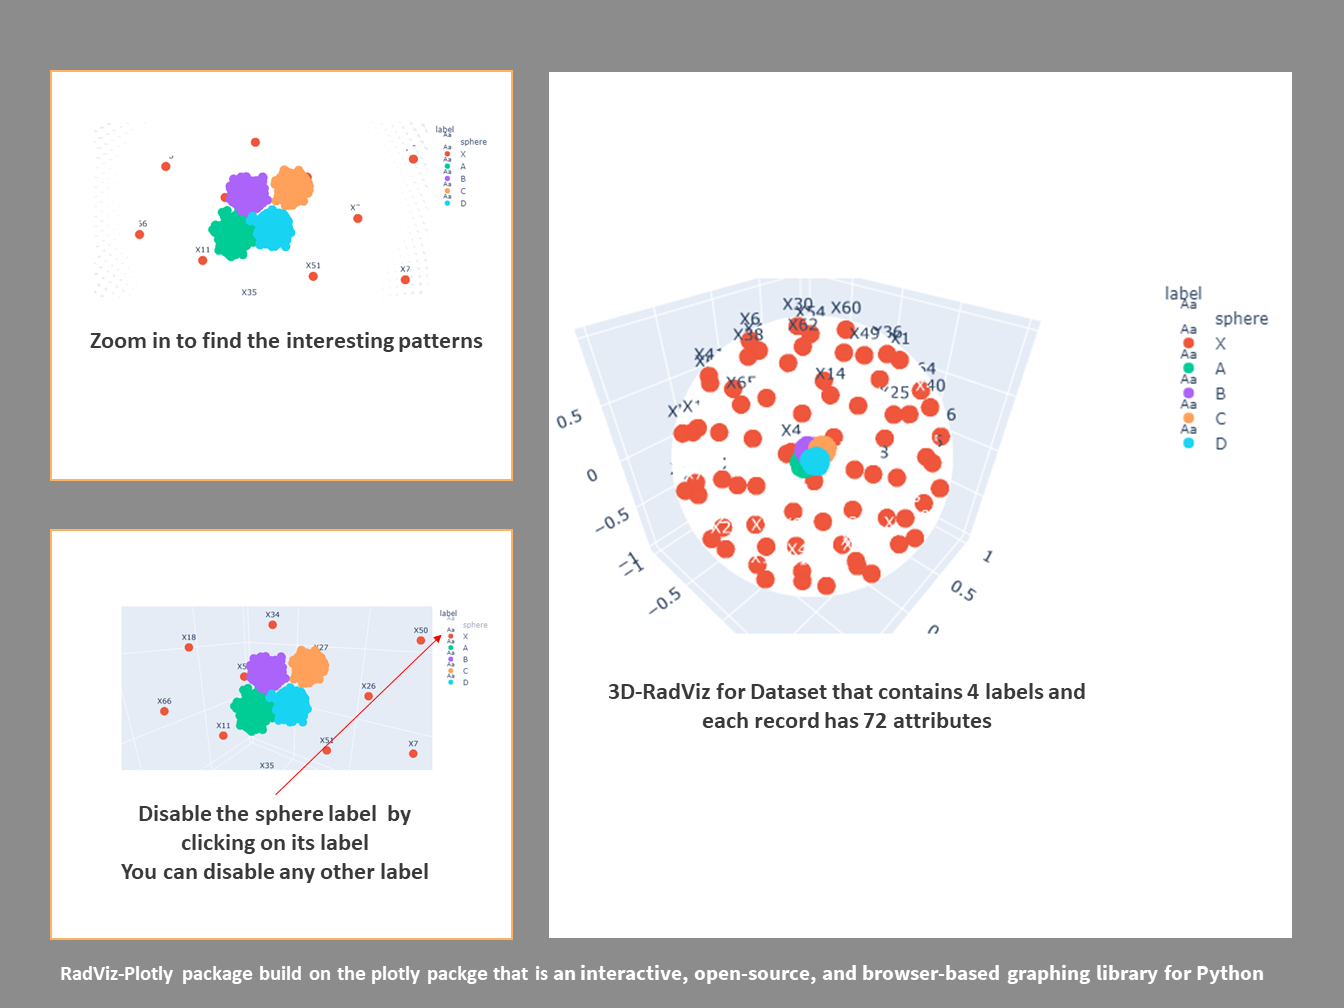
Interactive Visualizations
Explore live interactive HTML visualizations using the Breast Cancer dataset. These demos run directly in your browser with full Plotly interactivity (zoom, pan, rotate, filter labels):
- 2D RadViz Demo - 2D radial visualization on a circle
- 3D RadViz Demo - 3D radial visualization on a sphere
- 3D RadViz with Sorting Demo - 3D visualization with intelligent correlation-based attribute sorting
Note: HTML files are ~5MB each and may take a few seconds to load.
Usage Examples
Basic 2D RadViz
import pandas as pd
from radviz_plotly import RadViz2D

# Load your dataset
data = pd.read_csv('your_dataset.csv')
y = data['label']  # Labels column
X = data.drop(['label'], axis=1)  # Features

# Create 2D RadViz visualization
RadViz2D(y, X)
Basic 3D RadViz
import pandas as pd
from radviz_plotly import RadViz3D

# Load your dataset
data = pd.read_csv('your_dataset.csv')
y = data['label']  # Labels column
X = data.drop(['label'], axis=1)  # Features

# Create 3D RadViz visualization
RadViz3D(y, X, BPs=10000)  # BPs = Number of boundary points
3D RadViz with Attribute Sorting (New!)
This advanced feature automatically analyzes correlations between attributes and arranges the dimension anchors to minimize visual clutter and improve interpretability.
import pandas as pd
from radviz_plotly import RadViz3D_withSorting

# Load your dataset
data = pd.read_csv('your_dataset.csv')
y = data['label']  # Labels column
X = data.drop(['label'], axis=1)  # Features

# Create 3D RadViz with intelligent attribute sorting
RadViz3D_withSorting(y, X, BPs=10000)
How it works:
- Analyzes the correlation matrix of attributes
- Groups highly correlated attributes together
- Identifies negatively correlated attribute pairs
- Uses K-means clustering to determine optimal anchor positions on the sphere
- Arranges anchors to maximize distance between negatively correlated attributes
Installation with sorting support:
# Install with sorting dependencies
pip install RadViz-Plotly[sorting]

# Or install all extras including development tools
pip install RadViz-Plotly[sorting,dev]
Requirements for sorting:
- scikit-learn >= 0.24.0
- transformations >= 2020.1.1
Example with the Breast Cancer Dataset:
import pandas as pd
from radviz_plotly import RadViz3D_withSorting

# Load dataset
data = pd.read_csv('tests/DataFolder/BreastCancer.csv')
y = data['diagnosis']
X = data.drop(['diagnosis', 'id'], axis=1)

# Create visualization with sorting
RadViz3D_withSorting(y, X, BPs=5000)
About
RadViz-Plotly was developed by a research group at the IoT Lab, Ontario Tech University. It provides tools for creating 2D and 3D Radial Visualizations, enabling data scientists to explore high-dimensional datasets interactively.
Citation
If you use RadViz-Plotly in your research, please cite the following paper:
License
This project is licensed under the MIT License.


1 maintainer

Metadata
1 maintainer
Release files for radviz-plotly 0.3.0
For a detailed explanation of source distributions (sdists) and built distributions (wheels), please see the package formats documentation.
Source distribution (sdist)
| File | Size | Uploaded | Provenance | |
|---|---|---|---|---|
| radviz_plotly-0.3.0.tar.gz | 15.0 kB | Without provenance | Details |
Built distribution (wheel)
| File | Interpreter | ABI | Platform | Reset |
|---|---|---|---|---|
| radviz_plotly-0.3.0-py3-none-any.whl | Python 3 | none | any | Details |
Total release size: 37.2 kB
Release files / radviz_plotly-0.3.0.tar.gz
| Download URL | radviz_plotly-0.3.0.tar.gz |
|---|---|
| Size | 15.0 kB |
| Tags | Source |
|
SHA-256 checksum How to use checksums |
c39e3f76754551823df52a6dc21840cef037f1bbdc35e8c6c77802f0486b519a
|
|
BLAKE2b-256 checksum How to use checksums |
4df70ba7ce05807dc36bb3c31872d7dad4faf91459048e127683477700198552
|
| Upload date | |
|
Uploaded using Trusted Publishing? What is trusted publishing? |
No |
| Uploaded via |
poetry/2.3.2 CPython/3.14.3 Linux/6.14.0-1017-azure
|
Release files / radviz_plotly-0.3.0-py3-none-any.whl
| Download URL | radviz_plotly-0.3.0-py3-none-any.whl |
|---|---|
| Size | 22.2 kB |
| Tags | Python 3 |
|
SHA-256 checksum How to use checksums |
d739cdb7193e00e933aaeb7e6fe05eeba0ac9164efcfa33e83dc97cd8b38c5e5
|
|
BLAKE2b-256 checksum How to use checksums |
e05304c97e8a394a3ffec9d12ccbd7dddf941b7e30c3cc6cc2974909c8bd930a
|
| Upload date | |
|
Uploaded using Trusted Publishing? What is trusted publishing? |
No |
| Uploaded via |
poetry/2.3.2 CPython/3.14.3 Linux/6.14.0-1017-azure
|
Security for radviz-plotly 0.3.0
Provenance
Provenance describes where a file came from. On PyPI, provenance is shared via attestations, which provide a verifiable record of the build or publishing details. View details, limitations and caveats.
No provenance found
None of the files in this release were uploaded with provenance metadata.
A note on package security
PyPI is a repository for distributing packages, not a service for auditing them. While third-party security researchers and our staff do their best to detect and remove malicious packages, PyPI cannot guarantee the quality, security or suitability of any given package.














