A simple library to plot insightful charts
Project description
Analytics by Huytln - get a powerful and insightful visualizations just by 01 row code


analytics-huytln is a Python library designed to assist in data analysis through various charts and data visualizations. The goal of this library is to make it easier for analysts and data scientists to explore, analyze, and present their data.
Contents Overview
Features
- Easy Data Analysis: Provides powerful tools for data analysis with convenient functions and methods.
- Chart Creation: Supports various common charts for data visualization.
- Pareto chart
- Heatmap by timing
- High Compatibility: Works well with popular data formats such as CSV, Excel, JSON.
- User-Friendly: Offers a user-friendly functions that is easy to use and integrate into existing projects.
Installation
Install analytics-huytln via pip:
pip install analytics-huytln
Modules Usage
plot_pareto_chart
The plot_pareto_chart function creates a Pareto chart from Excel data.
Parameters pareto
- df (
pandas.DataFrame): DataFrame containing the data with dim_name (category) and metric (value) columns. - dim_name (
str): Name of the column representing the category (e.g., SKU). - metric (
str): Name of the column containing the values to analyze (e.g., Sales).
Usage pareto
Here's how to use the plot_pareto_chart function:
import pandas as pd
from analytics_huytln import plot_pareto_chart

# Read data from Excel file
df = pd.read_excel(r'C:\Users\huytln\Desktop\Linkedln post pdf\data_pareto.xlsx')

# Create a Pareto chart
plot_pareto_chart(df, 'SKU', 'Sales')
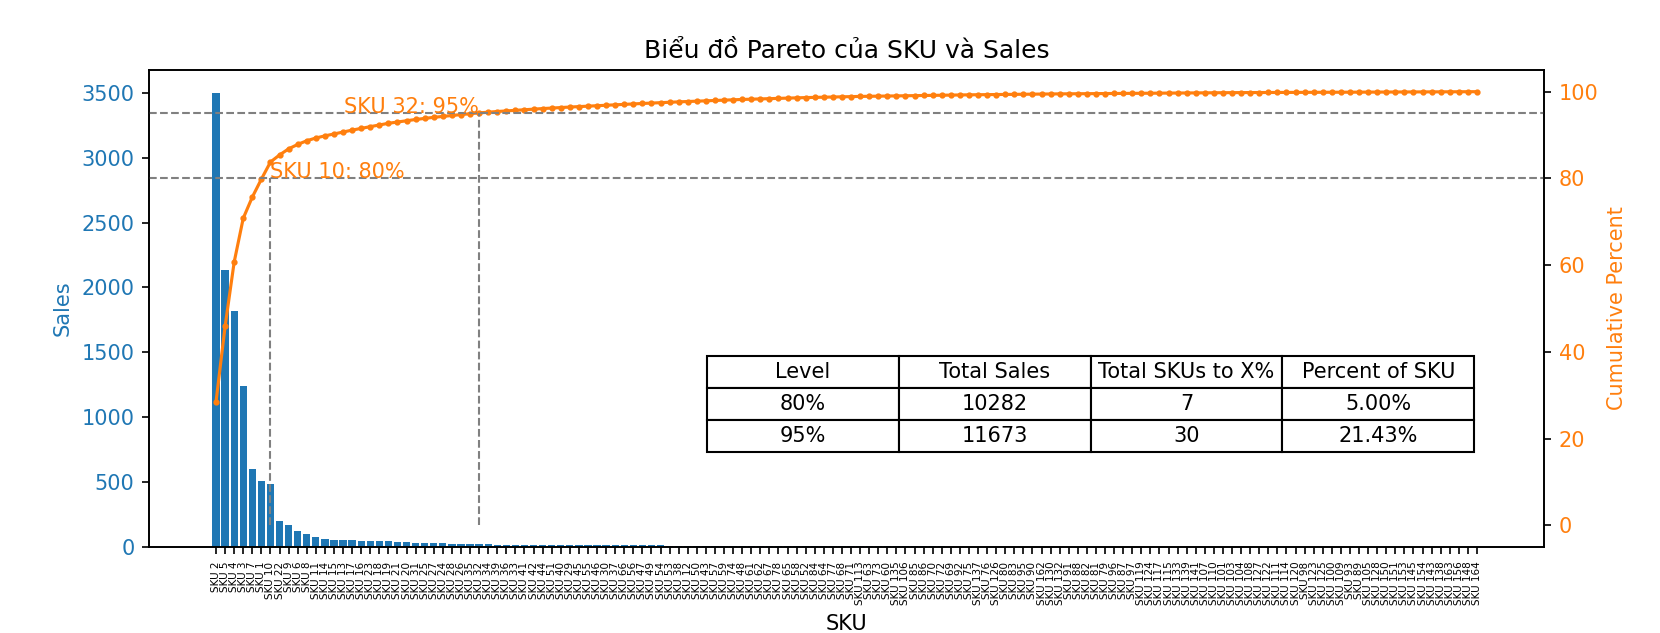
Output pareto

Analyse pareto
Chart Components:
- Histogram (Blue Bars): Represents the number of sales for each SKU. The SKUs are sorted in descending order of sales, with the most sold SKU on the left.
- Cumulative Percentage Curve (Orange Line): Represents the cumulative percentage of total sales as you move from left to right across the SKUs.
- The percentage curve helps identify the SKUs that contribute to a significant portion of the total sales.
- Horizontal Lines: Dotted lines at 80% and 95% cumulative sales percentage mark important thresholds.
- Annotations: The chart marks specific SKUs (SKU 10 and SKU 32) that correspond to the 80% and 95% cumulative sales levels.
Table:
- Level: Indicates the cumulative percentage levels (80% and 95%).
- Total Sales: The total number of sales up to the specified cumulative percentage.
- Total SKUs to X%: The number of SKUs contributing to the specified cumulative percentage.
- Percent of SKU: The percentage of SKUs contributing to the specified cumulative percentage of sales.
Analysis:
- 80% of Sales:
- SKU 10 is the last SKU contributing to 80% of total sales.
- Only 7 SKUs (5.00% of the total SKUs) are responsible for generating 80% of the sales. This indicates that a small number of SKUs are driving the majority of the sales, which is consistent with the Pareto principle (80/20 rule).
- 95% of Sales:
- SKU 32 is the last SKU contributing to 95% of total sales.
- 30 SKUs (21.43% of the total SKUs) contribute to 95% of the sales.
Conclusion: This Pareto chart visually emphasizes that a small fraction of SKUs contributes to a large fraction of total sales. This insight can help prioritize inventory management, marketing efforts, and sales strategies focusing on the top-performing SKUs.
heatmap_by_timing
The plot_heatmap_by_timing function creates a visual representation of sales data over time for different SKUs, with a focus on highlighting significant sales periods. The primary purposes of this chart are:
- Visualizing Sales Trends
- Highlighting Key Periods
- Understanding Sales Distribution
Parameters heatmap_by_timing
- df (
pandas.DataFrame): DataFrame containing the data with dim_name (category) and metric (value) columns. - dim_name (
str): Name of the column representing the category (e.g., SKU). - metric (
str): Name of the column containing the values to analyze (e.g., Sales). - highlight (
int): The number of top points to be highlighted.
Usage heatmap_by_timing
Here's how to use the heatmap_by_timing function:
import pandas as pd
from analytics_huytln import plot_heatmap_by_timing

# Read data from Excel file
df = pd.read_excel(r'C:\Users\huytln\Desktop\Linkedln post pdf\data_order_by_time.xlsx')

# Create a heatmap by timing and SKU with the top 10 highest sales points highlighted
plot_heatmap_by_timing(df, 'SKU', 'Sales', 10)
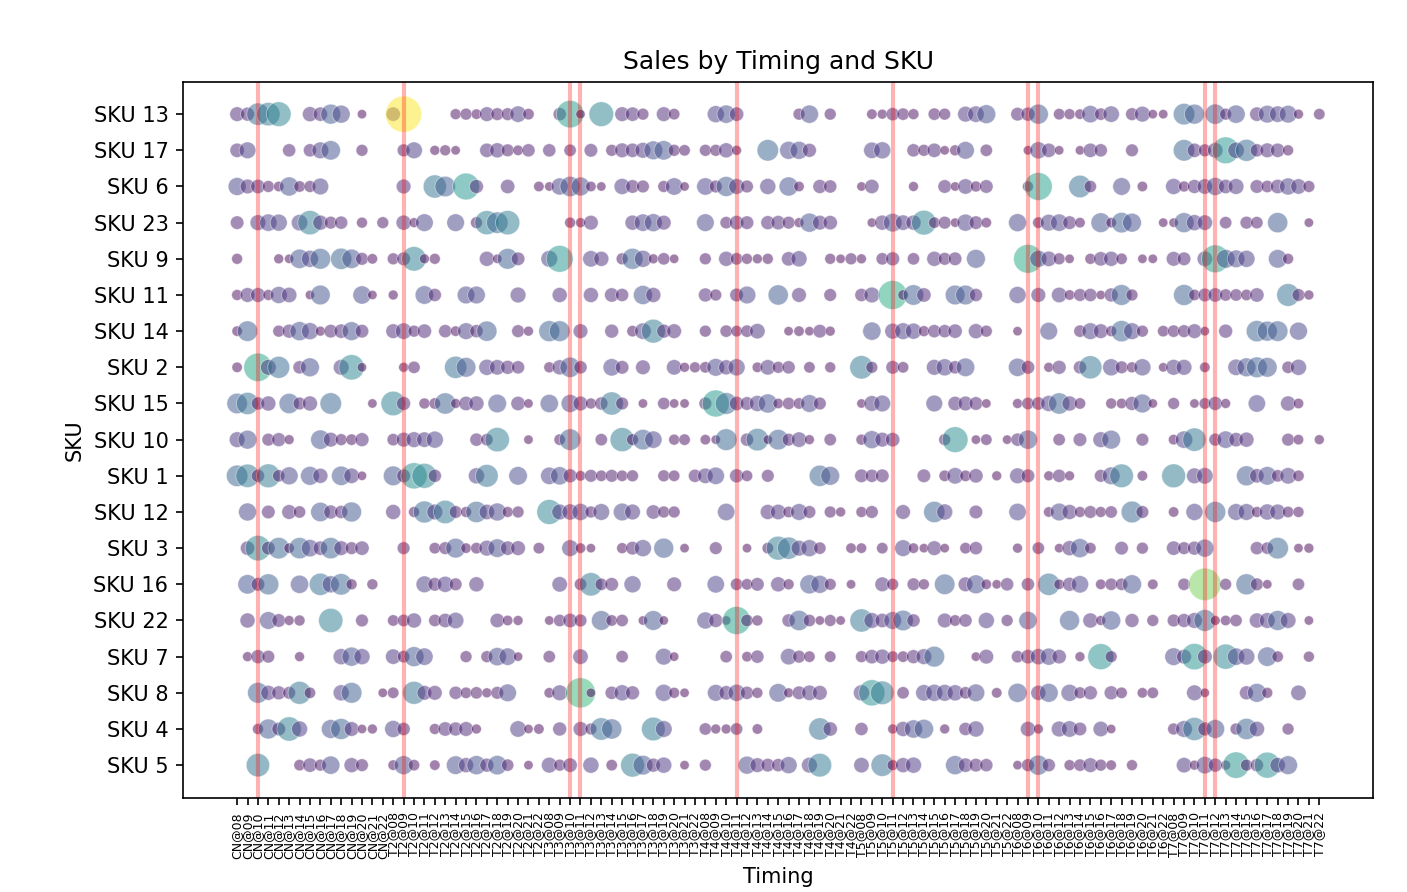
Output heatmap_by_timing

Analyse heatmap_by_timing
Chart Components:
- X-axis (Timing): The timing is represented as a concatenation of the day of the week and hour.
- Y-axis (SKU): Represents different SKUs, with each row dedicated to a specific SKU.
- Scatter Plot (Dots):
- Data Points: Each dot represents a sale of a specific SKU at a particular time.
- Color and Size: The dots vary in size and color, which represent the quantity of items sold. Larger dots indicate higher quantities or larger sales amounts.
- Vertical Lines (Red): These lines represent the times with the highest total sales across all SKUs.
Table: Time Periods: The chart could be segmented by specific time periods (days or hours) to analyze how sales performance fluctuates during these periods. Top SKUs: The distribution of sales across different SKUs can help identify top-performing SKUs at various times, similar to how a Pareto chart highlights top contributors.
Analysis:
Sales Concentration:
- There are visible clusters of sales activity at certain times, indicating peak periods where specific SKUs are more popular.
- The distribution suggests that certain SKUs have consistent sales across different times, while others may peak during specific hours or days.
Timing Patterns:
- The timing axis shows a dense clustering of sales at specific periods, which might correlate with customer behavior, promotional activities, or operational factors.
- The overlap of timing labels suggests that further aggregation or a different representation (e.g., hourly or daily aggregates) could provide clearer insights.
Impact of Vertical Lines:
- The red vertical lines likely mark significant time thresholds, which could be used to analyze how sales change before and after these periods.
- These lines might highlight the impact of certain events, such as promotions, holidays, or restocking, on sales patterns.
Conclusion: This scatter plot provides a comprehensive view of sales distribution across different SKUs and times. The clustering of dots and the variations in size and color reveal key insights into sales performance, indicating peak periods and top-performing SKUs. The vertical lines and timing axis add another layer of analysis, helping to identify the impact of specific time-based events or thresholds on sales trends. Overall, this chart can guide decision-making in inventory management, marketing strategies, and operational planning by highlighting when and which SKUs are driving sales.
Let me know if you need further analysis or any specific insights!
git clone https://github.com/trinhlenhathuy/analytics_huytln.git

cd analytics_huytln

python setup.py sdist bdist_wheel

twine upload --config-file C:\Users\huytln\analytics_huytln\.pypirc dist/*

twine upload --config-file .pypirc dist/*
Project details
Release history Release notifications | RSS feed
Download files
Download the file for your platform. If you're not sure which to choose, learn more about installing packages.
Source Distribution
Built Distribution
Hashes for analytics_huytln-0.2.2-py3-none-any.whl
| Algorithm | Hash digest | |
|---|---|---|
| SHA256 | 5e07cea5c4eace9678fe0de918a423854ad4e9df4c5103454a2ba16165f5be9b |
|
| MD5 | d7e7c452bcba2cd4f01351b717a1475e |
|
| BLAKE2b-256 | 557699eca47f88f3b899963c2d0ae1afcd9bebce4067131223b68499fd0dfd0b |


