
voice-agent-latency-lab
Where the 800ms goes in a cascaded voice agent, decomposed into four stages and reported at the tail.
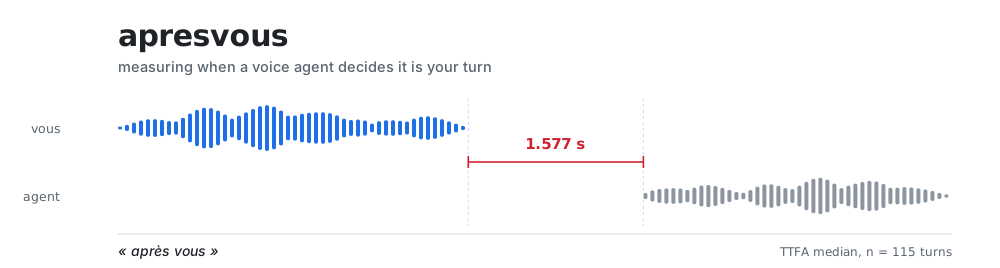
The wire-level half of this repository is apresvous, after the phrase for yielding a
turn that a voice agent never says. The banner draws what it measures: the caller stops, and
the bracket is how long they wait. Both numbers on it are measured, not illustrative.
A caller finishes a sentence and waits. This measures that wait, splits it into the four stages that produce it, and reports the distribution rather than the average.
TTFA = end_of_utterance_delay + llm_ttft + tts_ttfb
       └──────────┬──────────┘  └───┬───┘  └───┬───┘
        transcription + endpointing  LLM      TTS
The framework reports per component. A caller experiences per turn. Nothing bridges the two, so this does.
Results
LiveKit Agents 1.8.0, Deepgram nova-3, Gemini 3.5 Flash Lite (direct, not via gateway),
Cartesia sonic-3, Silero VAD, LiveKit audio turn detector v1. macOS, M3 Pro. English.
endpointing_ms=25. Console mode. 7 Sep 2026.
n = 10 completed turns, from one session. Not enough for P99. See Honest limits.
| Stage | P50 | P90 | max | share of P50 TTFA |
|---|---|---|---|---|
end_of_utterance_delay |
0.582s | 2.501s | 2.501s | 48% |
├─ transcription_delay |
0.361s | 1.256s | 1.515s | 30% |
└─ endpointing_delay |
0.269s | 1.112s | 2.253s | 22% |
llm_ttft |
0.423s | 0.482s | 0.498s | 35% |
tts_ttfb |
0.138s | 0.174s | 0.201s | 11% |
| TTFA | 1.201s | 3.029s | 3.043s |
The full session ledger, which is the part a percentile table normally hides: 12
speech_ids, 10 responded, 1 agent-initiated greeting, 1 speculative generation discarded,
0 unclassified. The table above is the 10.
An earlier session on 1.7.0 (24 Aug) gave TTFA P50 1.530s, P90 3.145s, max 17.065s.
Do not read the difference as an SDK improvement. Different conversation, different time
of day, and the LLM is a hosted service whose speed is not being controlled here. Almost all
of the gap is llm_ttft moving 0.605s to 0.423s, which is the one stage this setup has no
claim over. Both sessions are kept because the shape is reproducible, not the absolute.
Stage percentiles are marginal distributions. They do not sum to the TTFA percentile, because the worst turn for one stage is not the worst turn for another. Shares are computed at P50 only.
Four things that surprised me
1. transcription_delay varies 7x on one speaker in one session (0.211s to 1.515s),
at a fixed endpointing_ms=25. It is the first stage of the budget, almost nobody tunes it,
and it is the least stable. It is also not 25ms: endpointing_ms is one input to the
provider's finalisation decision, not the decision. The 1.7.0 session showed the same effect
at 4x, so the instability reproduces and its magnitude does not.
2. The turn detector is acoustic, and near-identical utterances get opposite decisions.
Measured on 1.7.0 and not re-run on 1.8.0, because EOTInferenceMetrics carries no
speech_id and so is not captured by the harness.
| Utterance | P(end of turn) | Decision |
|---|---|---|
| "Wait. Wait. Wait. Wait. Wait." | 0.915 | committed in 0.3s |
| "Wait. Wait. Wait. Wait." | 0.068 | held for 2.5s |
Same words, an order of magnitude apart. inference.TurnDetector() encodes audio directly
and scores prosody. No transcript-based model can produce that pair. It is also why an agent
feels inconsistent to its operator: the variable is one the speaker cannot hear themselves
changing.
3. The tail is the provider retrying, not the model being slow. On 1.7.0 one turn
recorded ttft=16.350s with cancelled=False and every other stage normal. It was a 504 and
a retry cycle under max_retry=3, retry_interval=2.0, timeout=10.0. Nothing in the metric
object says so; the only evidence was a WARNING line. A latency table that cannot separate
"slow" from "retried" is measuring provider availability while claiming to measure model
latency.
A single connection attempt cannot exceed its own per-attempt timeout, so ttft above it
proves at least one attempt was retried. The correlator will report that, but only if you
tell it the timeout you configured. It does not assume the SDK default, because the
deployment may not be using it. No retry occurred in the 1.8.0 session, which is why its max
is 3.043s rather than 17s: that is the difference between a good night and a bad one on
someone else's API, not a property of the stack.
4. end_of_utterance_delay is bimodal, and neither mode is a measurement of the speaker.
Seven of ten turns sat at 0.580s to 0.586s. Two sat at 2.5006s and 2.5011s, and the 1.7.0
session also produced one at 2.501s. A value that lands twice within half a millisecond
across two SDK versions is a ceiling, not a latency. It is not max_delay, which
defaults to 3.0s. I have not established what sets it, and it is on the roadmap rather than
in this table as a claim.
The endpointing floor nobody tunes
end_of_utterance_delay pins to ~0.582s on 7 of 10 turns, and did the same at ~0.578s on
1.7.0. That floor is not endpointing_ms and not min_delay. It is Silero VAD's
min_silence_duration=0.55, because min_delay behaves as max(VAD silence, min_delay).
The audio turn detector permits 0.25, so there is roughly 280ms available on every fast
turn, behind a parameter that appears in neither of the two knobs people reach for.
Reproducing across two SDK versions is what makes this worth stating. One caveat that is not
yet resolved: 1.8.0 ships a DynamicEndpointing that learns min_delay from the caller's
own pausing behaviour with an exponential moving average, clamped by a fixed max_delay. If
that is the active path, the floor is not a constant within a session and this measurement
is the start of it rather than the whole of it. Whether it is the default here has not been
checked, and it is on the roadmap.
The second stack, measured on the wire
huggingface/speech-to-speech v1.0.0, fully local on the same laptop, measured from outside
the process over the Realtime API it already exposes. No fork and no patch: the harness is an
external WebSocket client that streams recorded human speech and timestamps every server
event on arrival.
n = 115 turns. TTFA P50 1.577s, P90 2.298s, P99 3.192s.
The findings that do not appear in any total: endpointing is the one stage the wire cannot
see, because speech_stopped is emitted after the decision is already made;
response.created fires when the LLM finishes, so the wire cannot yield time-to-first-token
at any anchor; the endpointer held on 135 of 275 decisions and each hold costs about
600ms; and 61% of turns arrive as more than one speech segment, each revision restating
the whole utterance and costing LLM work that is then superseded.
Full write-up in REPORT-speech-to-speech.md.
There is no comparison table between the two stacks, on purpose. One runs three cloud APIs, the other runs fully local on a laptop. That difference dominates any total, so a shared table would say something about hosting while appearing to say something about architecture. The two halves measure from different vantage points and the contribution is what each one cannot see.
Honest limits
What this does not measure, which is what makes the rest worth reading:
- The network leg. Metrics stop at publication. Transit and the receiver's adaptive jitter buffer are invisible, and the buffer grows on a bad network. Real caller-perceived latency is higher than every number here.
- Console mode has no room. No WebRTC, no Opus encode/decode, no SFU. Three tiers exist, each strictly worse: console, browser over WebRTC, phone. This is the most optimistic.
- Not everything is local even so. The turn detector runs on LiveKit Inference and the
adaptive interruption detector calls
agent-gateway.livekit.cloud. There is network in the turn-taking path, from Lille. - n=10. P99 at n=10 is the maximum, not a percentile. P99 needs n≥100 per configuration, which is not reachable by hand. P90 is reported; P99 is not.
- One speaker, one language, one session. No claim about anyone else's voice.
- The greeting is excluded. Agent-initiated, so no end-of-utterance exists and TTFA is undefined. Excluded by construction, counted separately.
Correlation, and why it is not a GROUP BY
EOUMetrics, LLMMetrics and TTSMetrics share a speech_id. STTMetrics, VADMetrics
and EOTInferenceMetrics do not, because STT and VAD run continuously over the input and
are not scoped to an utterance.
Six things break the naive join, all observed in a two-minute conversation:
- Events arrive out of order. Verified independent across 200 shuffles and full reversal.
- Nothing marks a turn finished. Completeness is defined as "all TTFA fields present".
- STT and VAD cannot be joined at all.
- Turns that never produce audio. Excluded from the table, and counted. Reproducible by
interrupting inside the first word of a reply: one such turn recorded a 2.501s
end-of-utterance and a healthy
ttft=0.577swithcancelled=False, and played nothing. Every latency metric for it looked fine. A table that drops these silently reports good numbers for a caller who heard silence. - Agent-initiated turns have no end-of-utterance.
preemptive_generationis on by default. On 1.7.0, 21LLMMetricsacross 11 turns, 21 distinctspeech_ids, none cancelled: the LLM is dispatched speculatively on partial transcripts and 9 generations were discarded. Roughly 2x the LLM calls, and the bill. The Still on by default in 1.8.0, and the multiplier is set by the caller, not by the config. Two sessions on the same SDK with the same settings, differing only in how the caller spoke: 1.2 LLM calls per responded turn when speaking cleanly with full stops, and 2.4 when chunking sentences with rising prosody and interrupting. A hesitant caller roughly doubles the LLM bill of a fluent one. If your users pause mid-sentence, and in most public-facing deployments they do, the config is not what determines the spend.
The scenario
A narrow slot-filling task: booking a civil ceremony at a fictional city hall, with a fixed list of available slots. Deliberately not a general assistant. A fixed script against a bounded task is what makes turns comparable between runs; an open-domain agent produces conversations of varying length and shape and the comparison stops meaning anything.
The prompt is written for voice, not chat: no markdown, no lists, no symbols, because every
character is spoken. An earlier version carried the voice-realism sections from the LiveKit
prompting guide, which emit SSML <break> tags into the text stream. Those appeared in 100%
of assistant turns, land in TTSMetrics.characters_count, and add real audio if the
provider honours them. Removed, because they contaminate the thing being measured.
Run it
uv sync
cp .env.example .env.local          # fill in your keys
uv run python src/apresvous/agent.py console
uv run pytest                        # 51 tests, see docs/TESTING.md
uv run python tools/replay_log.py <logfile>
What is next
Milestones and acceptance criteria are in ROADMAP.md.
- P90 at n≥100 per configuration, which needs an automated caller.
- The same decomposition against a second architecture that shares no event model.
- French. English STT mangles French proper nouns badly enough that the same agent is unusable for a francophone caller, which is fine for measurement and disqualifying for anything else. Quantifying that delta is its own result.
Corrections
Claims made here that turned out to be wrong are recorded in CORRECTIONS.md rather than quietly edited.
Licence
Apache-2.0.
1 maintainer

Download files
Download the file for your platform. If you're not sure which to choose, learn more about installing packages.
Source Distribution
Built Distribution
Filter files by name, interpreter, ABI, and platform.
If you're not sure about the file name format, learn more about wheel file names.
Copy a direct link to the current filters
File details
Details for the file apresvous-0.2.1.tar.gz.
File metadata
- Download URL: apresvous-0.2.1.tar.gz
- Upload date:
- Size: 246.1 kB
- Tags: Source
- Uploaded using Trusted Publishing? Yes
- Uploaded via:
twine/7.0.0 CPython/3.13.14
File hashes
| Algorithm | Hash digest | |
|---|---|---|
| SHA256 |
65baea4d03290576f752ca32668a98b82d507f054f0b3550050642ab63226424
|
|
| MD5 |
4a89d05ad4aef92cc3259f39b4604479
|
|
| BLAKE2b-256 |
3396f19664ce2266091e51a20cc2c76bb69034c54fee9748fea347eb09c1fd31
|
Provenance
The following attestation bundles were made for apresvous-0.2.1.tar.gz:
Publisher:
publish.yml on brijmohan/voice-agent-latency-lab
-
Statement:
-
Statement type:
https://in-toto.io/Statement/v1 -
Predicate type:
https://docs.pypi.org/attestations/publish/v1 -
Subject name:
apresvous-0.2.1.tar.gz -
Subject digest:
65baea4d03290576f752ca32668a98b82d507f054f0b3550050642ab63226424 - Sigstore transparency entry: 2781494825
- Sigstore integration time:
-
Permalink:
brijmohan/voice-agent-latency-lab@711252b7cf694b8dac3afce8b836fd66084cc932 -
Branch / Tag:
refs/tags/v0.2.1 - Owner: https://github.com/brijmohan
-
Access:
public
-
Token Issuer:
https://token.actions.githubusercontent.com -
Runner Environment:
github-hosted -
Publication workflow:
publish.yml@711252b7cf694b8dac3afce8b836fd66084cc932 -
Trigger Event:
release
-
Statement type:
File details
Details for the file apresvous-0.2.1-py3-none-any.whl.
File metadata
- Download URL: apresvous-0.2.1-py3-none-any.whl
- Upload date:
- Size: 33.8 kB
- Tags: Python 3
- Uploaded using Trusted Publishing? Yes
- Uploaded via:
twine/7.0.0 CPython/3.13.14
File hashes
| Algorithm | Hash digest | |
|---|---|---|
| SHA256 |
92bc04f2f009ce057e8c9d32b24a084b0737c6307c54bf9b3c27d6264729e11b
|
|
| MD5 |
110b48408458991066b1e616959b70df
|
|
| BLAKE2b-256 |
e8fe77db11bc170a7675e1ca8b37e7c8f5770c1f3d3d9d6d5efe4fd8c96a01c6
|
Provenance
The following attestation bundles were made for apresvous-0.2.1-py3-none-any.whl:
Publisher:
publish.yml on brijmohan/voice-agent-latency-lab
-
Statement:
-
Statement type:
https://in-toto.io/Statement/v1 -
Predicate type:
https://docs.pypi.org/attestations/publish/v1 -
Subject name:
apresvous-0.2.1-py3-none-any.whl -
Subject digest:
92bc04f2f009ce057e8c9d32b24a084b0737c6307c54bf9b3c27d6264729e11b - Sigstore transparency entry: 2781495587
- Sigstore integration time:
-
Permalink:
brijmohan/voice-agent-latency-lab@711252b7cf694b8dac3afce8b836fd66084cc932 -
Branch / Tag:
refs/tags/v0.2.1 - Owner: https://github.com/brijmohan
-
Access:
public
-
Token Issuer:
https://token.actions.githubusercontent.com -
Runner Environment:
github-hosted -
Publication workflow:
publish.yml@711252b7cf694b8dac3afce8b836fd66084cc932 -
Trigger Event:
release
-
Statement type:














