
autogpy - AutoGnuplot.py
Automatic generation of gnuplot figures/scripts/data from python.
Author: Alessandro Corbetta, 2019
Documentation: https://acorbe.github.io/autogpy/

Which problem does it solve?
autogpy eliminates annoying duplications of code/data when doing data analytics in python and publication figures in gnuplot. Using a syntax close to gnuplot, it automatically generates gnuplot scripts and dumps suitably the data.
In the scientific community, gnuplot is a gold standard for publication-quality plots. Python is quickly becoming a tool of choice for data analytics. While it comes with several options for plotting, often gnuplot is preferred in production.
Features
- anything that be obtained by the gnuplot command
plotcan be produced - any gnuplot state modification can be achieved
- multiplots
plt.hist-like gnuplot histogram figures generator- jupyter notebook figure preview
- jupyter notebook gnuplot script inspection
- gnuplot terminals epslatex, tikz/pgfplot and jpg
- output figures are shipped in a folder that includes scripts, data and makefile
- easy scp-based synchronization between a machine in which the figures are generated (e.g. from even larger datasets) and the "paper writing" machine.
Works on
- Linux/MacOs
- Python 3
KWONW ISSUES
- Certain features require imagemagick and a working
gnuplot-tikz.lua. Some versions of these might have bugs. Dofigure.display_fixes()to show known fixes.
In a nutshell
Getting autogpy
From pip
pip install autogpy
From source
git clone git@github.com:acorbe/autogpy.git
pip install ./autogpy
Usage
import autogpy
import numpy as np

xx = np.linspace(0,6,100)
yy = np.sin(xx)
zz = np.cos(xx)

figure = autogpy.AutogpyFigure("test_figure","test1")

figure.p_generic(r'u 1:2 with lines t "sin"',xx,yy)
figure.p_generic(r'u 1:2 with lines t "cos"',xx,zz)
figure.generate_gnuplot_file()

figure.jupyter_show_pdflatex() # only in jupyter
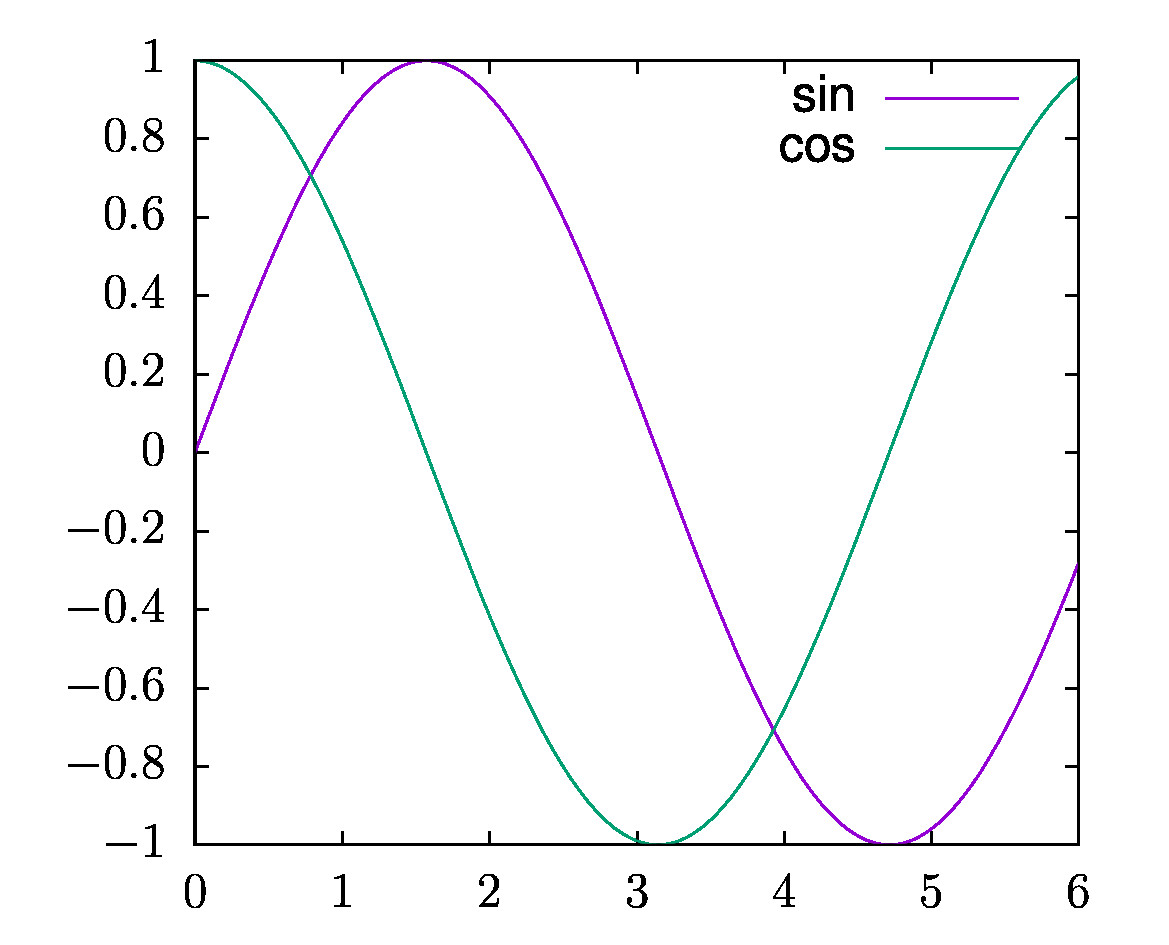
will generate the following figure (also appearing in jupyter)
Most importantly, the following source and data will be created in the folder test_figure
$ ls test_figure

Makefile
sync_me.sh
test1__0__.dat
test1__1__.dat
test1__.core.gnu
test1__.jpg.gnu
test1__.pdflatex_compile.sh
test1__.pdflatex.gnu
test1__.tikz_compile.sh
test1__.tikz.gnu
With make one can obtain jpg, epslatex, and tikz/pgfplot versions of the figure.
Notice that the input data has been formatted automatically.
Inspecting test1__.pdflatex.gnu, responsible of the epslatex version of the figure, one gets:
set terminal epslatex size 9.9cm,8.cm color colortext standalone      'phv,12 '  linewidth 2
set output 'fig.latex.nice/plot_out.tex'

load "test1__.core.gnu";
while test1__.core.gnu reads:
p "test1__0__.dat" u 1:2 with lines t "sin",\
"test1__1__.dat" u 1:2 with lines t "cos"
1 maintainer

Metadata
1 maintainer
Release files for autogpy 0.1.4
For a detailed explanation of source distributions (sdists) and built distributions (wheels), please see the package formats documentation.
Source distribution (sdist)
| File | Size | Uploaded | Provenance | |
|---|---|---|---|---|
| autogpy-0.1.4.tar.gz | 13.5 kB | Without provenance | Details |
Release files / autogpy-0.1.4.tar.gz
| Download URL | autogpy-0.1.4.tar.gz |
|---|---|
| Size | 13.5 kB |
| Tags | Source |
|
SHA-256 checksum How to use checksums |
1fa12364d53d6f9005d847edd881ef20287bd385189d89f218c31267a45aab51
|
|
BLAKE2b-256 checksum How to use checksums |
d7276c95e67fd118904276ad01b440c78ec5b68aa26719b5d6c29eae1cc2889e
|
| Upload date | |
|
Uploaded using Trusted Publishing? What is trusted publishing? |
No |
| Uploaded via |
twine/1.13.0 pkginfo/1.4.2 requests/2.21.0 setuptools/41.0.1 requests-toolbelt/0.9.1 tqdm/4.28.1 CPython/3.7.3
|
Security for autogpy 0.1.4
Provenance
Provenance describes where a file came from. On PyPI, provenance is shared via attestations, which provide a verifiable record of the build or publishing details. View details, limitations and caveats.
No provenance found
None of the files in this release were uploaded with provenance metadata.
A note on package security
PyPI is a repository for distributing packages, not a service for auditing them. While third-party security researchers and our staff do their best to detect and remove malicious packages, PyPI cannot guarantee the quality, security or suitability of any given package.














