
bashplot
A picture in the terminal is worth a thousand records in the dataset.
| PyPi | Build Status | Style |
|---|---|---|
  |
   |
  |
Instant data plotting from the terminal into the terminal.
Working with data on an HPC, server, or Cloud can become challenging without
graphical interfaces. The most intuitive way to identify trends, patterns, and
forms is by using a figure. bashplot allows visualizing data instantaneously
as a figure just straight in the terminal, for three good reasons and more:
- Primarily working with Cloud or web services makes it sometimes necessary to
plot the results straight in the terminal. This request can be caused by
safety politics, company rules, or missing functionality/ports for sftp.
Struggling with downloading figure images from the Cloud to a locally
installed image viewer like preview has motivated developing
bashplot. - Even if a local download from a Cloud service to the locally installed image reader is possible, the process just needs more time because data has to be first generated and saved with matplotlib, then downloaded, and finally load into the memory of the software. Yes, and every download costs money, even if not much.
- Finally,
bashplotis also created to use the CI/CD pipeline like TravisCI, GitHub Action, or Azure DevOps as a little benchmark center, which allows you to get the first idea about your program's performance ML/models.
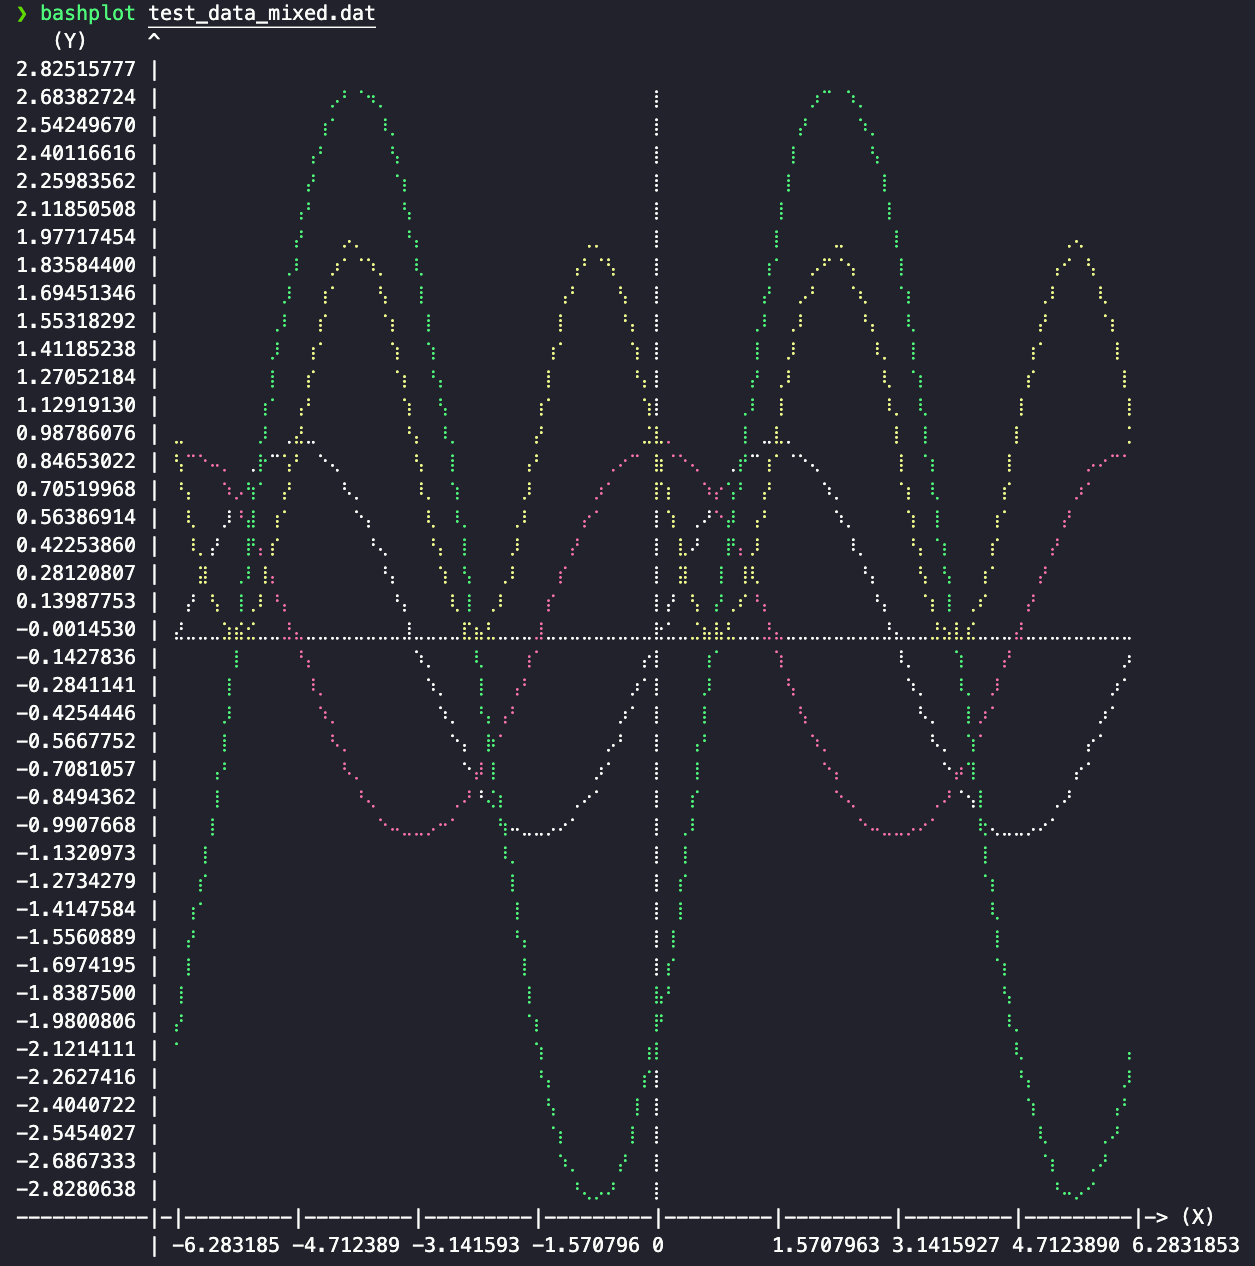
bashplot can visualize your data directly into your terminal window via the
command line and gives the first idea about the trends in your data.
Furthermore, it can be built into your code so you can check the data in a
simple ASCII file without installing graphical routines for generating images.
╰─ bashplot test_data_cos.txt -sz 15 15 -y -1.01 +1.01
   (Y)     ^
1.01000000 |
0.87533333 | ⠀⠉⠢⢄⠀⠀⠀⠀⠀⠀⠀⠀⠀⠀⠀⠀⠀⠀⠀⠀⠀⠀⠀⠀⠀⠀⠀⠀⠀⠀⠀⠀⠀⠀⠀⠀⠀⡔⠊⠉⡏⠉⠒⢄⠀⠀⠀⠀⠀⠀⠀⠀⠀⠀⠀⠀⠀⠀⠀⠀⠀⠀⠀⠀⠀⠀⠀⠀⠀⠀⠀⠀⠀⠀⠀⠀⢀⠔⠊⠁
0.74066667 | ⠀⠀⠀⠀⢣⠀⠀⠀⠀⠀⠀⠀⠀⠀⠀⠀⠀⠀⠀⠀⠀⠀⠀⠀⠀⠀⠀⠀⠀⠀⠀⠀⠀⠀⠀⢠⠊⠀⠀⠀⡇⠀⠀⠈⢢⠀⠀⠀⠀⠀⠀⠀⠀⠀⠀⠀⠀⠀⠀⠀⠀⠀⠀⠀⠀⠀⠀⠀⠀⠀⠀⠀⠀⠀⠀⢠⠃⠀⠀⠀
0.60600000 | ⠀⠀⠀⠀⠀⠣⡀⠀⠀⠀⠀⠀⠀⠀⠀⠀⠀⠀⠀⠀⠀⠀⠀⠀⠀⠀⠀⠀⠀⠀⠀⠀⠀⠀⡠⠃⠀⠀⠀⠀⡇⠀⠀⠀⠀⠣⡀⠀⠀⠀⠀⠀⠀⠀⠀⠀⠀⠀⠀⠀⠀⠀⠀⠀⠀⠀⠀⠀⠀⠀⠀⠀⠀⠀⢰⠁⠀⠀⠀⠀
0.47133333 | ⠀⠀⠀⠀⠀⠀⢣⠀⠀⠀⠀⠀⠀⠀⠀⠀⠀⠀⠀⠀⠀⠀⠀⠀⠀⠀⠀⠀⠀⠀⠀⠀⠀⡰⠁⠀⠀⠀⠀⠀⡇⠀⠀⠀⠀⠀⠱⡀⠀⠀⠀⠀⠀⠀⠀⠀⠀⠀⠀⠀⠀⠀⠀⠀⠀⠀⠀⠀⠀⠀⠀⠀⠀⢰⠁⠀⠀⠀⠀⠀
0.33666667 | ⠀⠀⠀⠀⠀⠀⠀⢣⠀⠀⠀⠀⠀⠀⠀⠀⠀⠀⠀⠀⠀⠀⠀⠀⠀⠀⠀⠀⠀⠀⠀⠀⡰⠁⠀⠀⠀⠀⠀⠀⡇⠀⠀⠀⠀⠀⠀⠱⡀⠀⠀⠀⠀⠀⠀⠀⠀⠀⠀⠀⠀⠀⠀⠀⠀⠀⠀⠀⠀⠀⠀⠀⢠⠃⠀⠀⠀⠀⠀⠀
0.20200000 | ⠀⠀⠀⠀⠀⠀⠀⠀⢣⠀⠀⠀⠀⠀⠀⠀⠀⠀⠀⠀⠀⠀⠀⠀⠀⠀⠀⠀⠀⠀⠀⡰⠁⠀⠀⠀⠀⠀⠀⠀⡇⠀⠀⠀⠀⠀⠀⠀⠱⡀⠀⠀⠀⠀⠀⠀⠀⠀⠀⠀⠀⠀⠀⠀⠀⠀⠀⠀⠀⠀⠀⢠⠃⠀⠀⠀⠀⠀⠀⠀
0.06733333 | ⠀⠀⠀⠀⠀⠀⠀⠀⠀⢣⠀⠀⠀⠀⠀⠀⠀⠀⠀⠀⠀⠀⠀⠀⠀⠀⠀⠀⠀⠀⢠⠃⠀⠀⠀⠀⠀⠀⠀⠀⡇⠀⠀⠀⠀⠀⠀⠀⠀⢣⠀⠀⠀⠀⠀⠀⠀⠀⠀⠀⠀⠀⠀⠀⠀⠀⠀⠀⠀⠀⢠⠃⠀⠀⠀⠀⠀⠀⠀⠀
-0.0673333 | ⠒⠒⠒⠒⠒⠒⠒⠒⠒⢳⠒⠒⠒⠒⠒⠒⠒⠒⠒⠒⠒⠒⠒⠒⠒⢒⠞⠒⠒⠒⠒⠒⠒⠒⠒⡗⠒⠒⠒⠒⠒⠒⠒⠒⢗⠒⠒⠒⠒⠒⠒⠒⠒⠒⠒⠒⠒⠒⠒⠒⢲⠓⠒⠒⠒⠒⠒⠒⠒⠒⠒⠒⠒⠒⠒⠒⠒⠒⠒⠒⠒
-0.2020000 | ⠀⠀⠀⠀⠀⠀⠀⠀⠀⠀⠀⢇⠀⠀⠀⠀⠀⠀⠀⠀⠀⠀⠀⠀⠀⠀⠀⠀⠀⡜⠀⠀⠀⠀⠀⠀⠀⠀⠀⠀⡇⠀⠀⠀⠀⠀⠀⠀⠀⠀⠘⡄⠀⠀⠀⠀⠀⠀⠀⠀⠀⠀⠀⠀⠀⠀⠀⠀⢀⠎⠀⠀⠀⠀⠀⠀⠀⠀⠀⠀
-0.3366667 | ⠀⠀⠀⠀⠀⠀⠀⠀⠀⠀⠀⠘⡄⠀⠀⠀⠀⠀⠀⠀⠀⠀⠀⠀⠀⠀⠀⠀⡜⠀⠀⠀⠀⠀⠀⠀⠀⠀⠀⠀⡇⠀⠀⠀⠀⠀⠀⠀⠀⠀⠀⠘⡄⠀⠀⠀⠀⠀⠀⠀⠀⠀⠀⠀⠀⠀⠀⠀⡜⠀⠀⠀⠀⠀⠀⠀⠀⠀⠀⠀
-0.4713333 | ⠀⠀⠀⠀⠀⠀⠀⠀⠀⠀⠀⠀⠘⡄⠀⠀⠀⠀⠀⠀⠀⠀⠀⠀⠀⠀⠀⡜⠀⠀⠀⠀⠀⠀⠀⠀⠀⠀⠀⠀⡇⠀⠀⠀⠀⠀⠀⠀⠀⠀⠀⠀⠘⡄⠀⠀⠀⠀⠀⠀⠀⠀⠀⠀⠀⠀⠀⡜⠀⠀⠀⠀⠀⠀⠀⠀⠀⠀⠀⠀
-0.6060000 | ⠀⠀⠀⠀⠀⠀⠀⠀⠀⠀⠀⠀⠀⠑⡄⠀⠀⠀⠀⠀⠀⠀⠀⠀⠀⢀⠜⠀⠀⠀⠀⠀⠀⠀⠀⠀⠀⠀⠀⠀⡇⠀⠀⠀⠀⠀⠀⠀⠀⠀⠀⠀⠀⠘⡄⠀⠀⠀⠀⠀⠀⠀⠀⠀⠀⠀⡸⠀⠀⠀⠀⠀⠀⠀⠀⠀⠀⠀⠀⠀
-0.7406667 | ⠀⠀⠀⠀⠀⠀⠀⠀⠀⠀⠀⠀⠀⠀⠑⢄⠀⠀⠀⠀⠀⠀⠀⠀⢀⠜⠀⠀⠀⠀⠀⠀⠀⠀⠀⠀⠀⠀⠀⠀⡇⠀⠀⠀⠀⠀⠀⠀⠀⠀⠀⠀⠀⠀⠈⡆⠀⠀⠀⠀⠀⠀⠀⠀⢀⠜⠀⠀⠀⠀⠀⠀⠀⠀⠀⠀⠀⠀⠀⠀
-0.8753333 | ⠀⠀⠀⠀⠀⠀⠀⠀⠀⠀⠀⠀⠀⠀⠀⠈⠢⡀⠀⠀⠀⠀⠀⢀⠎⠀⠀⠀⠀⠀⠀⠀⠀⠀⠀⠀⠀⠀⠀⠀⡇⠀⠀⠀⠀⠀⠀⠀⠀⠀⠀⠀⠀⠀⠀⠈⢢⠀⠀⠀⠀⠀⠀⡠⠊⠀⠀⠀⠀⠀⠀⠀⠀⠀⠀⠀⠀⠀⠀⠀
-1.0100000 | ⠀⠀⠀⠀⠀⠀⠀⠀⠀⠀⠀⠀⠀⠀⠀⠀⠀⠈⠢⢄⡠⠤⠊⠁⠀⠀⠀⠀⠀⠀⠀⠀⠀⠀⠀⠀⠀⠀⠀⠀⡇⠀⠀⠀⠀⠀⠀⠀⠀⠀⠀⠀⠀⠀⠀⠀⠀⠉⠢⠤⣀⠤⠊⠀⠀⠀⠀⠀⠀⠀⠀⠀⠀⠀⠀⠀⠀⠀⠀⠀
-----------|-|---------|---------|---------|---------|---------|---------|---------|---------|-> (X)
           | -6.283185 -4.712389 -3.141593 -1.570796 0         1.5707963 3.1415927 4.7123890 6.2831853

Legend:
-------
⠤⠤ test_data_cos.txt
Installation
   pip install bashplot

   # or

   pip install git+https://github.com/Anselmoo/bashplot.git```

   # or

   pip install -r requirements.txt
   python setup.py install
Requirments
Usage
╰─ bashplot -h
usage: bashplot [-h] [-cm COMMENTS] [-d DELIMITER] [-skh SKIP_HEADER]
                [-skf SKIP_FOOTER] [-col USECOLS USECOLS] [-sz SIZE SIZE]
                [-x X_LIMITS X_LIMITS] [-y Y_LIMITS Y_LIMITS] [-sc] [-c] [-l]
                [-v]
                [infile [infile ...]]

Instant data plotting from the terminal into the terminal

positional arguments:
  infile                load data file(s) as ASCII

optional arguments:
  -h, --help            show this help message and exit
  -cm COMMENTS, --comments COMMENTS
                        define the character to indicate the start of the
                        document; default is None
  -d DELIMITER, --delimiter DELIMITER
                        define the type of deilimiter; default is any
                        consecutive 'whitespace'
  -skh SKIP_HEADER, --skip_header SKIP_HEADER
                        define the number of skipped rows from the beginning
                        of the document; default is 0
  -skf SKIP_FOOTER, --skip_footer SKIP_FOOTER
                        define the number of skipped rows from the end of the
                        document; default is 0
  -col USECOLS USECOLS, --usecols USECOLS USECOLS
                        define the pair of x- and y-columns for the data plot;
                        default is None. This means all available will be
                        loaded; otherwise tip a series of columns started with
                        0 like 0, 1, 4
  -sz SIZE SIZE, --size SIZE SIZE
                        define the width and heights of the plots; default is
                        width = 60 and the heights = 40. The values have to be
                        int-values.
  -x X_LIMITS X_LIMITS, --x_limits X_LIMITS X_LIMITS
                        define the mimimum and maximum x-range of the plot;
                        default is the automatic generated minimum and the
                        maximum of the data, but can be replaced by any float-
                        values.
  -y Y_LIMITS Y_LIMITS, --y_limits Y_LIMITS Y_LIMITS
                        define the mimimum and maximum y-range of the plot;
                        default is the automatic generated minimum and the
                        maximum of the data, but can be replaced by any float-
                        values.
  -sc, --scatter        replaced regular plot by scatter plot
  -c, --color           enable RGB colorized the plots
  -l, --legend          disable the legend of the plots
  -v, --version         displays the current version of bathchplot
Other examples
- Plotting multiple files for different window-size with
bashplot *txt -size 30 20
   (Y)     ^
0.99948622 |
0.89953759 | ⠀⠀⠀⠀⠀⠀⠀⢠⠒⠁⠀⠉⢢⠀⠀⠀⠀⠀⠀⠀⠀⠀⠀⠀⠀⠀⠀⠀⠀⠀⠀⠀⠀⠀⠀⠀⠀⠀⠀⠀⡇⠀⠀⠀⠀⠀⠀⡠⠊⠀⠀⠉⠢⡀⠀⠀⠀⠀⠀⠀⠀⠀⠀⠀⠀⠀⠀⠀⠀⠀⠀⠀⠀⠀⠀⠀⠀⠀⠀⠀
0.79958897 | ⠀⠀⠀⠀⠀⠀⡔⠁⠀⠀⠀⠀⠀⠱⡀⠀⠀⠀⠀⠀⠀⠀⠀⠀⠀⠀⠀⠀⠀⠀⠀⠀⠀⠀⠀⠀⠀⠀⠀⠀⡇⠀⠀⠀⠀⠀⡔⠁⠀⠀⠀⠀⠀⠑⡄⠀⠀⠀⠀⠀⠀⠀⠀⠀⠀⠀⠀⠀⠀⠀⠀⠀⠀⠀⠀⠀⠀⠀⠀⠀
0.69964035 | ⠀⠀⠀⠀⠀⡔⠁⠀⠀⠀⠀⠀⠀⠀⠱⡀⠀⠀⠀⠀⠀⠀⠀⠀⠀⠀⠀⠀⠀⠀⠀⠀⠀⠀⠀⠀⠀⠀⠀⠀⡇⠀⠀⠀⠀⡜⠀⠀⠀⠀⠀⠀⠀⠀⠘⡄⠀⠀⠀⠀⠀⠀⠀⠀⠀⠀⠀⠀⠀⠀⠀⠀⠀⠀⠀⠀⠀⠀⠀⠀
0.59969173 | ⠀⠀⠀⠀⢰⠁⠀⠀⠀⠀⠀⠀⠀⠀⠀⠸⡀⠀⠀⠀⠀⠀⠀⠀⠀⠀⠀⠀⠀⠀⠀⠀⠀⠀⠀⠀⠀⠀⠀⠀⡇⠀⠀⠀⡜⠀⠀⠀⠀⠀⠀⠀⠀⠀⠀⠸⡀⠀⠀⠀⠀⠀⠀⠀⠀⠀⠀⠀⠀⠀⠀⠀⠀⠀⠀⠀⠀⠀⠀⠀
0.49974311 | ⠀⠀⠀⢠⠃⠀⠀⠀⠀⠀⠀⠀⠀⠀⠀⠀⠸⡀⠀⠀⠀⠀⠀⠀⠀⠀⠀⠀⠀⠀⠀⠀⠀⠀⠀⠀⠀⠀⠀⠀⡇⠀⠀⢰⠁⠀⠀⠀⠀⠀⠀⠀⠀⠀⠀⠀⢣⠀⠀⠀⠀⠀⠀⠀⠀⠀⠀⠀⠀⠀⠀⠀⠀⠀⠀⠀⠀⠀⠀⠀
0.39979449 | ⠀⠀⢀⠎⠀⠀⠀⠀⠀⠀⠀⠀⠀⠀⠀⠀⠀⢣⠀⠀⠀⠀⠀⠀⠀⠀⠀⠀⠀⠀⠀⠀⠀⠀⠀⠀⠀⠀⠀⠀⡇⠀⢀⠇⠀⠀⠀⠀⠀⠀⠀⠀⠀⠀⠀⠀⠈⡆⠀⠀⠀⠀⠀⠀⠀⠀⠀⠀⠀⠀⠀⠀⠀⠀⠀⠀⠀⠀⠀⠀
0.29984586 | ⠀⠀⡜⠀⠀⠀⠀⠀⠀⠀⠀⠀⠀⠀⠀⠀⠀⠈⡆⠀⠀⠀⠀⠀⠀⠀⠀⠀⠀⠀⠀⠀⠀⠀⠀⠀⠀⠀⠀⠀⡇⠀⡜⠀⠀⠀⠀⠀⠀⠀⠀⠀⠀⠀⠀⠀⠀⠘⡄⠀⠀⠀⠀⠀⠀⠀⠀⠀⠀⠀⠀⠀⠀⠀⠀⠀⠀⠀⠀⠀
0.19989724 | ⠀⡸⠀⠀⠀⠀⠀⠀⠀⠀⠀⠀⠀⠀⠀⠀⠀⠀⠸⡀⠀⠀⠀⠀⠀⠀⠀⠀⠀⠀⠀⠀⠀⠀⠀⠀⠀⠀⠀⠀⡇⢠⠃⠀⠀⠀⠀⠀⠀⠀⠀⠀⠀⠀⠀⠀⠀⠀⠘⡄⠀⠀⠀⠀⠀⠀⠀⠀⠀⠀⠀⠀⠀⠀⠀⠀⠀⠀⠀⠀
0.09994862 | ⢀⠇⠀⠀⠀⠀⠀⠀⠀⠀⠀⠀⠀⠀⠀⠀⠀⠀⠀⢇⠀⠀⠀⠀⠀⠀⠀⠀⠀⠀⠀⠀⠀⠀⠀⠀⠀⠀⠀⠀⡇⡎⠀⠀⠀⠀⠀⠀⠀⠀⠀⠀⠀⠀⠀⠀⠀⠀⠀⢱⠀⠀⠀⠀⠀⠀⠀⠀⠀⠀⠀⠀⠀⠀⠀⠀⠀⠀⠀⠀
         0 | ⣜⣀⣀⣀⣀⣀⣀⣀⣀⣀⣀⣀⣀⣀⣀⣀⣘⣄⣀⣀⣀⣀⣀⣀⣀⣀⣀⣀⣀⣀⣀⣀⣀⣀⣀⣟⣀⣀⣀⣀⣀⣀⣀⣀⣀⣀⣀⣀⣀⣀⣀⣀⣈⣆⣀⣀⣀⣀⣀⣀⣀⣀⣀⣀⣀⣀⣀⣀⣀⣀⣀⣀⣀⣀⣀⣀⣀⣀⣀⣀
-0.0999486 | ⠀⠀⠀⠀⠀⠀⠀⠀⠀⠀⠀⠀⠀⠀⠀⠀⠀⠀⠀⠀⢣⠀⠀⠀⠀⠀⠀⠀⠀⠀⠀⠀⠀⠀⠀⠀⠀⠀⠀⡰⡇⠀⠀⠀⠀⠀⠀⠀⠀⠀⠀⠀⠀⠀⠀⠀⠀⠀⠀⠀⢱⠀⠀⠀⠀⠀⠀⠀⠀⠀⠀⠀⠀⠀⠀⠀⠀⠀⠀⢰
-0.1998972 | ⠀⠀⠀⠀⠀⠀⠀⠀⠀⠀⠀⠀⠀⠀⠀⠀⠀⠀⠀⠀⠘⡄⠀⠀⠀⠀⠀⠀⠀⠀⠀⠀⠀⠀⠀⠀⠀⠀⢠⠃⡇⠀⠀⠀⠀⠀⠀⠀⠀⠀⠀⠀⠀⠀⠀⠀⠀⠀⠀⠀⠀⢇⠀⠀⠀⠀⠀⠀⠀⠀⠀⠀⠀⠀⠀⠀⠀⠀⠀⡎
-0.2998459 | ⠀⠀⠀⠀⠀⠀⠀⠀⠀⠀⠀⠀⠀⠀⠀⠀⠀⠀⠀⠀⠀⠱⡀⠀⠀⠀⠀⠀⠀⠀⠀⠀⠀⠀⠀⠀⠀⠀⡜⠀⡇⠀⠀⠀⠀⠀⠀⠀⠀⠀⠀⠀⠀⠀⠀⠀⠀⠀⠀⠀⠀⠸⡀⠀⠀⠀⠀⠀⠀⠀⠀⠀⠀⠀⠀⠀⠀⠀⡸⠀
-0.3997945 | ⠀⠀⠀⠀⠀⠀⠀⠀⠀⠀⠀⠀⠀⠀⠀⠀⠀⠀⠀⠀⠀⠀⠱⡀⠀⠀⠀⠀⠀⠀⠀⠀⠀⠀⠀⠀⠀⢰⠁⠀⡇⠀⠀⠀⠀⠀⠀⠀⠀⠀⠀⠀⠀⠀⠀⠀⠀⠀⠀⠀⠀⠀⢣⠀⠀⠀⠀⠀⠀⠀⠀⠀⠀⠀⠀⠀⠀⢰⠁⠀
-0.4997431 | ⠀⠀⠀⠀⠀⠀⠀⠀⠀⠀⠀⠀⠀⠀⠀⠀⠀⠀⠀⠀⠀⠀⠀⢣⠀⠀⠀⠀⠀⠀⠀⠀⠀⠀⠀⠀⢀⠇⠀⠀⡇⠀⠀⠀⠀⠀⠀⠀⠀⠀⠀⠀⠀⠀⠀⠀⠀⠀⠀⠀⠀⠀⠈⡆⠀⠀⠀⠀⠀⠀⠀⠀⠀⠀⠀⠀⢠⠃⠀⠀
-0.5996917 | ⠀⠀⠀⠀⠀⠀⠀⠀⠀⠀⠀⠀⠀⠀⠀⠀⠀⠀⠀⠀⠀⠀⠀⠈⡆⠀⠀⠀⠀⠀⠀⠀⠀⠀⠀⠀⡜⠀⠀⠀⡇⠀⠀⠀⠀⠀⠀⠀⠀⠀⠀⠀⠀⠀⠀⠀⠀⠀⠀⠀⠀⠀⠀⠸⡀⠀⠀⠀⠀⠀⠀⠀⠀⠀⠀⠀⡎⠀⠀⠀
-0.6996404 | ⠀⠀⠀⠀⠀⠀⠀⠀⠀⠀⠀⠀⠀⠀⠀⠀⠀⠀⠀⠀⠀⠀⠀⠀⠸⡀⠀⠀⠀⠀⠀⠀⠀⠀⠀⡰⠁⠀⠀⠀⡇⠀⠀⠀⠀⠀⠀⠀⠀⠀⠀⠀⠀⠀⠀⠀⠀⠀⠀⠀⠀⠀⠀⠀⠸⡀⠀⠀⠀⠀⠀⠀⠀⠀⠀⡜⠀⠀⠀⠀
-0.7995890 | ⠀⠀⠀⠀⠀⠀⠀⠀⠀⠀⠀⠀⠀⠀⠀⠀⠀⠀⠀⠀⠀⠀⠀⠀⠀⠱⡀⠀⠀⠀⠀⠀⠀⠀⡰⠁⠀⠀⠀⠀⡇⠀⠀⠀⠀⠀⠀⠀⠀⠀⠀⠀⠀⠀⠀⠀⠀⠀⠀⠀⠀⠀⠀⠀⠀⠘⡄⠀⠀⠀⠀⠀⠀⠀⡸⠀⠀⠀⠀⠀
-0.8995376 | ⠀⠀⠀⠀⠀⠀⠀⠀⠀⠀⠀⠀⠀⠀⠀⠀⠀⠀⠀⠀⠀⠀⠀⠀⠀⠀⠑⡄⠀⠀⠀⠀⠀⡔⠁⠀⠀⠀⠀⠀⡇⠀⠀⠀⠀⠀⠀⠀⠀⠀⠀⠀⠀⠀⠀⠀⠀⠀⠀⠀⠀⠀⠀⠀⠀⠀⠘⢄⠀⠀⠀⠀⠀⡜⠀⠀⠀⠀⠀⠀
-0.9994862 | ⠀⠀⠀⠀⠀⠀⠀⠀⠀⠀⠀⠀⠀⠀⠀⠀⠀⠀⠀⠀⠀⠀⠀⠀⠀⠀⠀⠈⠢⢄⣀⡠⠊⠀⠀⠀⠀⠀⠀⠀⡇⠀⠀⠀⠀⠀⠀⠀⠀⠀⠀⠀⠀⠀⠀⠀⠀⠀⠀⠀⠀⠀⠀⠀⠀⠀⠀⠀⠣⢄⣀⠔⠊⠀⠀⠀⠀⠀⠀⠀
-----------|-|---------|---------|---------|---------|---------|---------|---------|---------|-> (X)
           | -6.283185 -4.712389 -3.141593 -1.570796 0         1.5707963 3.1415927 4.7123890 6.2831853

Legend:
-------
⠤⠤ test_data_sin.txt
   (Y)     ^
         1 |
0.90010273 | ⠀⠉⠢⡀⠀⠀⠀⠀⠀⠀⠀⠀⠀⠀⠀⠀⠀⠀⠀⠀⠀⠀⠀⠀⠀⠀⠀⠀⠀⠀⠀⠀⠀⠀⠀⠀⠀⡠⠊⠀⡇⠈⠢⡀⠀⠀⠀⠀⠀⠀⠀⠀⠀⠀⠀⠀⠀⠀⠀⠀⠀⠀⠀⠀⠀⠀⠀⠀⠀⠀⠀⠀⠀⠀⠀⠀⠀⡠⠊⠁
0.80020546 | ⠀⠀⠀⠘⢄⠀⠀⠀⠀⠀⠀⠀⠀⠀⠀⠀⠀⠀⠀⠀⠀⠀⠀⠀⠀⠀⠀⠀⠀⠀⠀⠀⠀⠀⠀⠀⡰⠁⠀⠀⡇⠀⠀⠱⡀⠀⠀⠀⠀⠀⠀⠀⠀⠀⠀⠀⠀⠀⠀⠀⠀⠀⠀⠀⠀⠀⠀⠀⠀⠀⠀⠀⠀⠀⠀⠀⡎⠀⠀⠀
0.70030819 | ⠀⠀⠀⠀⠘⡄⠀⠀⠀⠀⠀⠀⠀⠀⠀⠀⠀⠀⠀⠀⠀⠀⠀⠀⠀⠀⠀⠀⠀⠀⠀⠀⠀⠀⠀⡰⠁⠀⠀⠀⡇⠀⠀⠀⠱⡀⠀⠀⠀⠀⠀⠀⠀⠀⠀⠀⠀⠀⠀⠀⠀⠀⠀⠀⠀⠀⠀⠀⠀⠀⠀⠀⠀⠀⠀⡎⠀⠀⠀⠀
0.60041092 | ⠀⠀⠀⠀⠀⠘⡄⠀⠀⠀⠀⠀⠀⠀⠀⠀⠀⠀⠀⠀⠀⠀⠀⠀⠀⠀⠀⠀⠀⠀⠀⠀⠀⠀⢰⠁⠀⠀⠀⠀⡇⠀⠀⠀⠀⢱⠀⠀⠀⠀⠀⠀⠀⠀⠀⠀⠀⠀⠀⠀⠀⠀⠀⠀⠀⠀⠀⠀⠀⠀⠀⠀⠀⠀⡸⠀⠀⠀⠀⠀
0.50051365 | ⠀⠀⠀⠀⠀⠀⢱⠀⠀⠀⠀⠀⠀⠀⠀⠀⠀⠀⠀⠀⠀⠀⠀⠀⠀⠀⠀⠀⠀⠀⠀⠀⠀⢠⠃⠀⠀⠀⠀⠀⡇⠀⠀⠀⠀⠀⢣⠀⠀⠀⠀⠀⠀⠀⠀⠀⠀⠀⠀⠀⠀⠀⠀⠀⠀⠀⠀⠀⠀⠀⠀⠀⠀⢰⠁⠀⠀⠀⠀⠀
0.40061638 | ⠀⠀⠀⠀⠀⠀⠀⢇⠀⠀⠀⠀⠀⠀⠀⠀⠀⠀⠀⠀⠀⠀⠀⠀⠀⠀⠀⠀⠀⠀⠀⠀⢠⠃⠀⠀⠀⠀⠀⠀⡇⠀⠀⠀⠀⠀⠀⢣⠀⠀⠀⠀⠀⠀⠀⠀⠀⠀⠀⠀⠀⠀⠀⠀⠀⠀⠀⠀⠀⠀⠀⠀⠀⡇⠀⠀⠀⠀⠀⠀
0.30071911 | ⠀⠀⠀⠀⠀⠀⠀⠸⡀⠀⠀⠀⠀⠀⠀⠀⠀⠀⠀⠀⠀⠀⠀⠀⠀⠀⠀⠀⠀⠀⠀⠀⡎⠀⠀⠀⠀⠀⠀⠀⡇⠀⠀⠀⠀⠀⠀⠈⡆⠀⠀⠀⠀⠀⠀⠀⠀⠀⠀⠀⠀⠀⠀⠀⠀⠀⠀⠀⠀⠀⠀⠀⡸⠀⠀⠀⠀⠀⠀⠀
0.20082184 | ⠀⠀⠀⠀⠀⠀⠀⠀⢣⠀⠀⠀⠀⠀⠀⠀⠀⠀⠀⠀⠀⠀⠀⠀⠀⠀⠀⠀⠀⠀⠀⢰⠁⠀⠀⠀⠀⠀⠀⠀⡇⠀⠀⠀⠀⠀⠀⠀⢸⠀⠀⠀⠀⠀⠀⠀⠀⠀⠀⠀⠀⠀⠀⠀⠀⠀⠀⠀⠀⠀⠀⢠⠃⠀⠀⠀⠀⠀⠀⠀
0.10092457 | ⠀⠀⠀⠀⠀⠀⠀⠀⠀⢇⠀⠀⠀⠀⠀⠀⠀⠀⠀⠀⠀⠀⠀⠀⠀⠀⠀⠀⠀⠀⢀⠇⠀⠀⠀⠀⠀⠀⠀⠀⡇⠀⠀⠀⠀⠀⠀⠀⠀⢇⠀⠀⠀⠀⠀⠀⠀⠀⠀⠀⠀⠀⠀⠀⠀⠀⠀⠀⠀⠀⢀⠇⠀⠀⠀⠀⠀⠀⠀⠀
0.00102730 | ⣀⣀⣀⣀⣀⣀⣀⣀⣈⣆⣀⣀⣀⣀⣀⣀⣀⣀⣀⣀⣀⣀⣀⣀⣀⣀⣸⣀⣀⣀⣀⣀⣀⣀⣀⣇⣀⣀⣀⣀⣀⣀⣀⣘⣄⣀⣀⣀⣀⣀⣀⣀⣀⣀⣀⣀⣀⣀⣀⣀⣀⣎⣀⣀⣀⣀⣀⣀⣀⣀⣀⣀⣀⣀⣀⣀⣀⣀⣀
-0.0988700 | ⠀⠀⠀⠀⠀⠀⠀⠀⠀⠀⠸⡀⠀⠀⠀⠀⠀⠀⠀⠀⠀⠀⠀⠀⠀⠀⠀⠀⠀⢠⠃⠀⠀⠀⠀⠀⠀⠀⠀⠀⡇⠀⠀⠀⠀⠀⠀⠀⠀⠀⢣⠀⠀⠀⠀⠀⠀⠀⠀⠀⠀⠀⠀⠀⠀⠀⠀⠀⠀⢸⠀⠀⠀⠀⠀⠀⠀⠀⠀⠀
-0.1987672 | ⠀⠀⠀⠀⠀⠀⠀⠀⠀⠀⠀⢇⠀⠀⠀⠀⠀⠀⠀⠀⠀⠀⠀⠀⠀⠀⠀⠀⠀⡎⠀⠀⠀⠀⠀⠀⠀⠀⠀⠀⡇⠀⠀⠀⠀⠀⠀⠀⠀⠀⠈⡆⠀⠀⠀⠀⠀⠀⠀⠀⠀⠀⠀⠀⠀⠀⠀⠀⢀⠇⠀⠀⠀⠀⠀⠀⠀⠀⠀⠀
-0.2986645 | ⠀⠀⠀⠀⠀⠀⠀⠀⠀⠀⠀⠘⡄⠀⠀⠀⠀⠀⠀⠀⠀⠀⠀⠀⠀⠀⠀⠀⢰⠁⠀⠀⠀⠀⠀⠀⠀⠀⠀⠀⡇⠀⠀⠀⠀⠀⠀⠀⠀⠀⠀⢸⠀⠀⠀⠀⠀⠀⠀⠀⠀⠀⠀⠀⠀⠀⠀⠀⡜⠀⠀⠀⠀⠀⠀⠀⠀⠀⠀⠀
-0.3985618 | ⠀⠀⠀⠀⠀⠀⠀⠀⠀⠀⠀⠀⢱⠀⠀⠀⠀⠀⠀⠀⠀⠀⠀⠀⠀⠀⠀⢀⠇⠀⠀⠀⠀⠀⠀⠀⠀⠀⠀⠀⡇⠀⠀⠀⠀⠀⠀⠀⠀⠀⠀⠀⢇⠀⠀⠀⠀⠀⠀⠀⠀⠀⠀⠀⠀⠀⠀⢠⠃⠀⠀⠀⠀⠀⠀⠀⠀⠀⠀⠀
-0.4984590 | ⠀⠀⠀⠀⠀⠀⠀⠀⠀⠀⠀⠀⠈⡆⠀⠀⠀⠀⠀⠀⠀⠀⠀⠀⠀⠀⢀⠎⠀⠀⠀⠀⠀⠀⠀⠀⠀⠀⠀⠀⡇⠀⠀⠀⠀⠀⠀⠀⠀⠀⠀⠀⠈⢆⠀⠀⠀⠀⠀⠀⠀⠀⠀⠀⠀⠀⠀⡎⠀⠀⠀⠀⠀⠀⠀⠀⠀⠀⠀⠀
-0.5983563 | ⠀⠀⠀⠀⠀⠀⠀⠀⠀⠀⠀⠀⠀⠘⡄⠀⠀⠀⠀⠀⠀⠀⠀⠀⠀⠀⡎⠀⠀⠀⠀⠀⠀⠀⠀⠀⠀⠀⠀⠀⡇⠀⠀⠀⠀⠀⠀⠀⠀⠀⠀⠀⠀⠈⡆⠀⠀⠀⠀⠀⠀⠀⠀⠀⠀⠀⡸⠀⠀⠀⠀⠀⠀⠀⠀⠀⠀⠀⠀⠀
-0.6982536 | ⠀⠀⠀⠀⠀⠀⠀⠀⠀⠀⠀⠀⠀⠀⠱⡀⠀⠀⠀⠀⠀⠀⠀⠀⠀⡸⠀⠀⠀⠀⠀⠀⠀⠀⠀⠀⠀⠀⠀⠀⡇⠀⠀⠀⠀⠀⠀⠀⠀⠀⠀⠀⠀⠀⠘⡄⠀⠀⠀⠀⠀⠀⠀⠀⠀⡰⠁⠀⠀⠀⠀⠀⠀⠀⠀⠀⠀⠀⠀⠀
-0.7981509 | ⠀⠀⠀⠀⠀⠀⠀⠀⠀⠀⠀⠀⠀⠀⠀⠱⡀⠀⠀⠀⠀⠀⠀⠀⡰⠁⠀⠀⠀⠀⠀⠀⠀⠀⠀⠀⠀⠀⠀⠀⡇⠀⠀⠀⠀⠀⠀⠀⠀⠀⠀⠀⠀⠀⠀⠱⡀⠀⠀⠀⠀⠀⠀⠀⡰⠁⠀⠀⠀⠀⠀⠀⠀⠀⠀⠀⠀⠀⠀⠀
-0.8980481 | ⠀⠀⠀⠀⠀⠀⠀⠀⠀⠀⠀⠀⠀⠀⠀⠀⠑⢄⠀⠀⠀⠀⠀⡰⠁⠀⠀⠀⠀⠀⠀⠀⠀⠀⠀⠀⠀⠀⠀⠀⡇⠀⠀⠀⠀⠀⠀⠀⠀⠀⠀⠀⠀⠀⠀⠀⠱⡀⠀⠀⠀⠀⠀⡔⠁⠀⠀⠀⠀⠀⠀⠀⠀⠀⠀⠀⠀⠀⠀⠀
-0.9979454 | ⠀⠀⠀⠀⠀⠀⠀⠀⠀⠀⠀⠀⠀⠀⠀⠀⠀⠈⠢⢄⡠⠔⠉⠀⠀⠀⠀⠀⠀⠀⠀⠀⠀⠀⠀⠀⠀⠀⠀⠀⡇⠀⠀⠀⠀⠀⠀⠀⠀⠀⠀⠀⠀⠀⠀⠀⠀⠈⠒⠤⣀⠤⠊⠀⠀⠀⠀⠀⠀⠀⠀⠀⠀⠀⠀⠀⠀⠀⠀⠀
-----------|-|---------|---------|---------|---------|---------|---------|---------|---------|-> (X)
           | -6.283185 -4.712389 -3.141593 -1.570796 0         1.5707963 3.1415927 4.7123890 6.2831853

Legend:
-------
⠤⠤ test_data_cos.txt
- Plotting single file without legend
bashplot file -l
   (Y)     ^
0.23492250 |
0.21423357 | ⠀⠀⠀⠀⠀⠀⠀⠀⠀⠀⠀⠀⠀⠀⠀⠀⠀⠀⠀⠀⠀⠀⠀⠀⠀⠀⠀⠀⠀⠀⠀⠀⠀⠀⠀⠀⠀⠀⠀⠀⡇⠀⠀⠀⠀⠀⠀⠀⠀⠀⠀⠀⣇⠀⠀⠀⠀⠀⠀⠀⠀⠀⠀⠀⠀⠀⠀⠀⠀⠀⠀⠀⠀⠀⠀⠀⠀⠀⠀⠀
0.19354463 | ⠀⠀⠀⠀⠀⠀⠀⠀⠀⠀⠀⠀⠀⠀⠀⠀⠀⠀⠀⠀⠀⠀⠀⠀⠀⠀⠀⠀⠀⠀⠀⠀⠀⠀⠀⠀⠀⠀⠀⠀⡇⠀⠀⠀⠀⠀⠀⠀⠀⠀⠀⢰⢹⠀⠀⠀⠀⠀⠀⠀⠀⠀⠀⠀⠀⠀⠀⠀⠀⠀⠀⠀⠀⠀⠀⠀⠀⠀⠀⠀
0.17285570 | ⠀⠀⠀⠀⠀⠀⠀⠀⠀⠀⠀⠀⠀⠀⠀⠀⢀⠀⠀⠀⠀⠀⠀⠀⠀⠀⠀⠀⠀⠀⠀⠀⠀⠀⠀⠀⠀⠀⠀⠀⡇⠀⠀⠀⠀⠀⠀⠀⠀⠀⠀⢸⠈⡆⠀⠀⠀⠀⠀⠀⠀⠀⠀⠀⠀⠀⠀⠀⠀⠀⠀⠀⠀⠀⠀⠀⠀⠀⠀⠀
0.15216677 | ⠀⠀⠀⠀⠀⠀⠀⠀⠀⠀⠀⠀⠀⠀⠀⠀⣼⠀⠀⠀⠀⠀⠀⠀⠀⠀⠀⠀⠀⠀⠀⠀⠀⠀⣸⠀⠀⠀⠀⠀⡇⠀⠀⠀⠀⠀⠀⠀⠀⠀⠀⢸⠀⡇⠀⠀⠀⠀⢀⡆⠀⠀⠀⠀⠀⠀⠀⠀⠀⠀⠀⠀⠀⠀⠀⠀⠀⠀⠀⠀
0.13147783 | ⠀⠀⠀⠀⢀⡄⠀⠀⠀⠀⠀⠀⠀⠀⠀⢰⠉⡆⠀⠀⠀⠀⠀⠀⠀⠀⠀⠀⠀⠀⠀⠀⠀⢀⠟⡄⠀⠀⠀⠀⡇⠀⠀⠀⠀⠀⠀⠀⠀⠀⠀⡜⠀⢸⠀⠀⠀⢀⠇⡇⠀⠀⠀⠀⠀⠀⠀⠀⠀⠀⡇⠀⠀⠀⠀⠀⠀⠀⠀⠀
0.11078890 | ⠀⠀⠀⢰⠁⢇⠀⠀⠀⠀⠀⠀⠀⠀⠀⡜⠀⡇⠀⠀⠀⠀⠀⠀⠀⠀⠀⠀⠀⢰⠀⠀⠀⢸⠀⡇⠀⠀⠀⠀⡇⠀⠀⠀⠀⠀⠀⠀⠀⠀⠀⡇⠀⠘⡄⠀⠀⡇⠀⡇⠀⠀⠀⠀⠀⠀⠀⠀⠀⠀⣿⠀⠀⠀⠀⠀⠀⠀⠀⠀
0.09009997 | ⠀⠀⠀⡇⠀⢸⠀⠀⠀⠀⠀⠀⠀⣀⣰⠁⠀⢇⠀⠀⠀⠀⠀⠀⠀⠀⡀⠀⠀⡿⡀⠀⠀⡇⠀⡇⠀⠀⠀⠀⡇⠀⠀⠀⠀⠀⠀⠀⠀⠀⠀⡇⠀⠀⡇⠀⠀⡇⠀⢸⠀⠀⠀⠀⠀⠀⠀⠀⠀⢠⢻⠀⠀⠀⠀⠀⠀⠀⠀⠀
0.06941103 | ⠀⠀⢰⠁⠀⠸⡀⠀⠀⠀⡀⠀⢀⠇⠀⠀⠀⢸⠀⠀⠀⠀⠀⠀⠀⢠⢳⠀⢀⠇⡇⠀⢸⠀⠀⢸⠀⠀⠀⠀⡇⠀⠀⠀⠀⠀⠀⠀⠀⠀⢰⠁⠀⠀⡇⠀⢸⠀⠀⢸⠀⠀⠀⢰⠀⠀⠀⠀⠀⢸⠀⡇⠀⠀⠀⠀⠀⠀⠀⠀
0.04872210 | ⠀⠀⡎⠀⠀⠀⡇⠀⠀⠀⣇⠀⢸⠀⠀⠀⠀⢸⠀⠀⠀⡄⠀⠀⠀⡸⠀⢇⢸⠀⡇⠀⡸⠀⠀⢸⠀⠀⠀⠀⡇⠀⠀⠀⠀⠀⠀⠀⠀⠀⣸⠀⠀⠀⢸⠀⢸⠀⠀⢸⠀⠀⠀⡇⡇⠀⠀⠀⠀⢸⠀⡇⠀⠀⠀⠀⠀⠀⠀⠀
0.02803317 | ⣀⢠⠃⠀⠀⠀⡇⠀⠀⢠⢻⠀⢸⠀⠀⠀⠀⠘⡄⠀⢸⢣⠀⠀⢀⠇⠀⠘⡇⠀⢇⠀⡇⠀⠀⠸⡀⠀⠀⠀⡇⡄⠀⠀⡆⠀⠀⠀⢀⠏⠀⠀⠀⠀⢸⠀⢸⠀⠀⢸⠀⠀⢰⠁⢱⠀⠀⠀⠀⢸⠀⢸⠀⠀⠀⠀⠀⠀⠀⠀
0.00734423 | ⠀⠉⠀⠀⠀⠀⢸⠀⠀⢸⠈⡆⡇⠀⠀⠀⠀⠀⣇⢀⠇⠸⡀⠀⢸⠀⠀⠀⠀⠀⢸⠀⡇⠀⠀⠀⡇⠀⠀⠀⣧⢇⠀⢠⢳⠀⠀⠀⢸⠀⠀⠀⠀⠀⠸⡀⡜⠀⠀⠸⡀⠀⡜⠀⠘⡄⠀⡄⠀⢸⠀⢸⠀⠀⠀⠀⢸⠀⠀⠀
-0.0133447 | ⠉⠉⠉⠉⠉⠉⢹⠉⠉⢹⠉⣏⠏⠉⠉⠉⠉⠉⠉⠉⠉⠉⡏⠉⡏⠉⠉⠉⠉⠉⢹⢹⠉⠉⠉⠉⡏⠉⠉⠉⡿⢹⠉⢹⠹⡉⠉⠉⡏⠉⠉⠉⠉⠉⠉⡏⡏⠉⠉⠉⡏⠉⡏⠉⠉⢏⡝⡏⠉⡝⠉⠉⣏⢭⠉⠉⡏⡏⠉⠉
-0.0340336 | ⠀⠀⠀⠀⠀⠀⠘⡄⠀⡎⠀⢸⠀⠀⠀⠀⠀⠀⠀⠀⠀⠀⢣⢠⠃⠀⠀⠀⠀⠀⠸⣸⠀⠀⠀⠀⢸⠀⠀⠀⡇⢸⠀⢸⠀⡇⠀⢀⠇⠀⠀⠀⠀⠀⠀⡇⡇⠀⠀⠀⡇⢰⠁⠀⠀⠘⠀⢸⠀⡇⠀⠀⠀⠸⡀⠀⡇⢇⠀⠀
-0.0547226 | ⠀⠀⠀⠀⠀⠀⠀⡇⠀⡇⠀⠀⠀⠀⠀⠀⠀⠀⠀⠀⠀⠀⠸⣸⠀⠀⠀⠀⠀⠀⠀⡇⠀⠀⠀⠀⠈⡆⠀⢠⡇⠈⡆⡎⠀⢱⡠⠜⠀⠀⠀⠀⠀⠀⠀⣇⠇⠀⠀⠀⡇⢸⠀⠀⠀⠀⠀⢸⠀⡇⠀⠀⠀⠀⡇⠀⡇⢸⠀⢸
-0.0754115 | ⠀⠀⠀⠀⠀⠀⠀⡇⠀⡇⠀⠀⠀⠀⠀⠀⠀⠀⠀⠀⠀⠀⠀⠇⠀⠀⠀⠀⠀⠀⠀⠁⠀⠀⠀⠀⠀⡇⠀⡸⡇⠀⡇⡇⠀⠈⠀⠀⠀⠀⠀⠀⠀⠀⠀⢸⠀⠀⠀⠀⡇⡸⠀⠀⠀⠀⠀⠸⡀⡇⠀⠀⠀⠀⢣⢸⠀⠸⡀⡸
-0.0961004 | ⠀⠀⠀⠀⠀⠀⠀⢣⢠⠃⠀⠀⠀⠀⠀⠀⠀⠀⠀⠀⠀⠀⠀⠀⠀⠀⠀⠀⠀⠀⠀⠀⠀⠀⠀⠀⠀⠸⠤⠇⡇⠀⢧⠃⠀⠀⠀⠀⠀⠀⠀⠀⠀⠀⠀⠘⠀⠀⠀⠀⡇⡇⠀⠀⠀⠀⠀⠀⡇⡇⠀⠀⠀⠀⢸⢸⠀⠀⡇⡇
-0.1167894 | ⠀⠀⠀⠀⠀⠀⠀⢸⢸⠀⠀⠀⠀⠀⠀⠀⠀⠀⠀⠀⠀⠀⠀⠀⠀⠀⠀⠀⠀⠀⠀⠀⠀⠀⠀⠀⠀⠀⠀⠀⡇⠀⢸⠀⠀⠀⠀⠀⠀⠀⠀⠀⠀⠀⠀⠀⠀⠀⠀⠀⢸⡇⠀⠀⠀⠀⠀⠀⣧⠃⠀⠀⠀⠀⠸⡎⠀⠀⢣⠃
-0.1374783 | ⠀⠀⠀⠀⠀⠀⠀⢸⢸⠀⠀⠀⠀⠀⠀⠀⠀⠀⠀⠀⠀⠀⠀⠀⠀⠀⠀⠀⠀⠀⠀⠀⠀⠀⠀⠀⠀⠀⠀⠀⡇⠀⠀⠀⠀⠀⠀⠀⠀⠀⠀⠀⠀⠀⠀⠀⠀⠀⠀⠀⢸⠁⠀⠀⠀⠀⠀⠀⢻⠀⠀⠀⠀⠀⠀⠇⠀⠀⠘⠀
-0.1581672 | ⠀⠀⠀⠀⠀⠀⠀⠘⡎⠀⠀⠀⠀⠀⠀⠀⠀⠀⠀⠀⠀⠀⠀⠀⠀⠀⠀⠀⠀⠀⠀⠀⠀⠀⠀⠀⠀⠀⠀⠀⡇⠀⠀⠀⠀⠀⠀⠀⠀⠀⠀⠀⠀⠀⠀⠀⠀⠀⠀⠀⠘⠀⠀⠀⠀⠀⠀⠀⢸⠀⠀⠀⠀⠀⠀⠀⠀⠀⠀⠀
-0.1788562 | ⠀⠀⠀⠀⠀⠀⠀⠀⡇⠀⠀⠀⠀⠀⠀⠀⠀⠀⠀⠀⠀⠀⠀⠀⠀⠀⠀⠀⠀⠀⠀⠀⠀⠀⠀⠀⠀⠀⠀⠀⡇⠀⠀⠀⠀⠀⠀⠀⠀⠀⠀⠀⠀⠀⠀⠀⠀⠀⠀⠀⠀⠀⠀⠀⠀⠀⠀⠀⠀⠀⠀⠀⠀⠀⠀⠀⠀⠀⠀⠀
-----------|-|---------|---------|---------|---------|---------|---------|---------|---------|-> (X)
           | -0.300000 -0.225000 -0.150000 -0.075000 0         0.0750000 0.1500000 0.2250000 0.3000000
- Plotting single file with multiple columns in one plot inr
RGB-color
bashplot file -c
    (Y)     ^
          3 |
 2.85000000 | ⡇⠀⠀⠀⠀⠀⠀⠀⠀⠀⠀⠀⠀⠀⠀⠀⠀⠀⠀⠀⠀⠀⠀⠀⠀⠀⠀⠀⠀⠀⠀⠀⠀⠀⠀⠀⠀⠀⠀⠀⠀⠀⠀⠀⠀⠀⠀⠀⠀⠀⠀⠀⠀⠀⠀⠀⠀⠀⠀⠀⠀⠀⠀⠀⠀⠀⠀⠀⠀⠀⠀⠀⠀⠀⠀⠀⠀⠀⠀⠀
 2.70000000 | ⡇⠀⠀⠀⠀⠀⠀⠀⠀⠀⠀⠀⠀⠀⠀⠀⠀⠀⠀⠀⠀⠀⠀⠀⠀⠀⠀⠀⠀⠀⠀⠀⠀⠀⠀⠀⠀⠀⠀⠀⠀⠀⠀⠀⠀⠀⠀⠀⠀⠀⠀⠀⠀⠀⠀⢀⡠⠔⠒⠒⠒⠒⠉⠉⠉⠉⠒⠒⠤⢄⣀⡀⠀⠀⠀⠀⠀⠀⠀⠀
 2.55000000 | ⡇⠀⠀⠀⠀⠀⠀⠀⠀⠀⠀⠀⠀⠀⠀⠀⠀⠀⠀⠀⠀⠀⠀⠀⠀⠀⠀⠀⠀⠀⠀⠀⠀⠀⠀⠀⠀⠀⠀⠀⠀⠀⠀⠀⠀⠀⠀⠀⠀⠀⠀⢀⡠⠔⠊⠁⠀⠀⠀⠀⠀⠀⠀⠀⠀⠀⠀⠀⠀⠀⠀⠈⠑⠢⢄⠀⠀⠀⠀⠀
 2.40000000 | ⡇⠀⠀⠀⠀⠀⠀⠀⠀⠀⠀⠀⠀⠀⠀⠀⠀⠀⠀⠀⠀⠀⠀⠀⠀⠀⠀⠀⠀⠀⠀⠀⠀⠀⠀⠀⠀⠀⠀⠀⠀⠀⠀⠀⠀⠀⠀⠀⢀⡠⠊⠁⠀⠀⠀⠀⠀⠀⠀⠀⠀⠀⠀⠀⠀⠀⠀⠀⠀⠀⠀⠀⠀⠀⠀⠉⠢⢄⡀⠀
 2.25000000 | ⡇⠀⠀⠀⠀⠀⠀⠀⠀⠀⠀⠀⠀⠀⠀⠀⠀⠀⠀⠀⠀⠀⠀⠀⠀⠀⠀⠀⠀⠀⠀⠀⠀⠀⠀⠀⠀⠀⠀⠀⠀⠀⠀⠀⠀⠀⡠⠒⠁⠀⠀⠀⠀⠀⠀⠀⠀⠀⠀⠀⠀⠀⠀⠀⠀⠀⠀⠀⠀⠀⠀⠀⠀⠀⠀⠀⠀⠀⠈⠢
 2.10000000 | ⡇⠀⠀⠀⠀⠀⠀⠀⠀⠀⠀⠀⠀⠀⠀⠀⠀⠀⠀⠀⠀⠀⠀⠀⠀⠀⠀⠀⠀⠀⠀⠀⠀⠀⠀⠀⠀⠀⠀⠀⠀⠀⠀⢀⠔⠉⠀⠀⠀⠀⠀⠀⠀⠀⠀⠀⠀⠀⠀⠀⠀⠀⠀⠀⠀⠀⠀⠀⠀⠀⠀⠀⠀⠀⠀⠀⠀⠀⠀⠀
 1.95000000 | ⡇⠀⠀⠀⠀⠀⠀⠀⠀⠀⠀⠀⠀⠀⠀⠀⠀⠀⠀⠀⠀⠀⠀⠀⠀⠀⠀⠀⠀⠀⠀⠀⠀⠀⠀⠀⠀⠀⠀⠀⠀⢀⠔⠁⠀⠀⠀⠀⠀⠀⠀⠀⠀⠀⠀⠀⠀⠀⠀⠀⠀⠀⠀⠀⠀⠀⠀⠀⠀⠀⠀⠀⠀⠀⠀⠀⠀⠀⠀⠀
 1.80000000 | ⡇⠀⠀⠀⠀⠀⠀⠀⠀⠀⠀⠀⠀⠀⠀⠀⠀⠀⠀⠀⠀⠀⠀⠀⠀⠀⠀⠀⠀⠀⠀⠀⠀⠀⠀⠀⠀⠀⠀⢀⠔⠁⠀⠀⠀⠀⠀⠀⠀⠀⠀⠀⠀⠀⠀⠀⠀⠀⠀⠀⠀⠀⠀⠀⠀⠀⠀⠀⠀⠀⠀⠀⠀⠀⠀⠀⠀⠀⠀⠀
 1.65000000 | ⡇⠀⠀⠀⠀⠀⠀⠀⠀⠀⠀⠀⠀⠀⠀⠀⠀⠀⠀⠀⠀⠀⠀⠀⠀⠀⠀⠀⠀⠀⠀⠀⠀⠀⠀⠀⠀⢀⠔⠁⠀⠀⠀⠀⠀⠀⠀⠀⠀⠀⠀⠀⠀⠀⠀⠀⠀⠀⠀⠀⠀⠀⠀⠀⠀⠀⠀⠀⠀⠀⠀⠀⠀⠀⠀⠀⠀⠀⠀⠀
 1.50000000 | ⡇⠀⠀⠀⠀⠀⠀⠀⠀⠀⠀⠀⠀⠀⠀⠀⠀⠀⠀⠀⠀⠀⠀⠀⠀⠀⠀⠀⠀⠀⠀⠀⠀⠀⠀⠀⡰⠁⠀⠀⠀⠀⠀⠀⠀⠀⠀⠀⠀⠀⠀⠀⠀⠀⠀⠀⠀⠀⠀⠀⠀⠀⠀⠀⠀⠀⠀⠀⠀⠀⠀⠀⠀⠀⠀⠀⠀⠀⠀⠀
 1.35000000 | ⡇⠀⠀⠀⠀⠀⠀⠀⠀⠀⠀⠀⠀⠀⠀⠀⠀⠀⠀⠀⠀⠀⠀⠀⠀⠀⠀⠀⠀⠀⠀⠀⠀⠀⢀⠎⠀⠀⠀⠀⠀⠀⠀⠀⠀⠀⠀⠀⠀⠀⠀⠀⠀⠀⠀⠀⠀⠀⠀⠀⠀⠀⠀⠀⠀⠀⠀⠀⠀⠀⠀⠀⠀⠀⠀⠀⠀⠀⠀⠀
 1.20000000 | ⡇⠀⠀⠀⠀⠀⠀⠀⠀⠀⠀⠀⠀⠀⠀⠀⠀⠀⠀⠀⠀⠀⠀⠀⠀⠀⠀⠀⠀⠀⠀⠀⠀⡰⠁⠀⠀⠀⠀⠀⠀⠀⠀⠀⠀⠀⠀⠀⠀⠀⠀⠀⠀⠀⠀⠀⠀⠀⠀⠀⠀⠀⠀⠀⠀⠀⠀⠀⠀⠀⠀⠀⠀⠀⠀⠀⠀⠀⠀⠀
 1.05000000 | ⡇⠀⠀⠀⠀⠀⠀⠀⠀⠀⠀⠀⠀⠀⠀⠀⠀⠀⠀⠀⠀⠀⠀⠀⠀⠀⠀⠀⠀⠀⠀⢀⠎⠀⠀⠀⠀⠀⠀⠀⠀⠀⠀⠀⠀⠀⠀⠀⠀⠀⠀⠀⠀⠀⠀⠀⠀⠀⠀⠀⠀⠀⠀⠀⠀⠀⠀⠀⠀⠀⠀⠀⠀⠀⠀⠀⠀⠀⠀⠀
 0.90000000 | ⡗⠒⠒⠒⠒⠒⠒⠢⠤⠤⠤⢄⣀⠀⠀⠀⠀⠀⠀⠀⠀⠀⠀⠀⠀⠀⠀⠀⠀⠀⣰⣁⣀⠤⠤⠤⠒⠒⠒⠒⠒⠊⠉⠉⠉⠉⠑⠒⠒⠒⠤⠤⠤⣀⣀⠀⠀⠀⠀⠀⠀⠀⠀⠀⠀⠀⠀⠀⠀⠀⠀⠀⠀⠀⠀⠀⠀⠀⠀⠀
 0.75000000 | ⡇⠀⠀⠀⠀⠀⠀⠀⠀⠀⠀⠀⠀⠉⠉⠒⠢⠤⣀⣀⠀⠀⣀⡠⠤⠔⠒⠊⢉⠏⠀⠀⠀⠀⠀⠀⠀⠀⠀⠀⠀⠀⠀⠀⠀⠀⠀⠀⠀⠀⠀⠀⠀⠀⠀⠉⠉⠒⠒⠤⢄⣀⠀⠀⠀⠀⠀⠀⠀⠀⠀⠀⠀⠀⠀⠀⠀⠀⠀⠀
 0.60000000 | ⡇⠀⠀⠀⠀⠀⠀⠀⠀⠀⠀⠀⠀⠀⠀⠀⢀⣀⠤⠔⠛⠙⠒⠢⠤⣀⠀⡰⠁⠀⠀⠀⠀⠀⠀⠀⠀⠀⠀⠀⠀⠀⠀⠀⠀⠀⠀⠀⠀⠀⠀⠀⠀⠀⠀⠀⠀⠀⠀⠀⠀⠀⠉⠒⠢⠤⣀⡀⠀⠀⠀⠀⠀⠀⠀⠀⠀⠀⠀⠀
 0.45000000 | ⡇⠀⠀⠀⠀⠀⠀⠀⠀⠀⠀⠀⢀⡠⠔⠊⠁⠀⠀⠀⠀⠀⠀⠀⠀⢀⠏⠒⠢⢄⡀⠀⠀⠀⠀⠀⠀⠀⠀⠀⠀⠀⠀⠀⠀⠀⠀⠀⠀⠀⠀⠀⠀⠀⠀⠀⠀⠀⠀⠀⠀⠀⠀⠀⠀⠀⠀⠈⠉⠒⠤⢄⡀⠀⠀⠀⠀⠀⠀⠀
 0.30000000 | ⡇⠀⠀⠀⠀⠀⠀⠀⢀⠤⠔⠊⠁⠀⠀⠀⠀⠀⠀⠀⠀⠀⠀⠀⡰⠁⠀⠀⠀⠀⠈⠑⠢⢄⡀⠀⠀⠀⠀⠀⠀⠀⠀⠀⠀⠀⠀⠀⠀⠀⠀⠀⠀⠀⠀⠀⠀⠀⠀⠀⠀⠀⠀⠀⠀⠀⠀⠀⠀⠀⠀⠀⠈⠑⠢⢄⡀⠀⠀⠀
 0.15000000 | ⡇⠀⠀⠀⢀⠤⠔⠉⠁⠀⠀⠀⠀⠀⠀⠀⠀⠀⠀⠀⠀⠀⢀⠜⠀⠀⠀⠀⠀⠀⠀⠀⠀⠀⠈⠑⠢⢄⡀⠀⠀⠀⠀⠀⠀⠀⠀⠀⠀⠀⠀⠀⠀⠀⠀⠀⠀⠀⠀⠀⠀⠀⠀⠀⠀⠀⠀⠀⠀⠀⠀⠀⠀⠀⠀⠀⠈⠑⠢⢄
          0 | ⣇⣤⣒⣉⣁⣀⣀⣀⣀⣀⣀⣀⣀⣀⣀⣀⣀⣀⣀⣠⣃⣀⣀⣀⣀⣀⣀⣀⣀⣀⣀⣀⣀⣀⣀⣈⣒⣢⣀⣀⣀⣀⣀⣀⣀⣀⣀⣀⣀⣀⣀⣀⣀⣀⣀⣀⣀⣀⣀⣀⣀⣀⣀⣀⣀⣀⣀⣀⣀⣀⣀⣀⣀⣀⣀⣀⣀
 -----------|-|---------|---------|---------|---------|---------|---------|---------|---------|-> (X)
            | 0         0.3750000 0.7500000 1.1250000 1.5000000 1.8750000 2.2500000 2.6250000 3

 Legend:
 -------
 ⠤⠤ test_data_mixed.dat
 ⠤⠤ test_data_mixed.dat
 ⠤⠤ test_data_mixed.dat
Coloured Example
Using as built-in
from bashplot import bashplot

fnames = ["test.txt"]
args = {
            "infile": fnames,
            "comments": None,
            "delimiter": None,
            "skip_header": 0,
            "skip_footer": 0,
            "usecols": None,
            "size": [60, 40],
            "x_limits": None,
            "y_limits": None,
            "scatter": False,
            "color": True,
            "legend": True,
            "version": False,
        }

bashplot.bashplot(fnames, args)
Contributions
I'm happy to accept how to improve batchplot; please forward your issues or pull requests.
Keep in mind that pull requests have to pass GitHub Actions in combination with flake8, black, isort and pydocstyle.
License
The source code of bashplot is licensed under the
MIT license.
1 maintainer

Metadata
1 maintainer
Release files for bashplot 1.2.0
For a detailed explanation of source distributions (sdists) and built distributions (wheels), please see the package formats documentation.
Source distribution (sdist)
| File | Size | Uploaded | Provenance | |
|---|---|---|---|---|
| bashplot-1.2.0.tar.gz | 21.8 kB | Without provenance | Details |
Built distribution (wheel)
| File | Interpreter | ABI | Platform | Reset |
|---|---|---|---|---|
| bashplot-1.2.0-py3-none-any.whl | Python 3 | none | any | Details |
Total release size: 32.9 kB
Release files / bashplot-1.2.0.tar.gz
| Download URL | bashplot-1.2.0.tar.gz |
|---|---|
| Size | 21.8 kB |
| Tags | Source |
|
SHA-256 checksum How to use checksums |
ed8953a2ac2b62956a8771c2acf5360a5544ce450455773af5cce37e2cd86f64
|
|
BLAKE2b-256 checksum How to use checksums |
af6f2020bdaee87a45873ee4518722ef6c144d4f3717719347ca2acc620138da
|
| Upload date | |
|
Uploaded using Trusted Publishing? What is trusted publishing? |
No |
| Uploaded via |
poetry/1.2.2 CPython/3.10.7 Linux/5.15.0-1021-azure
|
Release files / bashplot-1.2.0-py3-none-any.whl
| Download URL | bashplot-1.2.0-py3-none-any.whl |
|---|---|
| Size | 11.1 kB |
| Tags | Python 3 |
|
SHA-256 checksum How to use checksums |
dd226048c8d801b44aa02d1eba0f02bcdbe496c648b46581d6e58b2ff1eca422
|
|
BLAKE2b-256 checksum How to use checksums |
5d6fda74e128548a29700d649cd3dbf5a2c9a6c9efc865f9d18bad5ecc0923f5
|
| Upload date | |
|
Uploaded using Trusted Publishing? What is trusted publishing? |
No |
| Uploaded via |
poetry/1.2.2 CPython/3.10.7 Linux/5.15.0-1021-azure
|
Security for bashplot 1.2.0
Provenance
Provenance describes where a file came from. On PyPI, provenance is shared via attestations, which provide a verifiable record of the build or publishing details. View details, limitations and caveats.
No provenance found
None of the files in this release were uploaded with provenance metadata.
A note on package security
PyPI is a repository for distributing packages, not a service for auditing them. While third-party security researchers and our staff do their best to detect and remove malicious packages, PyPI cannot guarantee the quality, security or suitability of any given package.
To learn more about protecting yourself from malicious actors, visit our package security documentation.














