
benchit (BENCHmark IT!)





Tools to benchmark Python solutions on runtime performance and visualize. Based on timeit, it primarily aims to functionally simulate the timeit behaviour and hence the name! This facilitates benchmarking on multiple datasets and solutions.
Documentation

Installation
Latest PyPI stable release :
pip install benchitPull latest development release on GitHub and install in the current directory :
pip install -e git+https://github.com/droyed/benchit.git@master#egg=benchitGetting started
Consider a setup to compare NumPy ufuncs - sum, prod, max on arrays varying in their sizes. To keep it simple, let’s consider 1D arrays. Thus, we would have :
>>> import numpy as np
>>> funcs = [np.sum,np.prod,np.max]
>>> inputs = [np.random.rand(i) for i in 10**np.arange(5)]

>>> import benchit
>>> t = benchit.timings(funcs, inputs)
It’s a dataframe-like object and as such we can plot it. It automatically adds in specs into the title area to convey all of available benchmarking info :
>>> t.plot(logy=True, logx=True)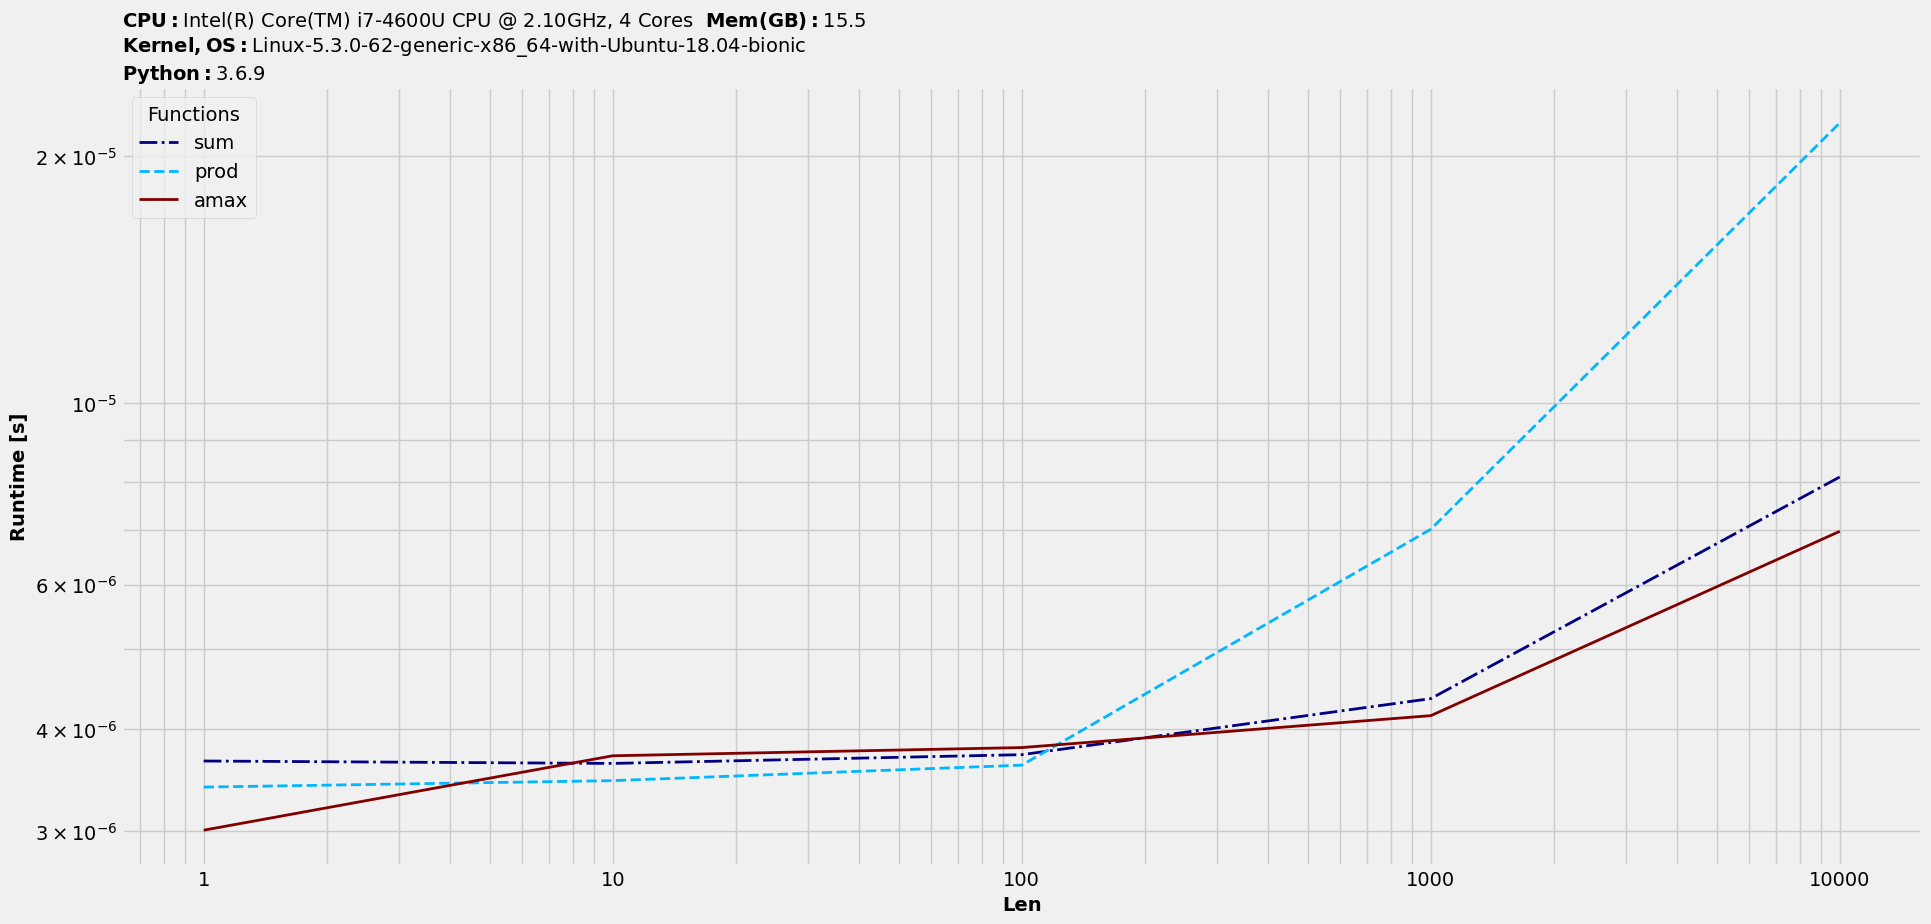
Multiple arguments
Let’s consider a setup where functions accept more than one argument. Let’s take the case of computing euclidean distances between two 2D arrays. We will feed in arrays with varying number of rows and 3 columns to represent data in 3D Cartesian coordinate system and benchmark two commonly used functions in Python.
>>> from sklearn.metrics.pairwise import pairwise_distances
>>> from scipy.spatial.distance import cdist
>>> fns = [cdist, pairwise_distances]

>>> import numpy as np
>>> in_ = {n:[np.random.rand(n,3), np.random.rand(n,3)] for n in [10,100,500,1000,4000]}
>>> t = benchit.timings(fns, in_, multivar=True, input_name='Array-length')
>>> t.plot(logx=True)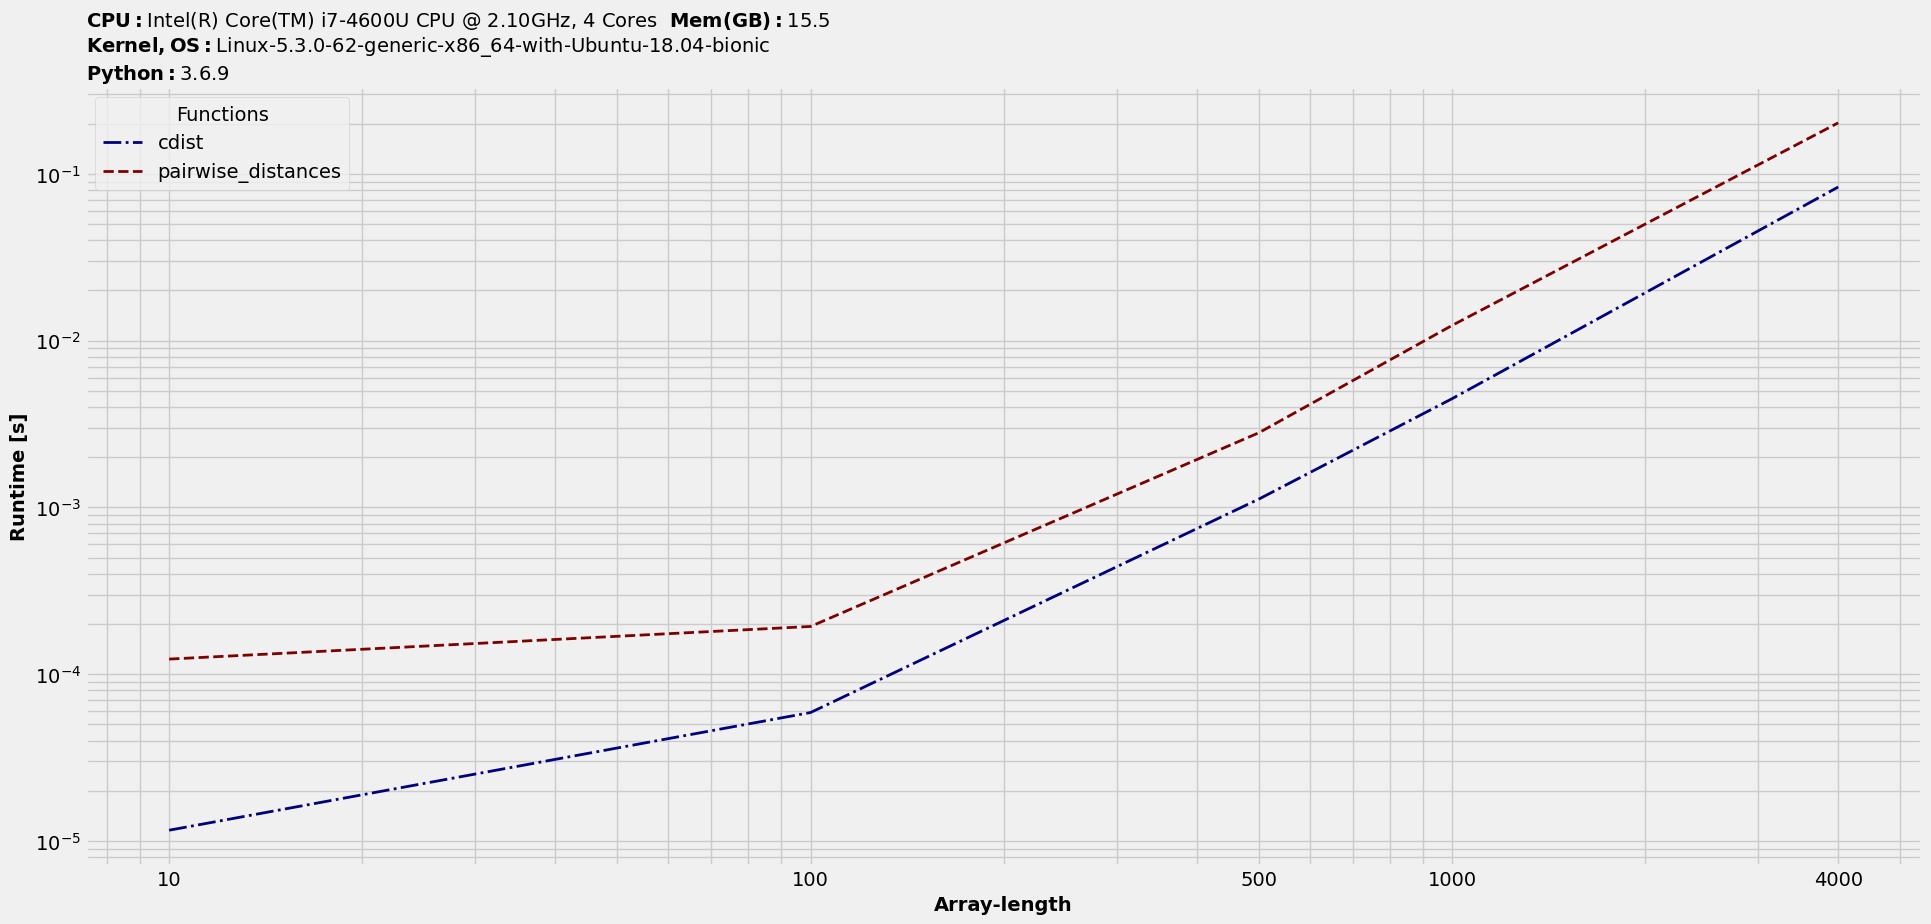
Multiple arguments with groupings
We will extend the previous example to make the second argument a variable too and study the trend as we vary the number of columns, resulting in subplots.
# Get benchmarking object (dataframe-like) and plot results
>>> R = np.random.rand
>>> in_ = {(n,W):[R(n,W), R(n,W)] for n in [10, 100, 500, 1000] for W in [3, 20, 50, 100]}
>>> t = benchit.timings(fns, in_, multivar=True, input_name=['nrows', 'ncols'])
>>> t.plot(logx=True, sp_ncols=2, sp_argID=0, sp_sharey='g')
For plotting, we are using number of rows as the x-axis base.
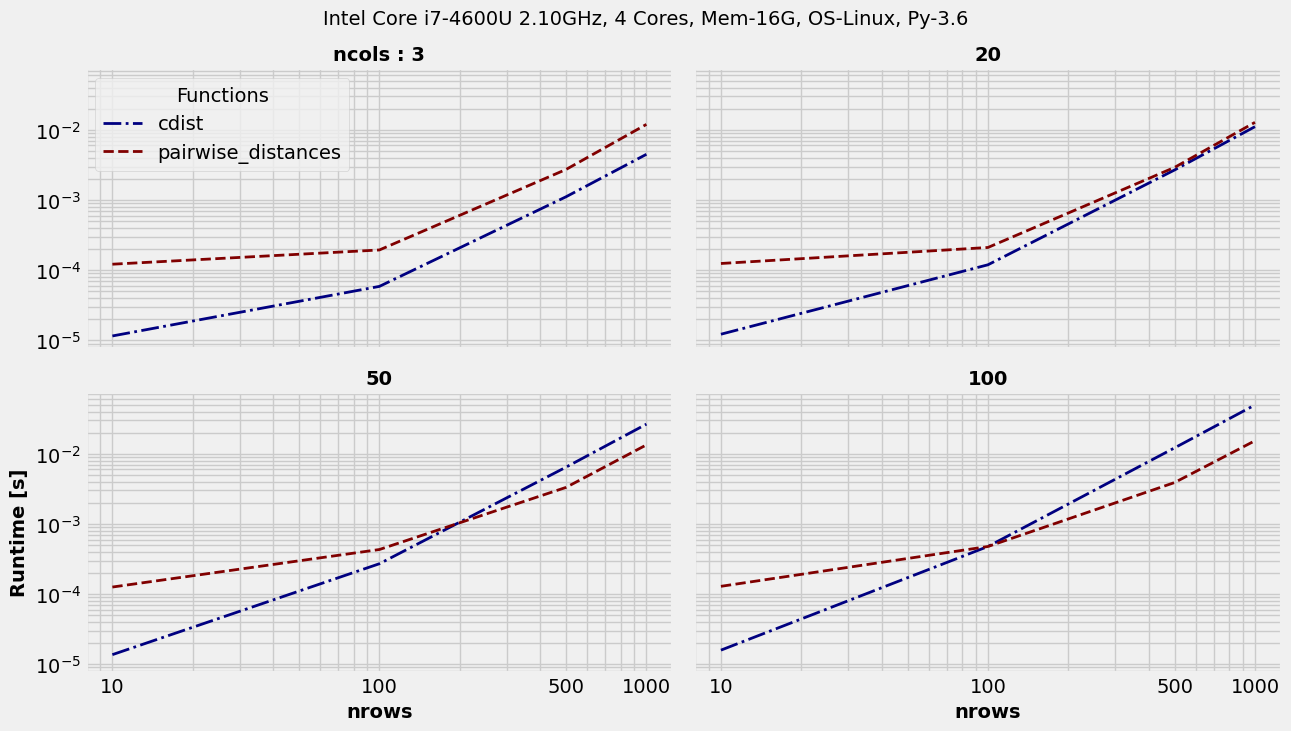
Use sp_argID=1 to switch-over to use number of cols as the x-axis base instead.
Single argument with groupings
Let’s manufacture a simple forward-filling scheme based on indices of True values in a boolean-array :
# Functions
def repeat(b):
    idx = np.flatnonzero(np.r_[b,True])
    return np.repeat(idx[:-1], np.diff(idx))

def maxaccum(b):
    return np.maximum.accumulate(np.where(b,np.arange(len(b)), 0))

in_ = {(n,sf): np.random.rand(n)<(100-sf)/100. for n in [100,1000,10000,100000,1000000] for sf in [20, 40, 60, 80, 90, 95]}
t = benchit.timings([repeat, maxaccum], in_, input_name=['Array-length','Sparseness %'])
t.plot(logx=True, sp_ncols=2, save='singlegrp_id0_ffillmask_timings.png')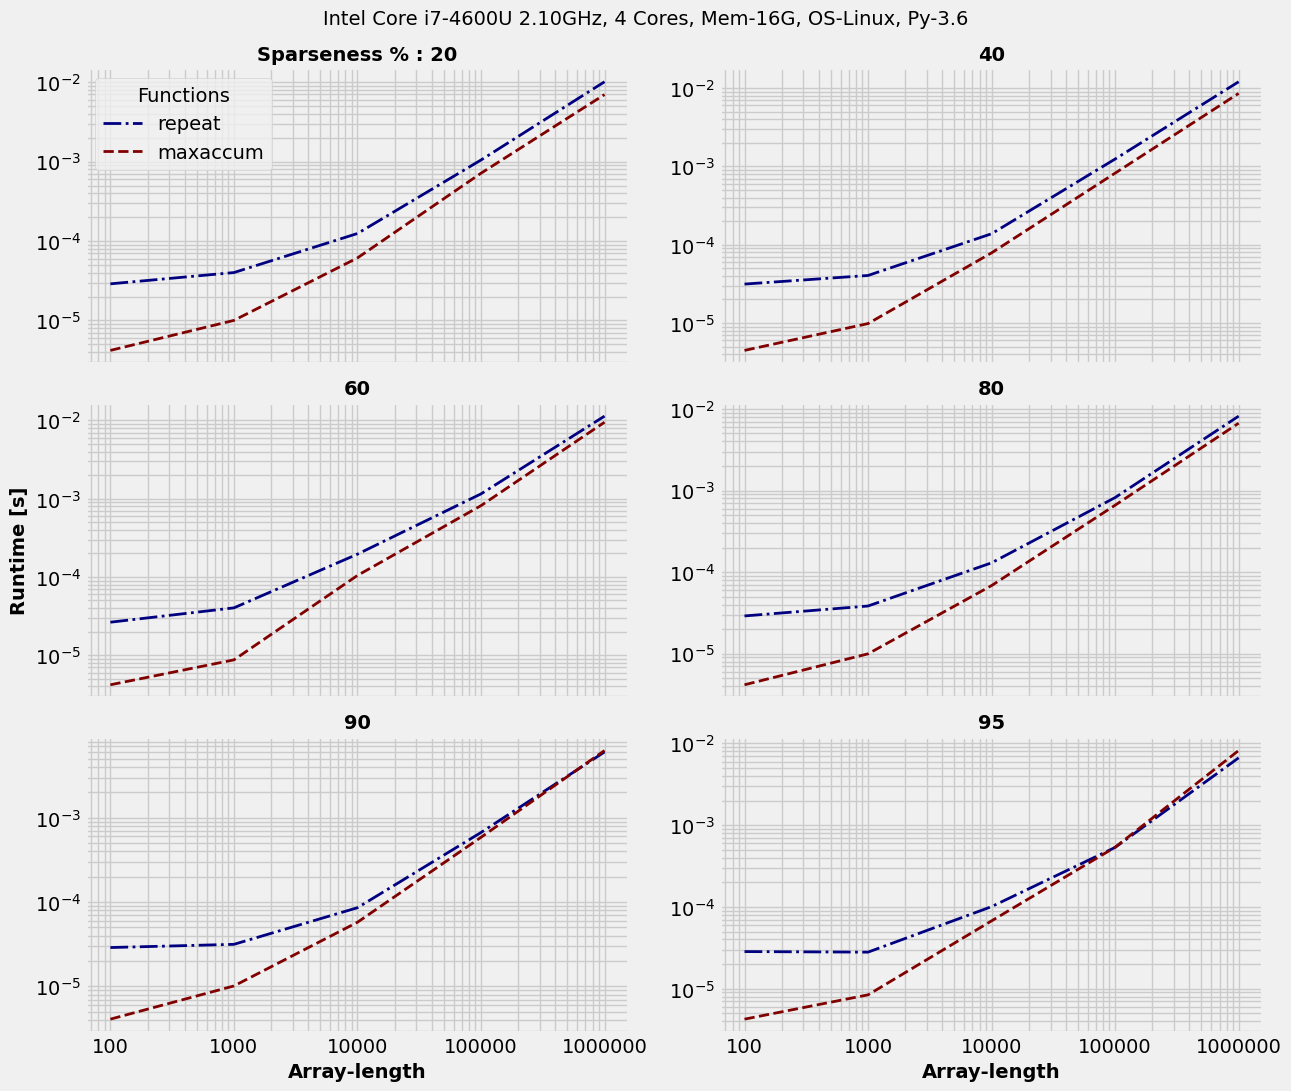
Quick Tips
1. Plotting on notebooks?
Use benchit.setparams(environ='notebook') before plotting. Check out sample notebook run.
2. Get a quick glance into the benchmarking trend before the actual one
Use benchit.setparams(rep=1) before plotting. Then, use benchit.setparams() for a proper benchmarking.
3. Get a quicker glance into plot layout and vague benchmarking trend before the actual one
Use benchit.setparams(timeout=1e-5, rep=1) before plotting. Then, use benchit.setparams() for a proper benchmarking.
4. Working with multi-variable datasets to study trend w.r.t. each argument?
Use nested loops to set-up input datasets as shown earlier. More information is available in documentation.
As a general rule, it’s advisable to work on Python 3.6 or newer for better plotting experience.
1 maintainer

Metadata
1 maintainer
Release files for benchit 0.0.6
For a detailed explanation of source distributions (sdists) and built distributions (wheels), please see the package formats documentation.
Source distribution (sdist)
| File | Size | Uploaded | Provenance | Actions |
|---|---|---|---|---|
| benchit-0.0.6.tar.gz | 17.2 kB | Without provenance | Details for benchit-0.0.6.tar.gz |
Release files / benchit-0.0.6.tar.gz
| Download URL | benchit-0.0.6.tar.gz |
|---|---|
| Size | 17.2 kB |
| Tags | Source |
|
SHA-256 checksum How to use checksums |
fb8ec1db2a8c39767ce7523884ce192c953ae64a9e12ab964438f5bff7bf7dfd
|
|
BLAKE2b-256 checksum How to use checksums |
b24dc982d32eb77fed1b62c8f1ddb5932ed28d8a6397e0f2a65f0f2e6ddf40c2
|
| Upload date | |
|
Uploaded using Trusted Publishing? What is trusted publishing? |
No |
| Uploaded via |
twine/1.15.0 pkginfo/1.5.0.1 requests/2.23.0 setuptools/44.1.1 requests-toolbelt/0.9.1 tqdm/4.50.2 CPython/2.7.17
|
Security for benchit 0.0.6
Provenance
Provenance describes where a file came from. On PyPI, provenance is shared via attestations, which provide a verifiable record of the build or publishing details. View details, limitations and caveats.
No provenance found
None of the files in this release were uploaded with provenance metadata.
A note on package security
PyPI is a repository for distributing packages, not a service for auditing them. While third-party security researchers and our staff do their best to detect and remove malicious packages, PyPI cannot guarantee the quality, security or suitability of any given package.
To learn more about protecting yourself from malicious actors, visit our package security documentation.














