Command Line Package that can be used to analyse locations datasets
Project description
About The Project
The checkContaminants package provides a quick way to look for contaminants in a location dataset. It runs as an independent application with a simple command line interface so no coding is required to use it. It provides summary tables and charts that help identify the major contaminants.
There are three kinds of outputs:
- Text output: You can choose from 3 verbosity modes for text output. The result can be output to the terminal or to a command file.
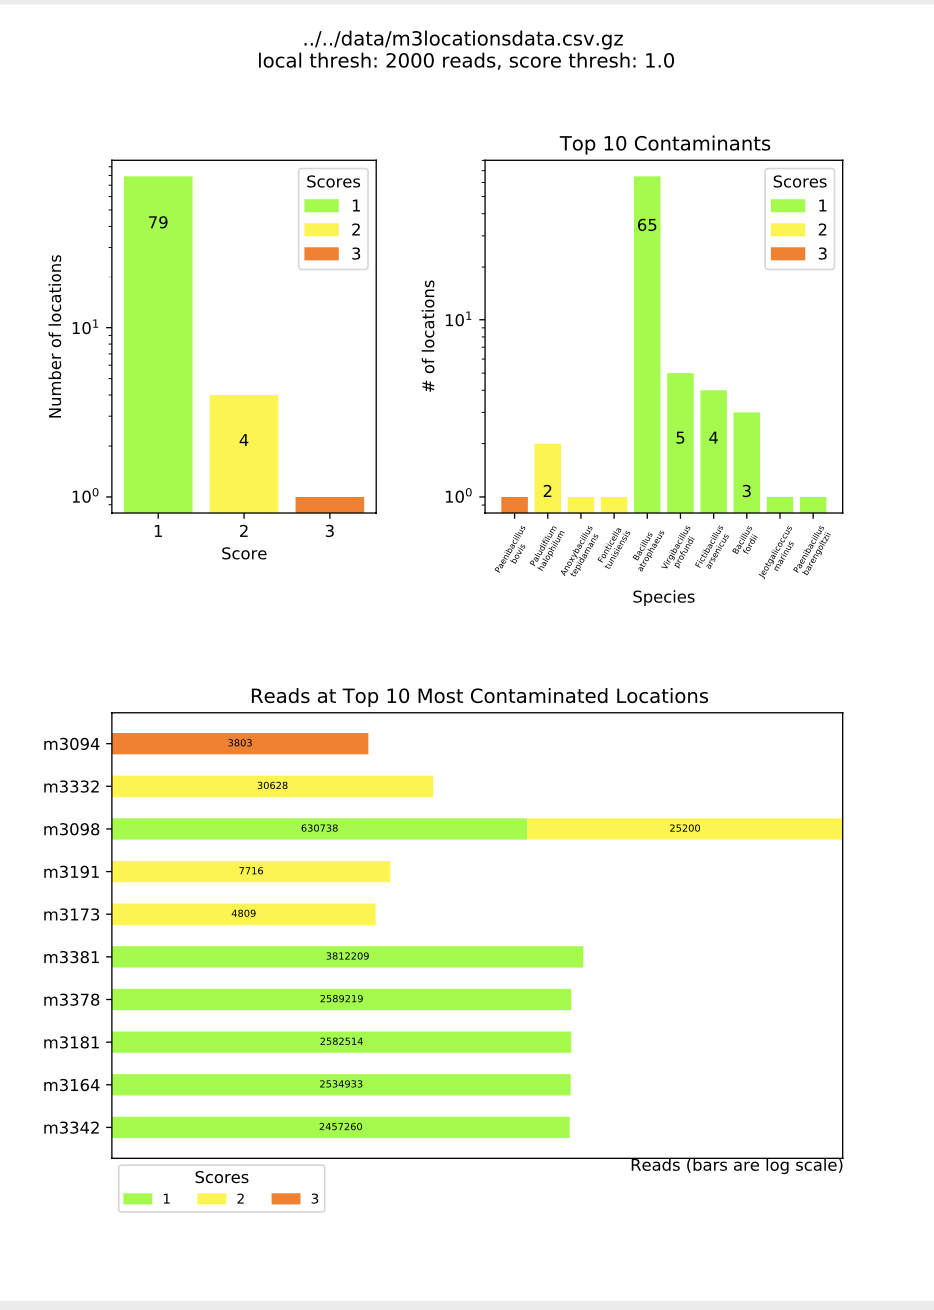
- Charts PDF: a PDF with three bar charts detailing the top 10 most prevalent species and most contaminated locations
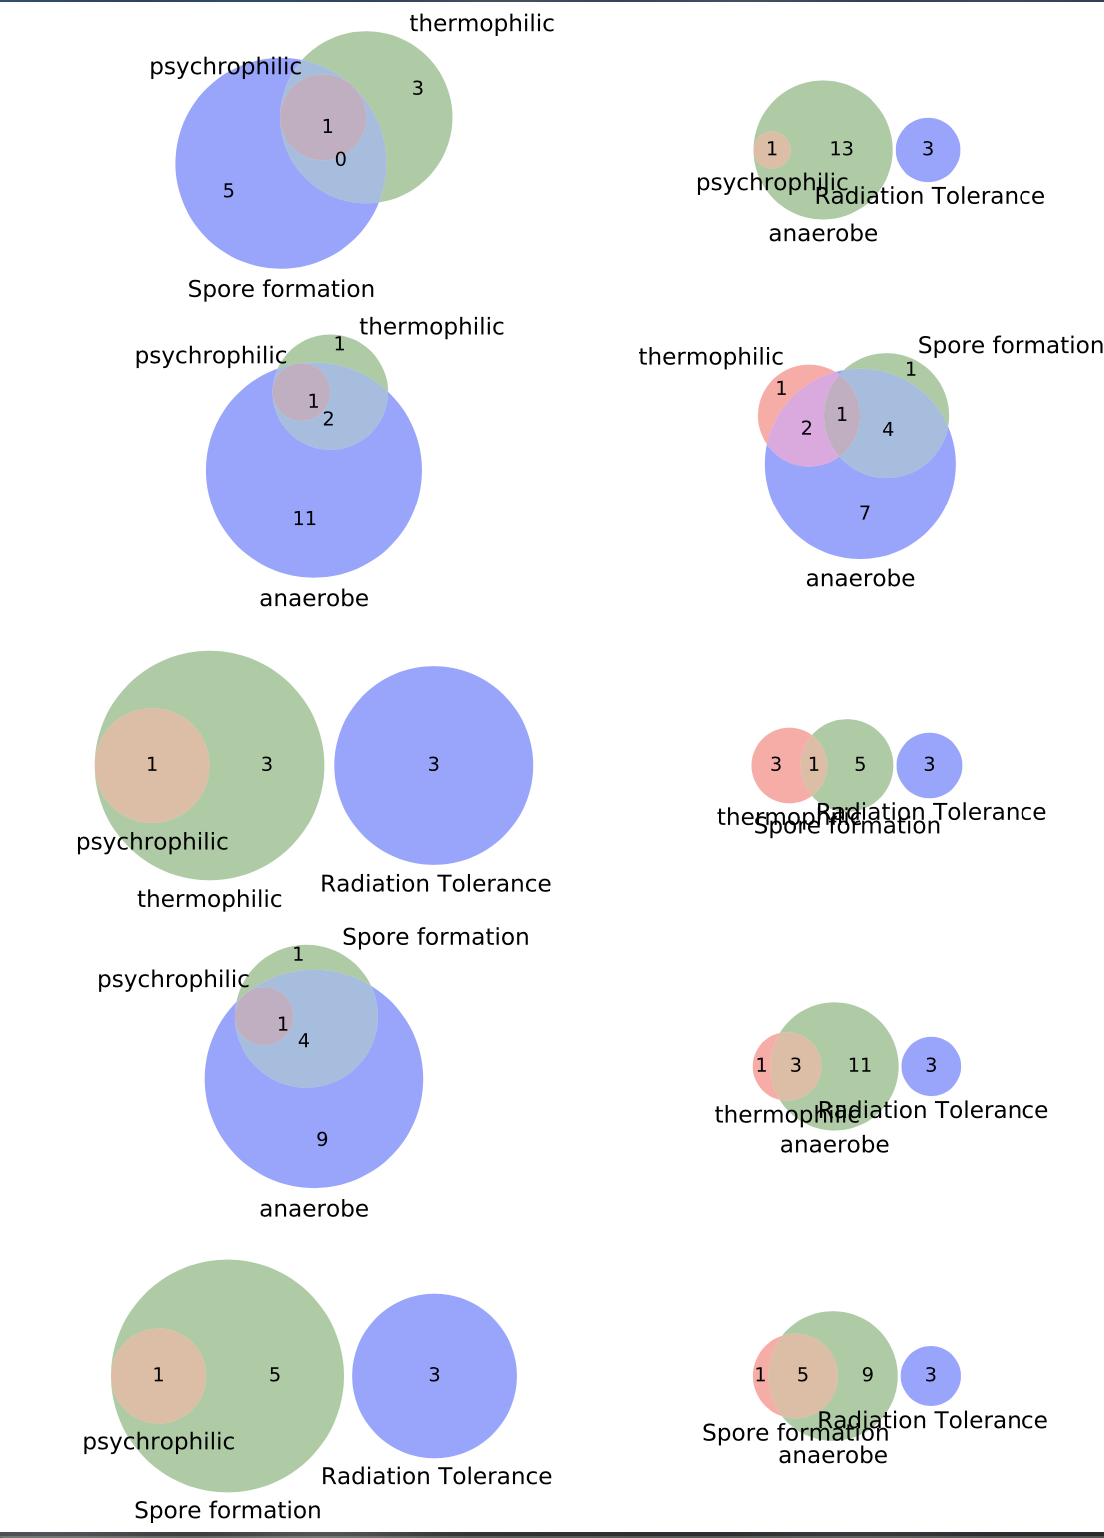
- Venn Diagrams with traits (radiation resistance, thermophilic) as the sets
How does it work?
The user provides a location dataset with columns as locations on the spacecraft surface, rows as species, and cells with number of reads of each species at the location.
We aim to look for the most concerning contaminants. For each species, we look for information about their traits in our curated dataset (included in the package). We look for a presence of the following 5 traits: radiation resistance, sporulation, thermophiles, psychrophiles, and anaerobic metabolism. Depending on how many of these traits the species has we assign a score (the default is 1 point for each of these traits). Both the score weights and the curated data file can be changed (using flags -config and -datfile respectively).
Once we have information about the species, we report positives as follows:
- Species must have score above a threshold (default is 1 but may be changed using the
-tflag) - Species must be present on at least one location. The threshold for the minimum number of reads that qualifies as a species as present is the local threshold. (default is 2000, may be changed using the
-localflag)
These species are reported as positive contaminants. You can also generate pdfs with relevant charts and venn diagrams using the package.
This was built as a part of my SURF Project over Summer 2021.
Built With
This section should list any major frameworks that you built your project using.
Environment: Visual Studio (1.49), MacOS Catalina (10.15.7)
Getting Started
To install and run the package follow these simple steps.
Prerequisites
You only require python3 and pip to install the package.
Installation
Use the following command in your terminal to install the package.
pip install checkContaminants
or alternatively
pip3 install checkContaminants
To check if the package has installed, run the following command.
pip show checkContaminants
Test the package
pytest --pyargs checkContaminants
Usage
This package can be used both using a command line interface. It can also be imported into a python script and the methods can be used individually.
I. Through the Command Line Interface
Use the commands:
checkContaminants
or
checkContaminants -h
or
checkContaminants --help
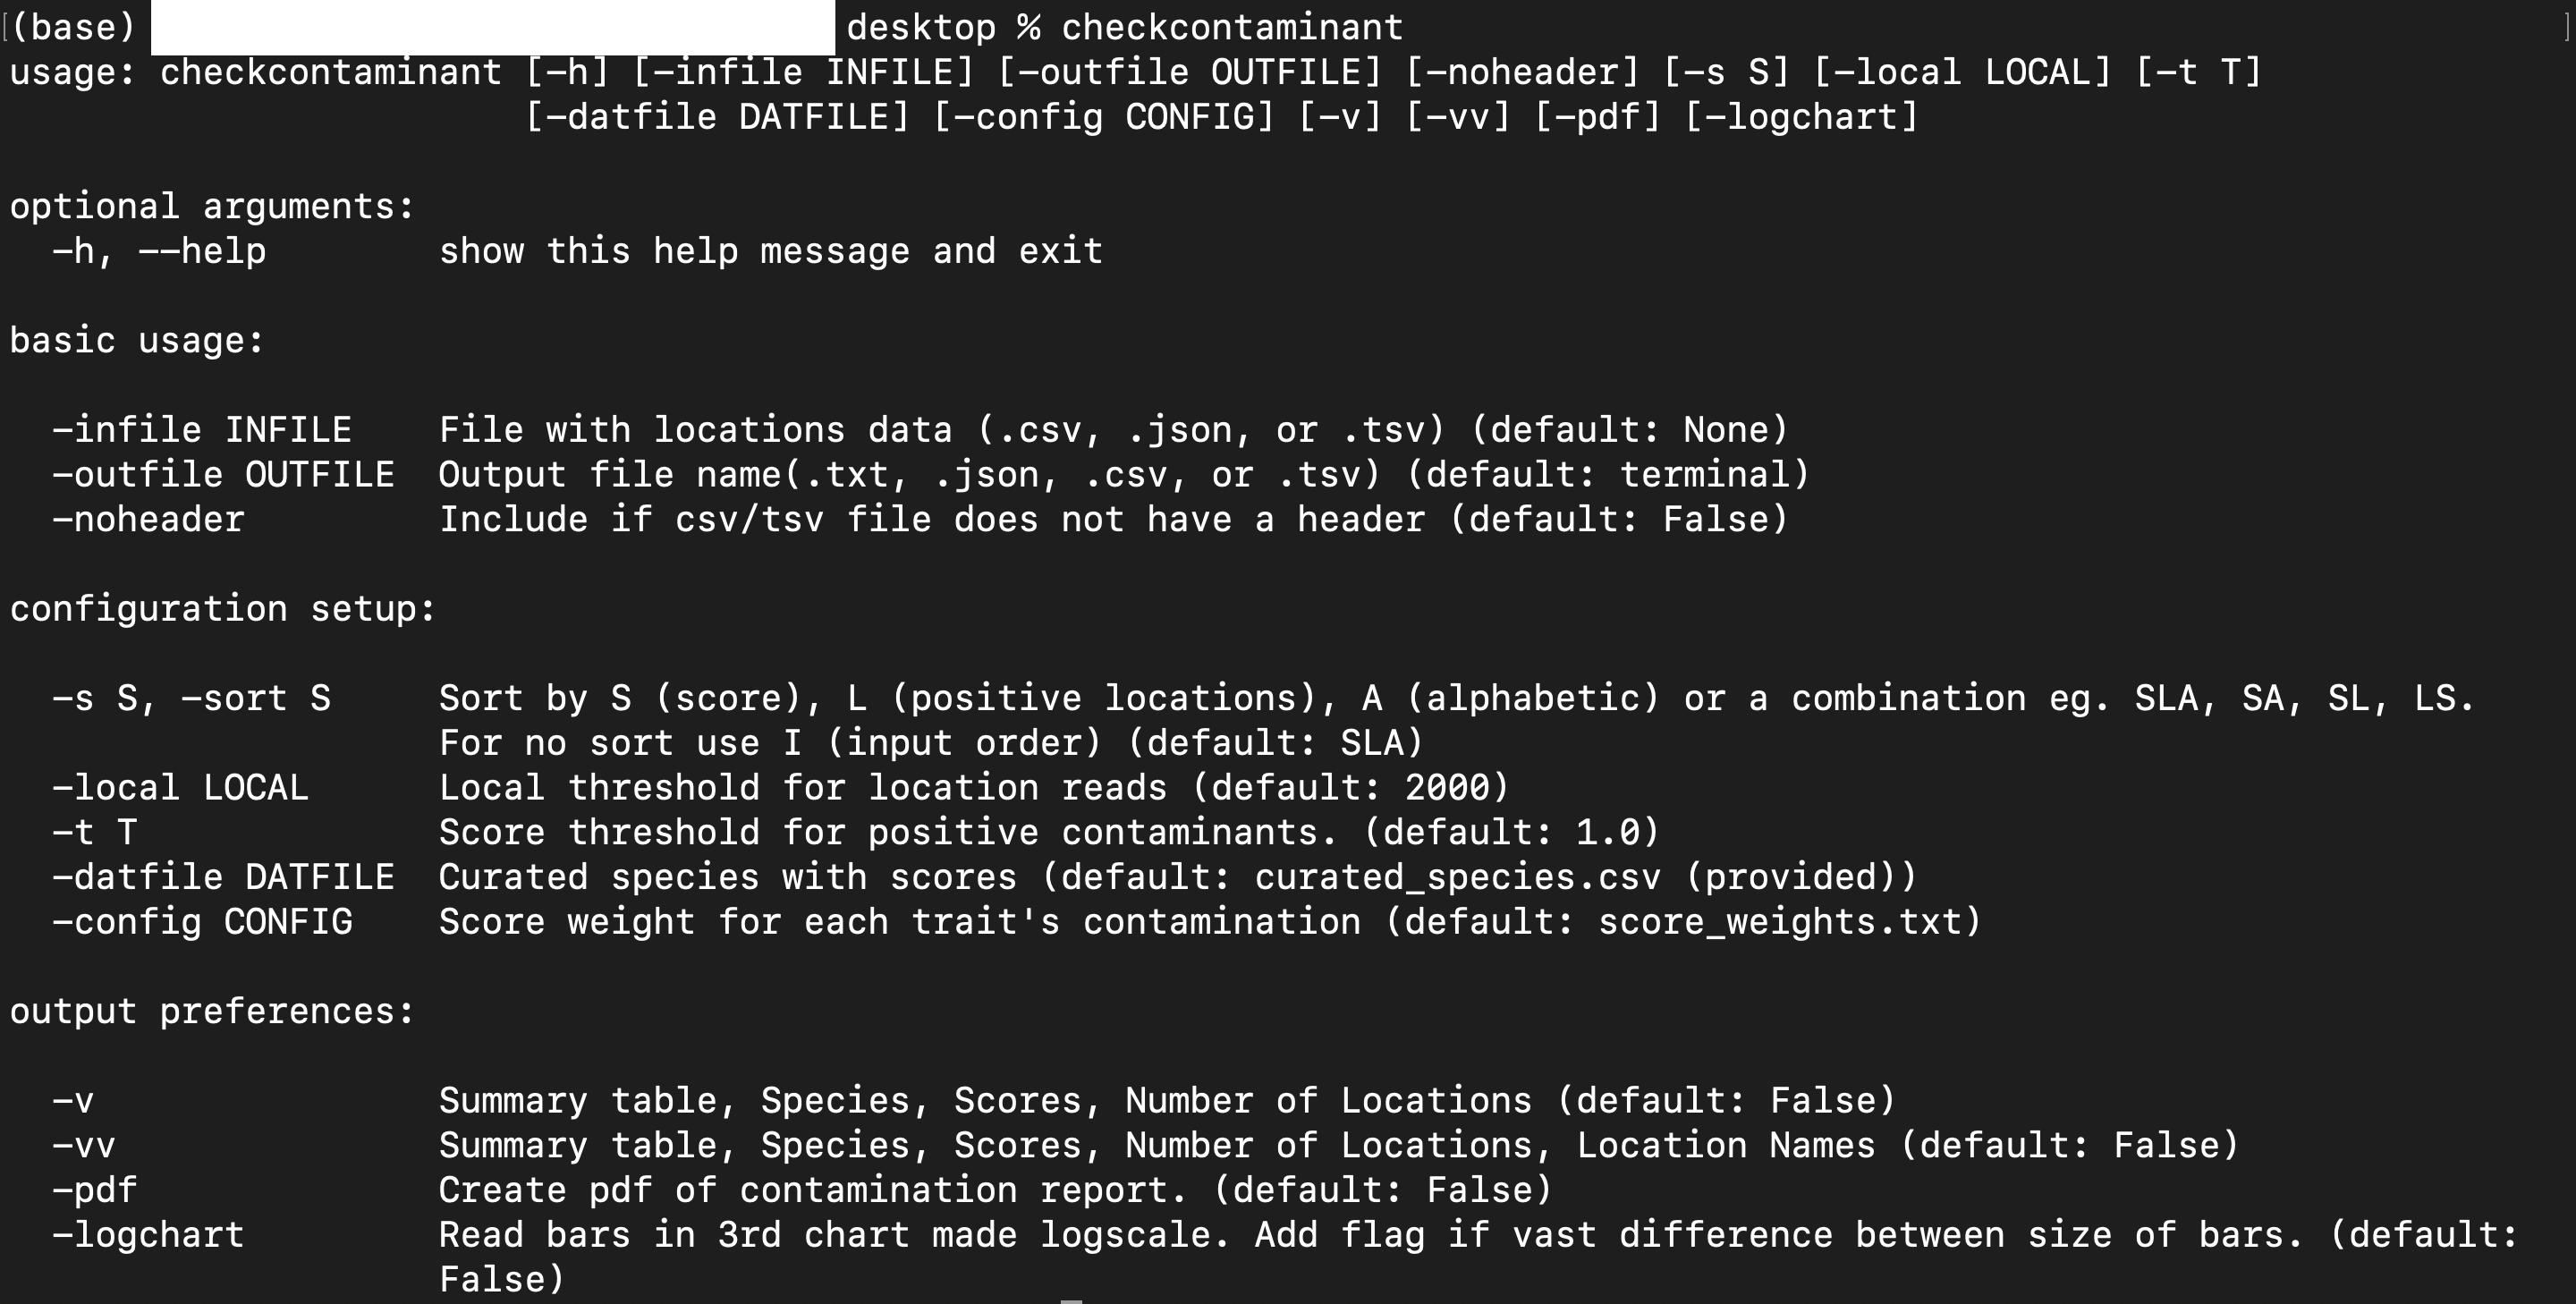
to view the help menu with a complete list of options.
This is the menu that you should see:
There are 3 categories of arguments:
- basic usage
- configuration setup
- output preferences
Basic Usage Arguments
-infile
infile is a required argument. Follow the infile argument with the file name of thhe file that is to be analyzed.
checkContaminants -infile inputdatafile.csv
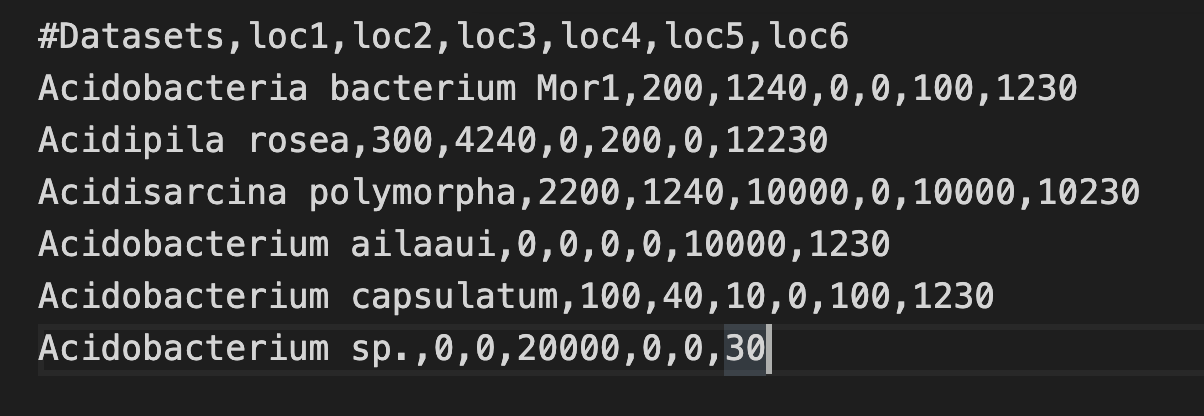
Details of the input file:
- The column names must be location names, the rows must be species names. Each cell contains the number of reads of the particular specie at that location. This value must be a non-negative integer.
- The input file may be a csv, tsv, or json. It could also be a compressed file (with ending .csv.gz or .tsv.gz)
- If the location names are unavailable (columns are not named in the csv/tsv), then we name the columns with loc1, loc2, etc. for the output and the charts. If location names are unavailable, use the flag '-noheader'
Example csv:
-outfile
outfile is an optional argument. If it is unspecified, the output is printed to the terminal.
There are three possible output file types (.txt, .csv, .tsv, or .json)
checkContaminants -infile inputdatafile.csv -outfile results.txt
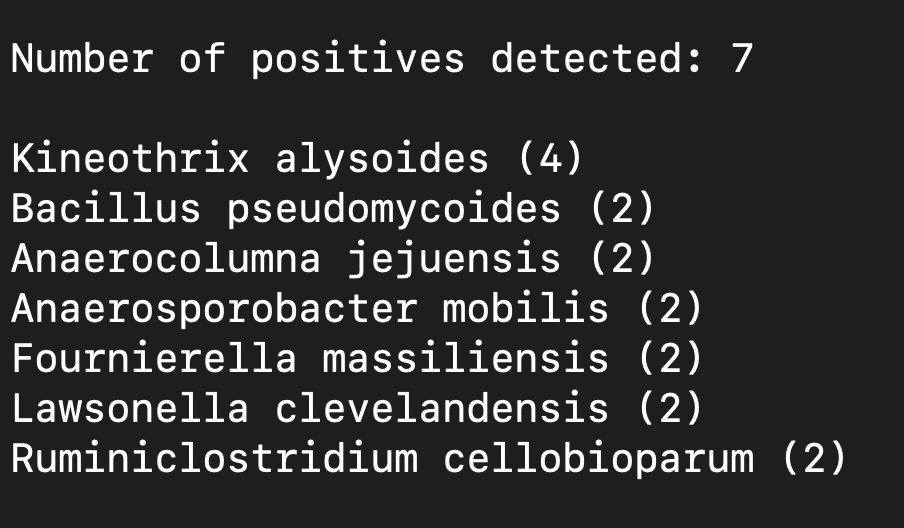
A text output looks as follows (different verbosities are detailed later):
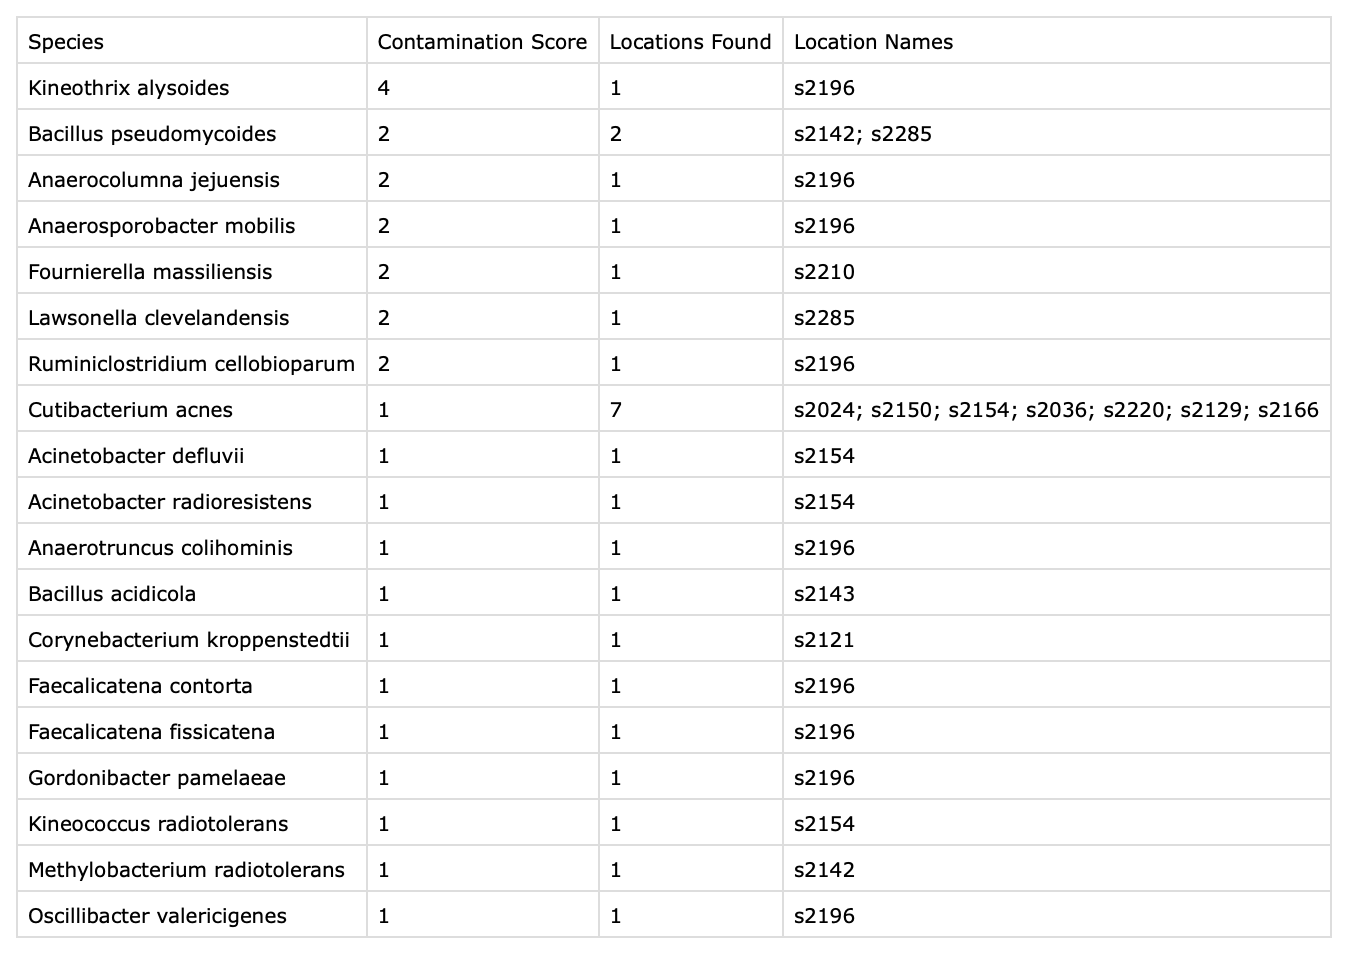
A csv output looks as follows:
Configuration Setup
-sort
The output may be sorted by score (S), number of positive locations (L), or alphabetically by species name (A). You can also give it a combination of two (SL means to first sort by score then by number of positive locations). The default value is SLA.
If you do not want the order of species to change, use flag -sort I which will leave the result in the input's order.
-local
The local threshold the number of reads beyond which we consider a location to be contaminated by the species. The default value is 2000. It can be changed by including a tag as follows:
checkContaminants -infile inputdatafile.csv -local 3000
-t
The score threshold may also be changed. By default, all species with 1 or more of the 5 concerning traits (radiation resistance, thermophilic, psychrophilic, sporulating, anaerobic) are considered contaminants.
-datfile
This is where a datafile may be specified from where the program can access information about the species.
We have provided a default datafile with 1857 unique species and a value of 0 or 1 assigned to 5 columns (psychrophilic, thermophilic, anaerobe, Radiation Tolerance, Spore formation). There are also other columns (aerobe, mesophilic, etc.) By changing the configuration file using the -config flag detailed below, you can vary how much weight to give these traits in the final score. Default weight for these is 0.
-config
The default values for configuration are as follows:
{"psychrophilic": 1,
 "mesophilic": 0,
 "thermophilic": 1,
 "Spore formation": 1,
 "aerobe": 0,
 "anaerobe": 1,
 "obligate aerobe": 0,
 "obligate anaerobe": 1,
 "facultative aerobe": 0,
 "facultative anaerobe": 1,
 "microaerophile": 1,
 "aerotolerant": 1,
 "Radiation Tolerance": 1}
Use the -config flag to specify a text file in the same format to change the weights given to each trait. For instance:
{"psychrophilic": 1.2,
 "mesophilic": 0.3,
 "thermophilic": 1.6,
 "Spore formation": 1.6,
 "anaerobe": 1.2,
 "Radiation Tolerance": 2.5}
- If non-integer values are used for this configuration the -pdf flag cannot be used
- Keys specified in this file must also be columns in the datfile above.
Output Preferences
Verbosity Modes:
There are 3 verbosity modes.
The first is the least verbose, it is the default (with no flags). It prints the number of species above the threshold value. It lists the contaminants (species with scores above the threshold).

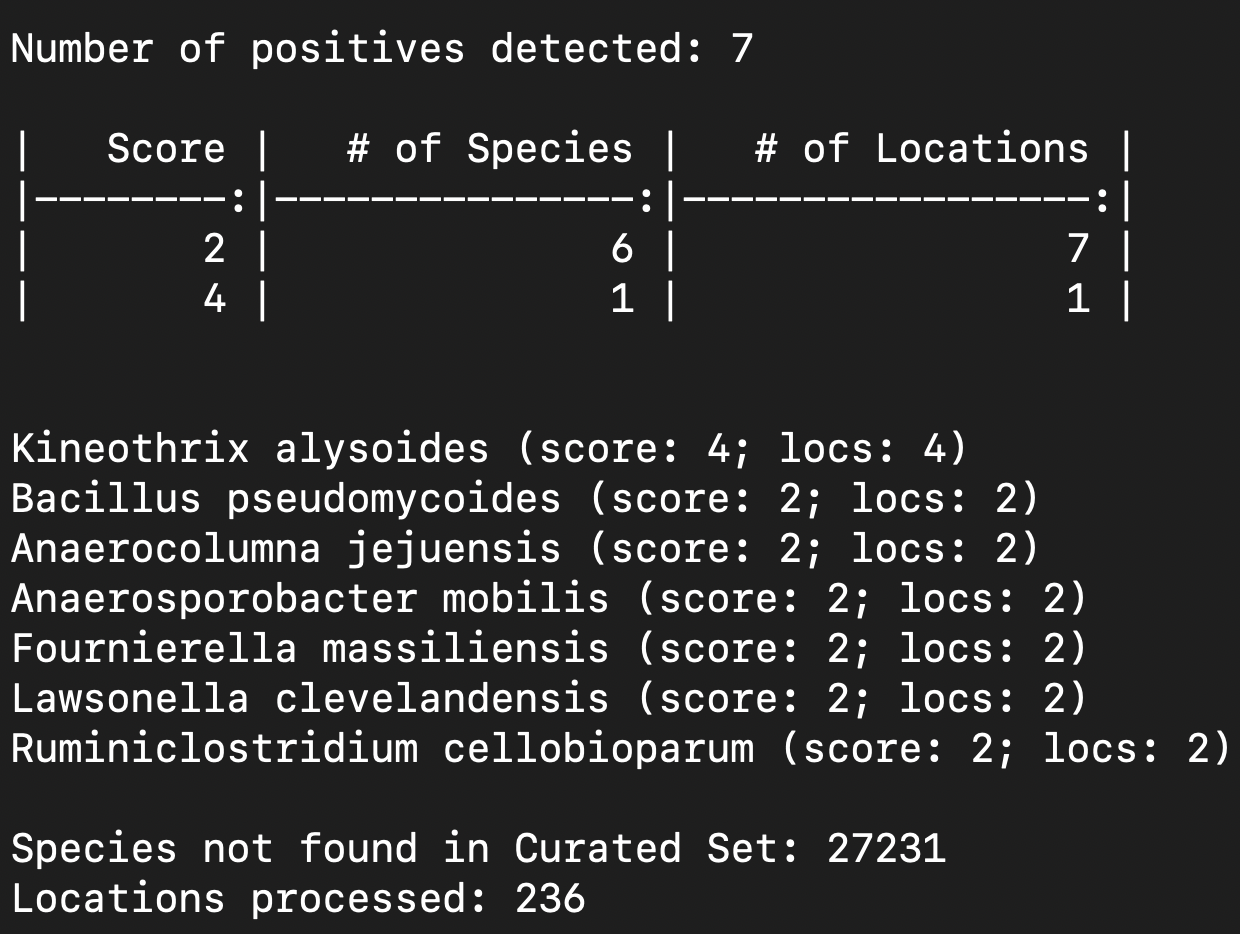
The second is with -v as flag. It prints Species name (score; number of positive location). It also outputs a summary table with scores, number of species of that score, and the number of locations over which they are spread. Verbosity -v outputs also provide the number of species that were not found in the curated species in the datfile as well as the total number of locations processed.
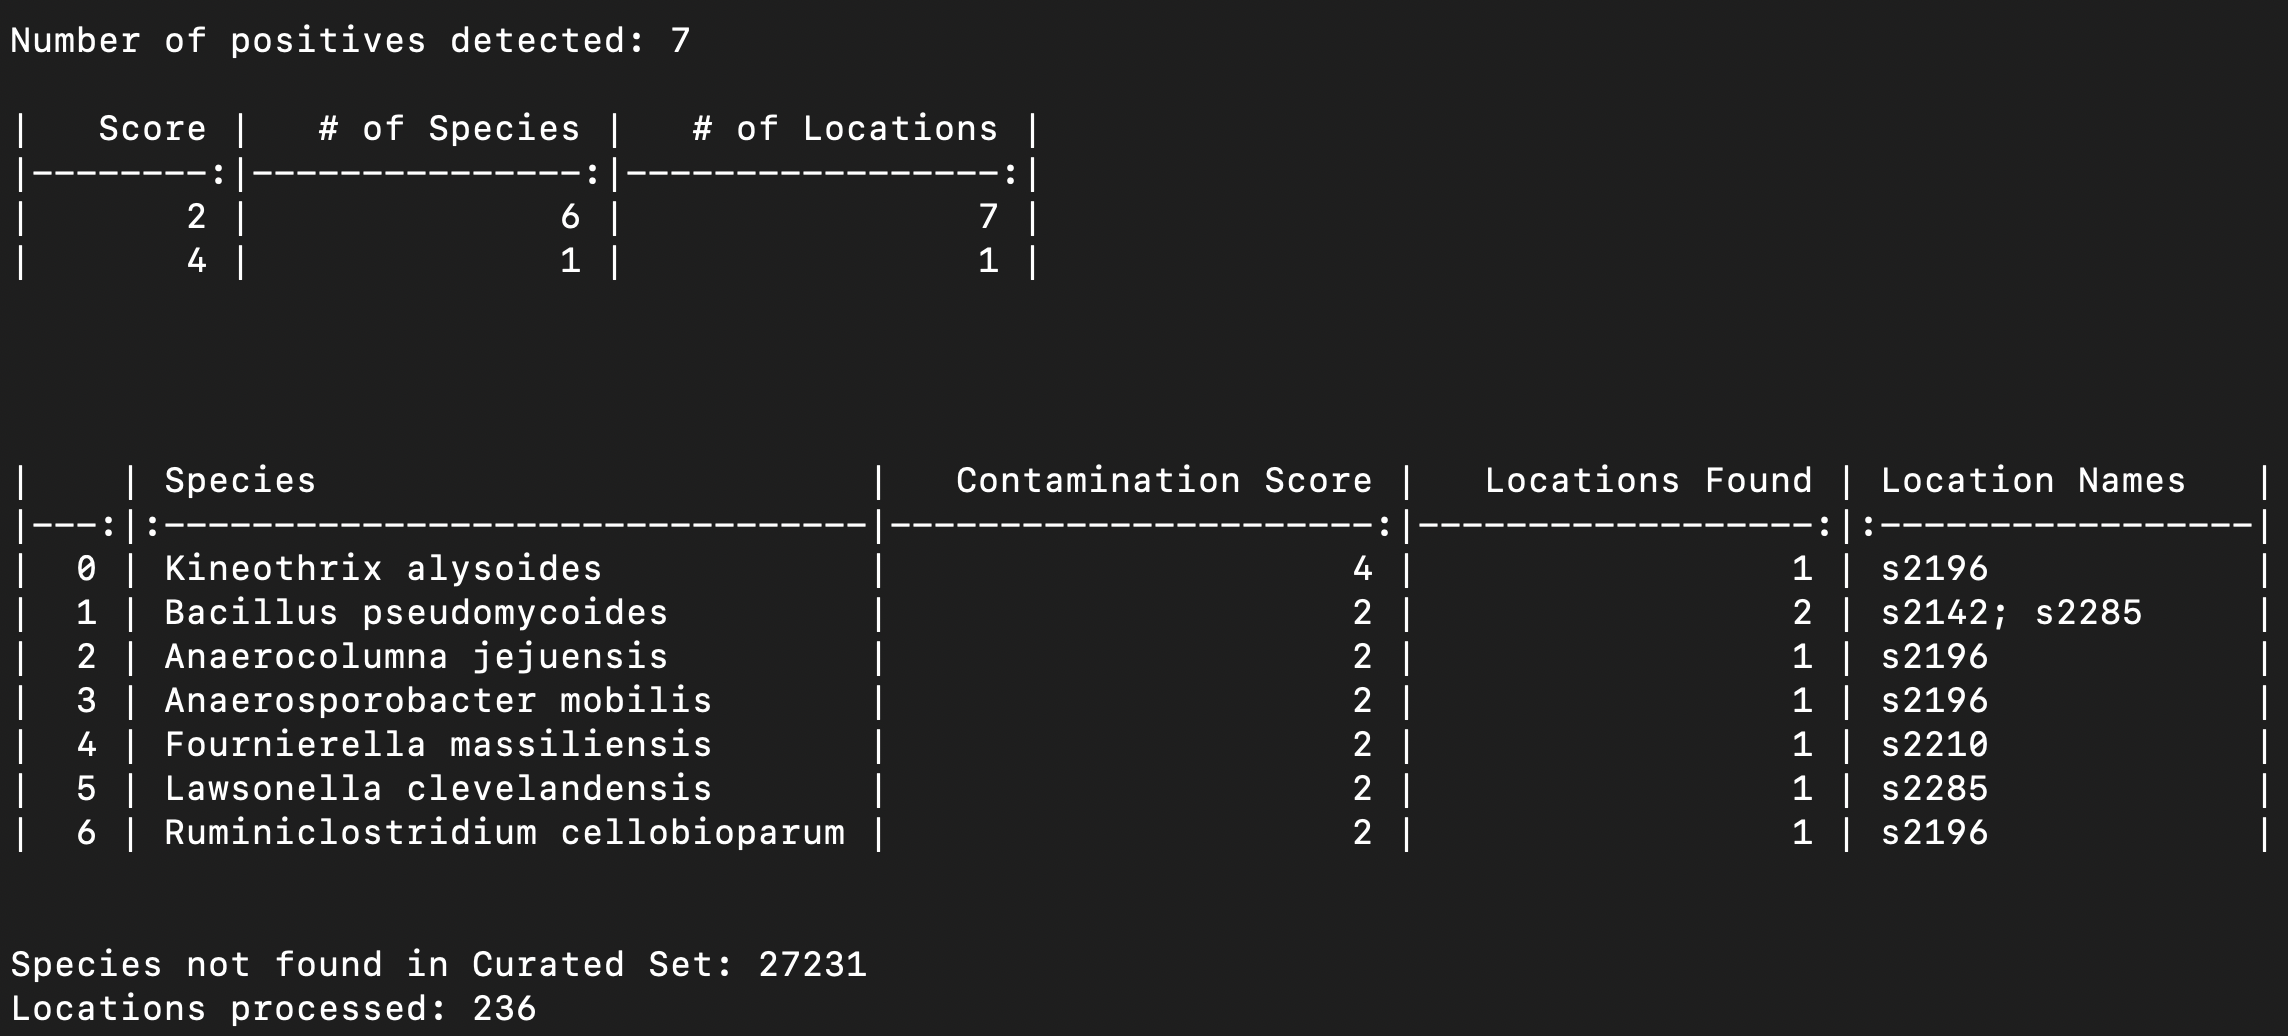
The verbosity -vv output is mostly the same as the verbosity -v output. Except that the names of the species their scores and # of locations are tabulated. There is also a column where the location names are listed.
By including this flag, a pdf with 3 charts is generated. Also, a pdf with relevant venn diagrams are generated. These are saved to the directory in which the script is run.
The pdf looks as follows:
The venn diagrams file looks like this:
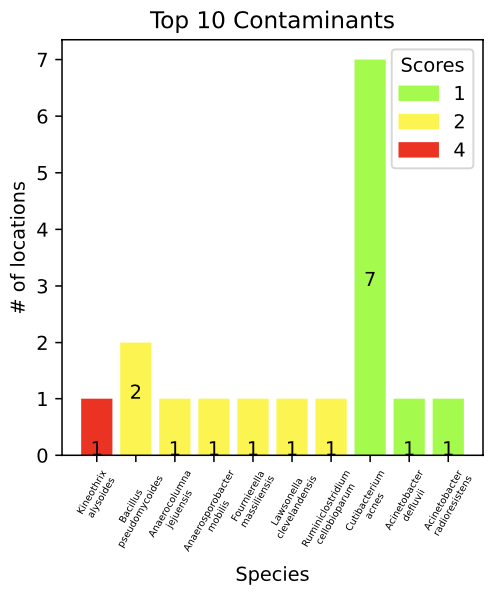
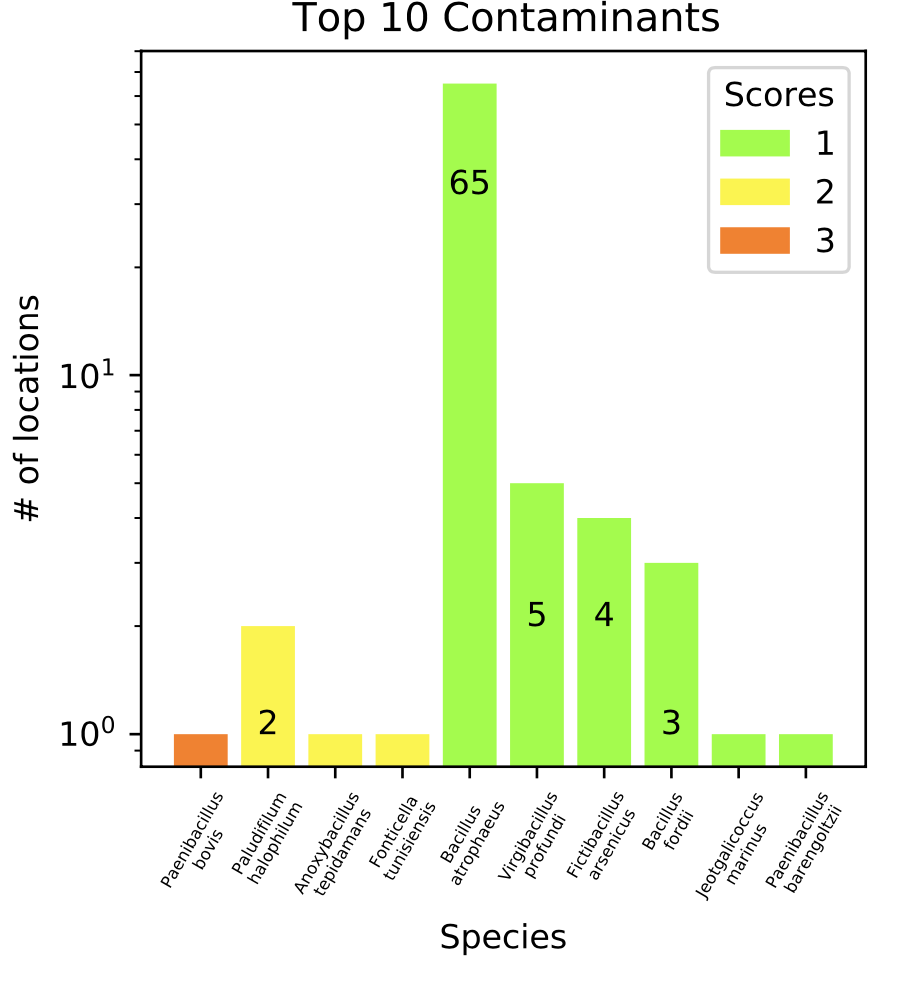
The second chart of the pdf may switch to a log scale y-axis when reasonable. For example:
Linear Scale Chart Example:
Log Scale Chart Example:
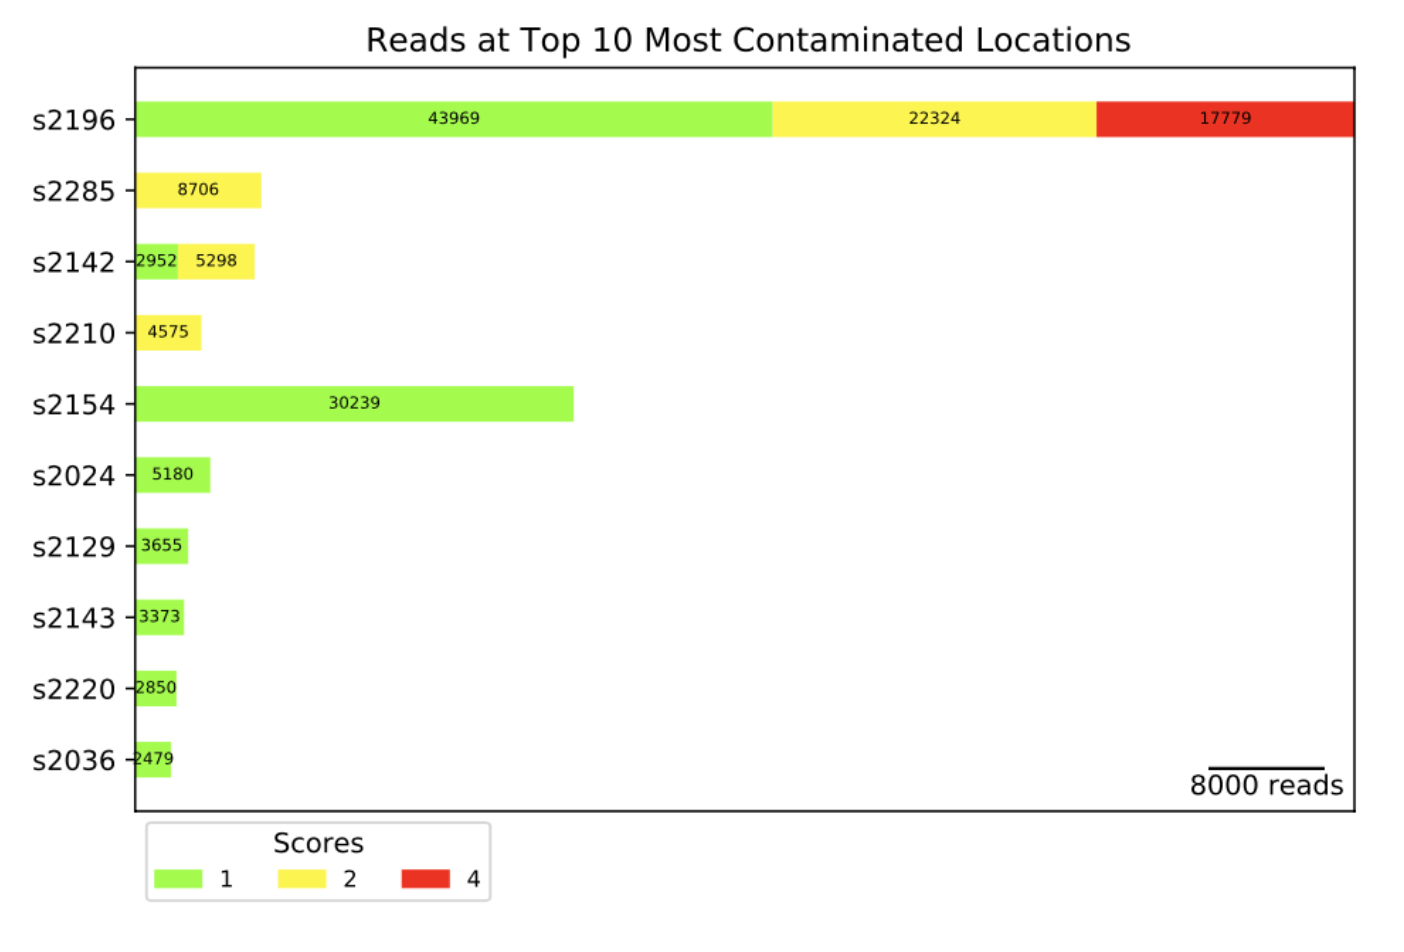
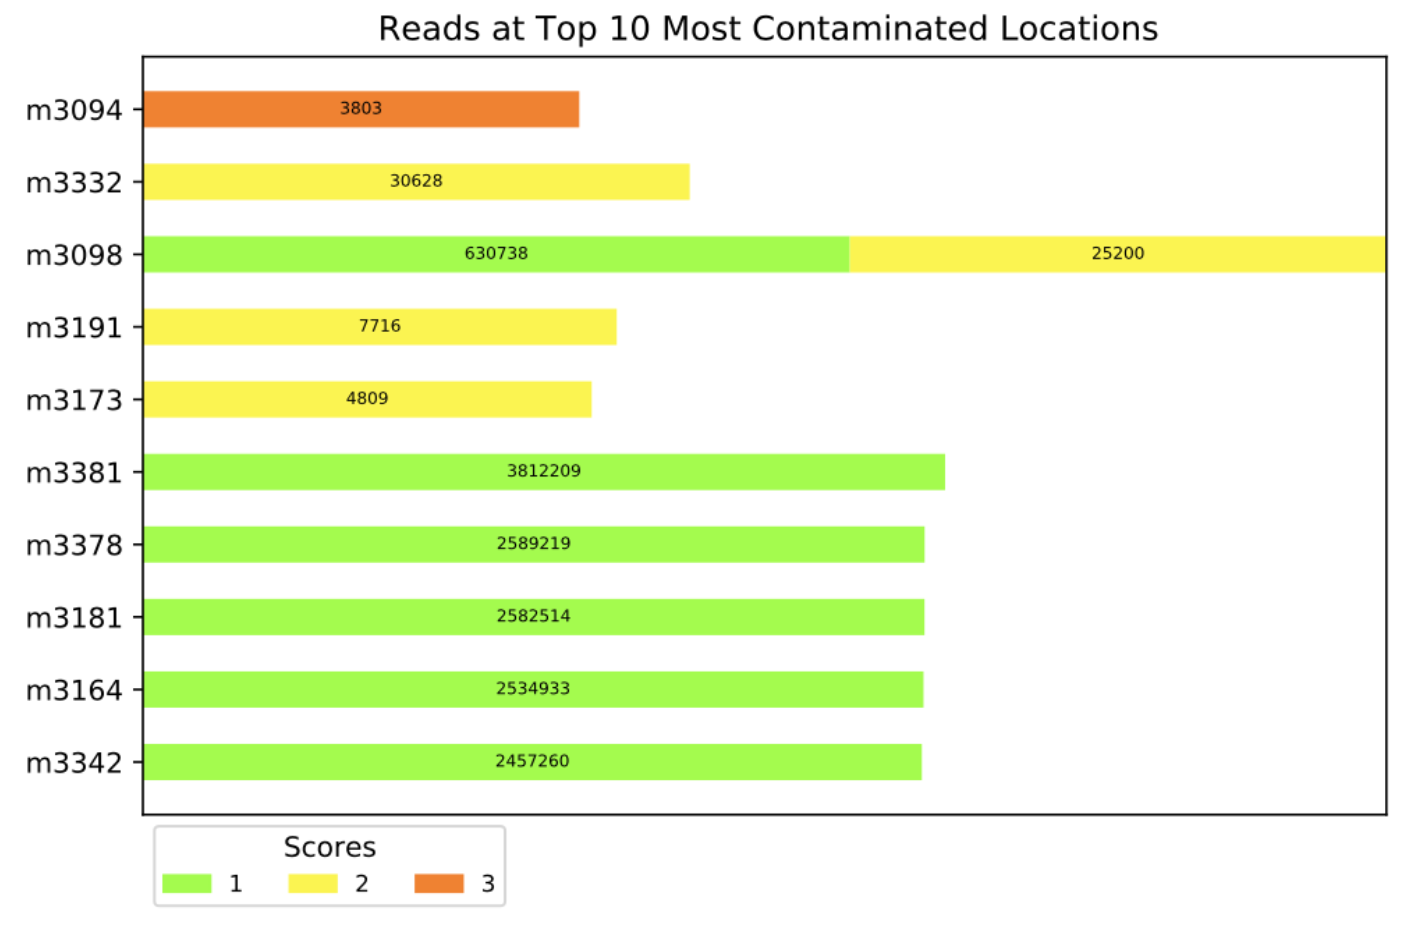
The scale of the x-axis of the third chart is controlled by the -logchart flag. If the flag is included, the chart may have a log scale x-axis if the ratio of the biggest bar to the smallest bar is greater than 100. The two diagrams look as follows:
Linear Scale Chart Example:
Log Scale Chart Example:
II By Importing as a Module
Available methods:
data:
- get_score
- get_score_dict
diagrams:
- bar_species_for_each_score
- bar_locs_for_top10_species
- survey_reads_at_top10_locs
Usage:
Report Issues
See the open issues for a list of proposed features (and known issues)
License
Distributed under the MIT License. See LICENSE for more information.
Contact
Dr. Ashish Mahabal - aam@astro.caltech.edu
Dr. Nitin Singh - nitin.k.singh@jpl.nasa.gov
Nishka Arora - naarora@caltech.edu
Dr. Moogega Cooper - moogega.cooper@jpl.nasa.gov
Pypi Link:
Project Link: https://github.com/checkContaminants/checkSpaceContamination
Project details
Download files
Download the file for your platform. If you're not sure which to choose, learn more about installing packages.
Source Distribution
Built Distribution
Hashes for checkContaminants-0.99.5-py3-none-any.whl
| Algorithm | Hash digest | |
|---|---|---|
| SHA256 | 3c99640bbcafc158a27b07e4de490f5e2a8688a1598e71ee00c5094fe9d280bc |
|
| MD5 | 1a4e23d771030e60b75c91b898029d48 |
|
| BLAKE2b-256 | c983db18d7b63f5b7b188645e0b54a7c6817902db10efbfbdc4806c890f36945 |


