
CsdTools
A collection of scripts wrapping scipy.signal.csd for some extra features. Most notably, wrapped csd allows one to get uncertainties when using averaging. Future goal is to have more averaging in higher frequency bins of spectrum while getting same number of points per decade.
Usage
See example notebook for a working example.
Using welch with mean and get standard deviation
Import csd and welch from csdTools.
from csdTools import csd, welch
import numpy as np
import matplotlib.pyplot as plt
from matplotlib import cm
from scipy import signal
import matplotlib.ticker as mticker
#******************************************************************************
#Setting RC Parameters for figure size and fontsizes
import matplotlib.pylab as pylab
params = {'figure.figsize': (16, 12),
          'xtick.labelsize':'xx-large',
          'ytick.labelsize':'xx-large',
          'text.usetex': False,
          'lines.linewidth': 4,
          'font.family': 'serif',
          'font.serif': 'Georgia',
          'font.size': 20,
          'xtick.direction': 'in',
          'ytick.direction': 'in',
          'xtick.labelsize': 'medium',
          'ytick.labelsize': 'medium',
          'axes.labelsize': 'medium',
          'axes.titlesize':'medium',
          'axes.grid.axis': 'both',
          'axes.grid.which': 'both',
          'axes.grid': True,
          'grid.color': 'xkcd:cement',
          'grid.alpha': 0.3,
          'lines.markersize': 12,
          'lines.linewidth': 2.0,
          'legend.borderpad': 0.2,
          'legend.fancybox': True,
          'legend.fontsize': 'medium',
          'legend.framealpha': 0.8,
          'legend.handletextpad': 0.5,
          'legend.labelspacing': 0.33,
          'legend.loc': 'best',
          'savefig.dpi': 140,
          'savefig.bbox': 'tight',
          'pdf.compression': 9}
pylab.rcParams.update(params)
#******************************************************************************
Generate two signal with some common features.
fs = 10e3
N = 1e6
amp = 20
freq = 1234.0
noise_power = 0.001 * fs / 2
time = np.arange(N) / fs
b, a = signal.butter(2, 0.25, 'low')
x = np.random.normal(scale=np.sqrt(noise_power), size=time.shape)
y = signal.lfilter(b, a, x)
x += amp*np.sin(2*np.pi*freq*time)
y += np.random.normal(scale=0.1*np.sqrt(noise_power), size=time.shape)
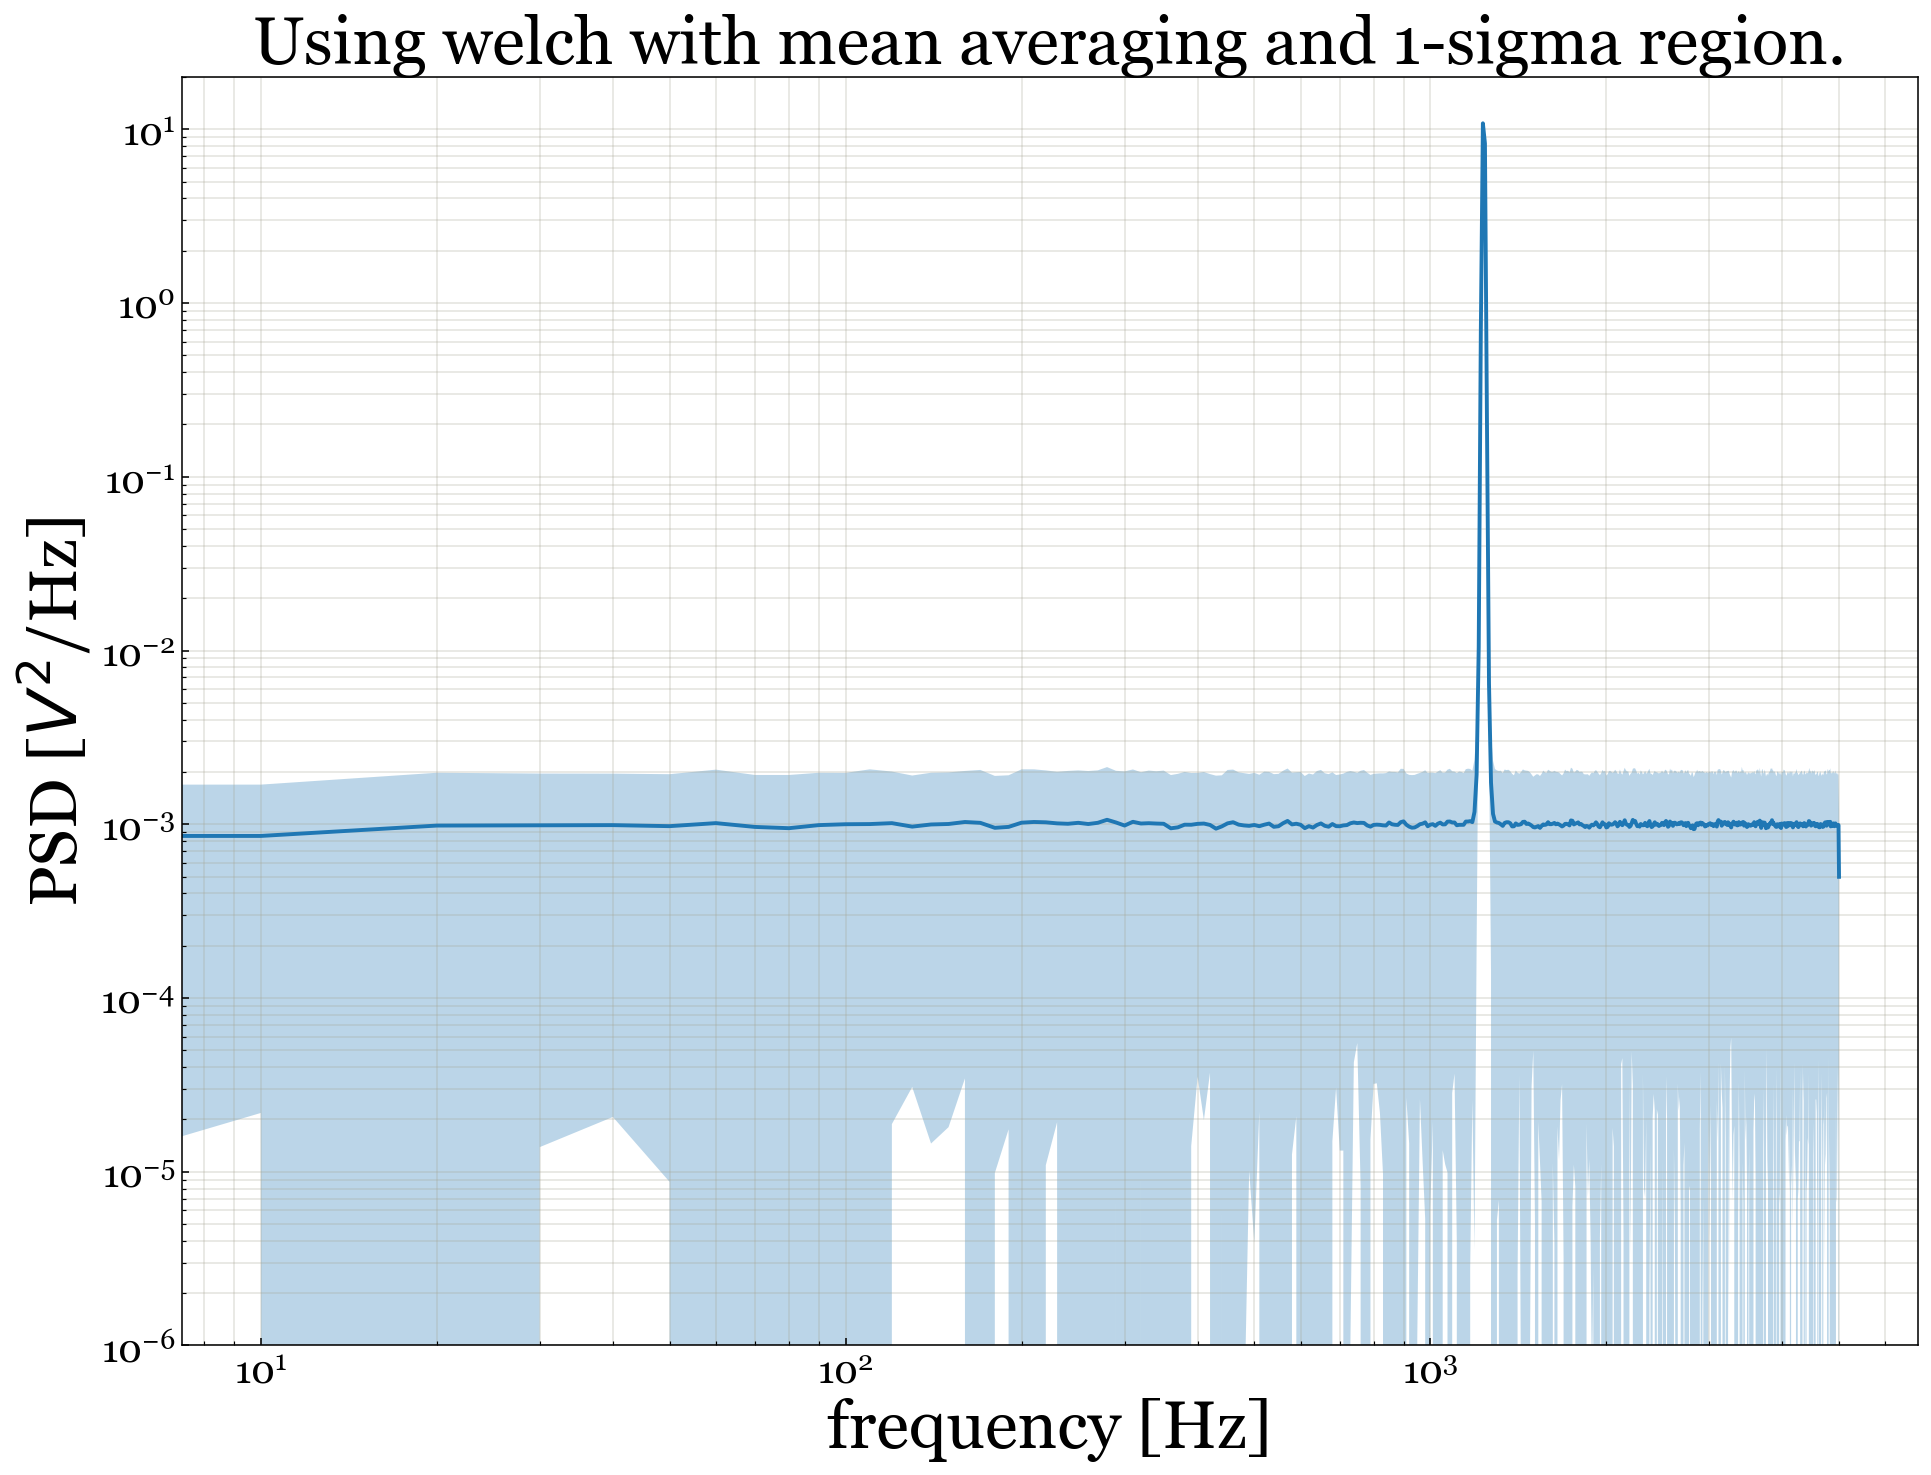
Use welch function as you would for scipy.signal.welch but give extra argument getUnc=True
f, Pxx, Pxxstd = welch(x, fs, nperseg=1000, average='mean', getUnc=True)
fig, ax = plt.subplots(1, 1, figsize=[16, 12])
ax.plot(f, np.abs(Pxx))
ax.fill_between(f, np.abs(Pxx) - np.abs(Pxxstd), np.abs(Pxx) + np.abs(Pxxstd), alpha=0.3)
ax.set_yscale('log')
ax.set_xscale('log')
ax.set_ylim(1e-6, 2e1)
ax.set_xlabel('frequency [Hz]', fontsize='xx-large')
ax.set_ylabel('PSD [$V^2$/Hz]', fontsize='xx-large')
ax.set_title('Using welch with mean averaging and 1-sigma region.',
             fontsize='xx-large')
Using welch with median and get upper-lower bounds
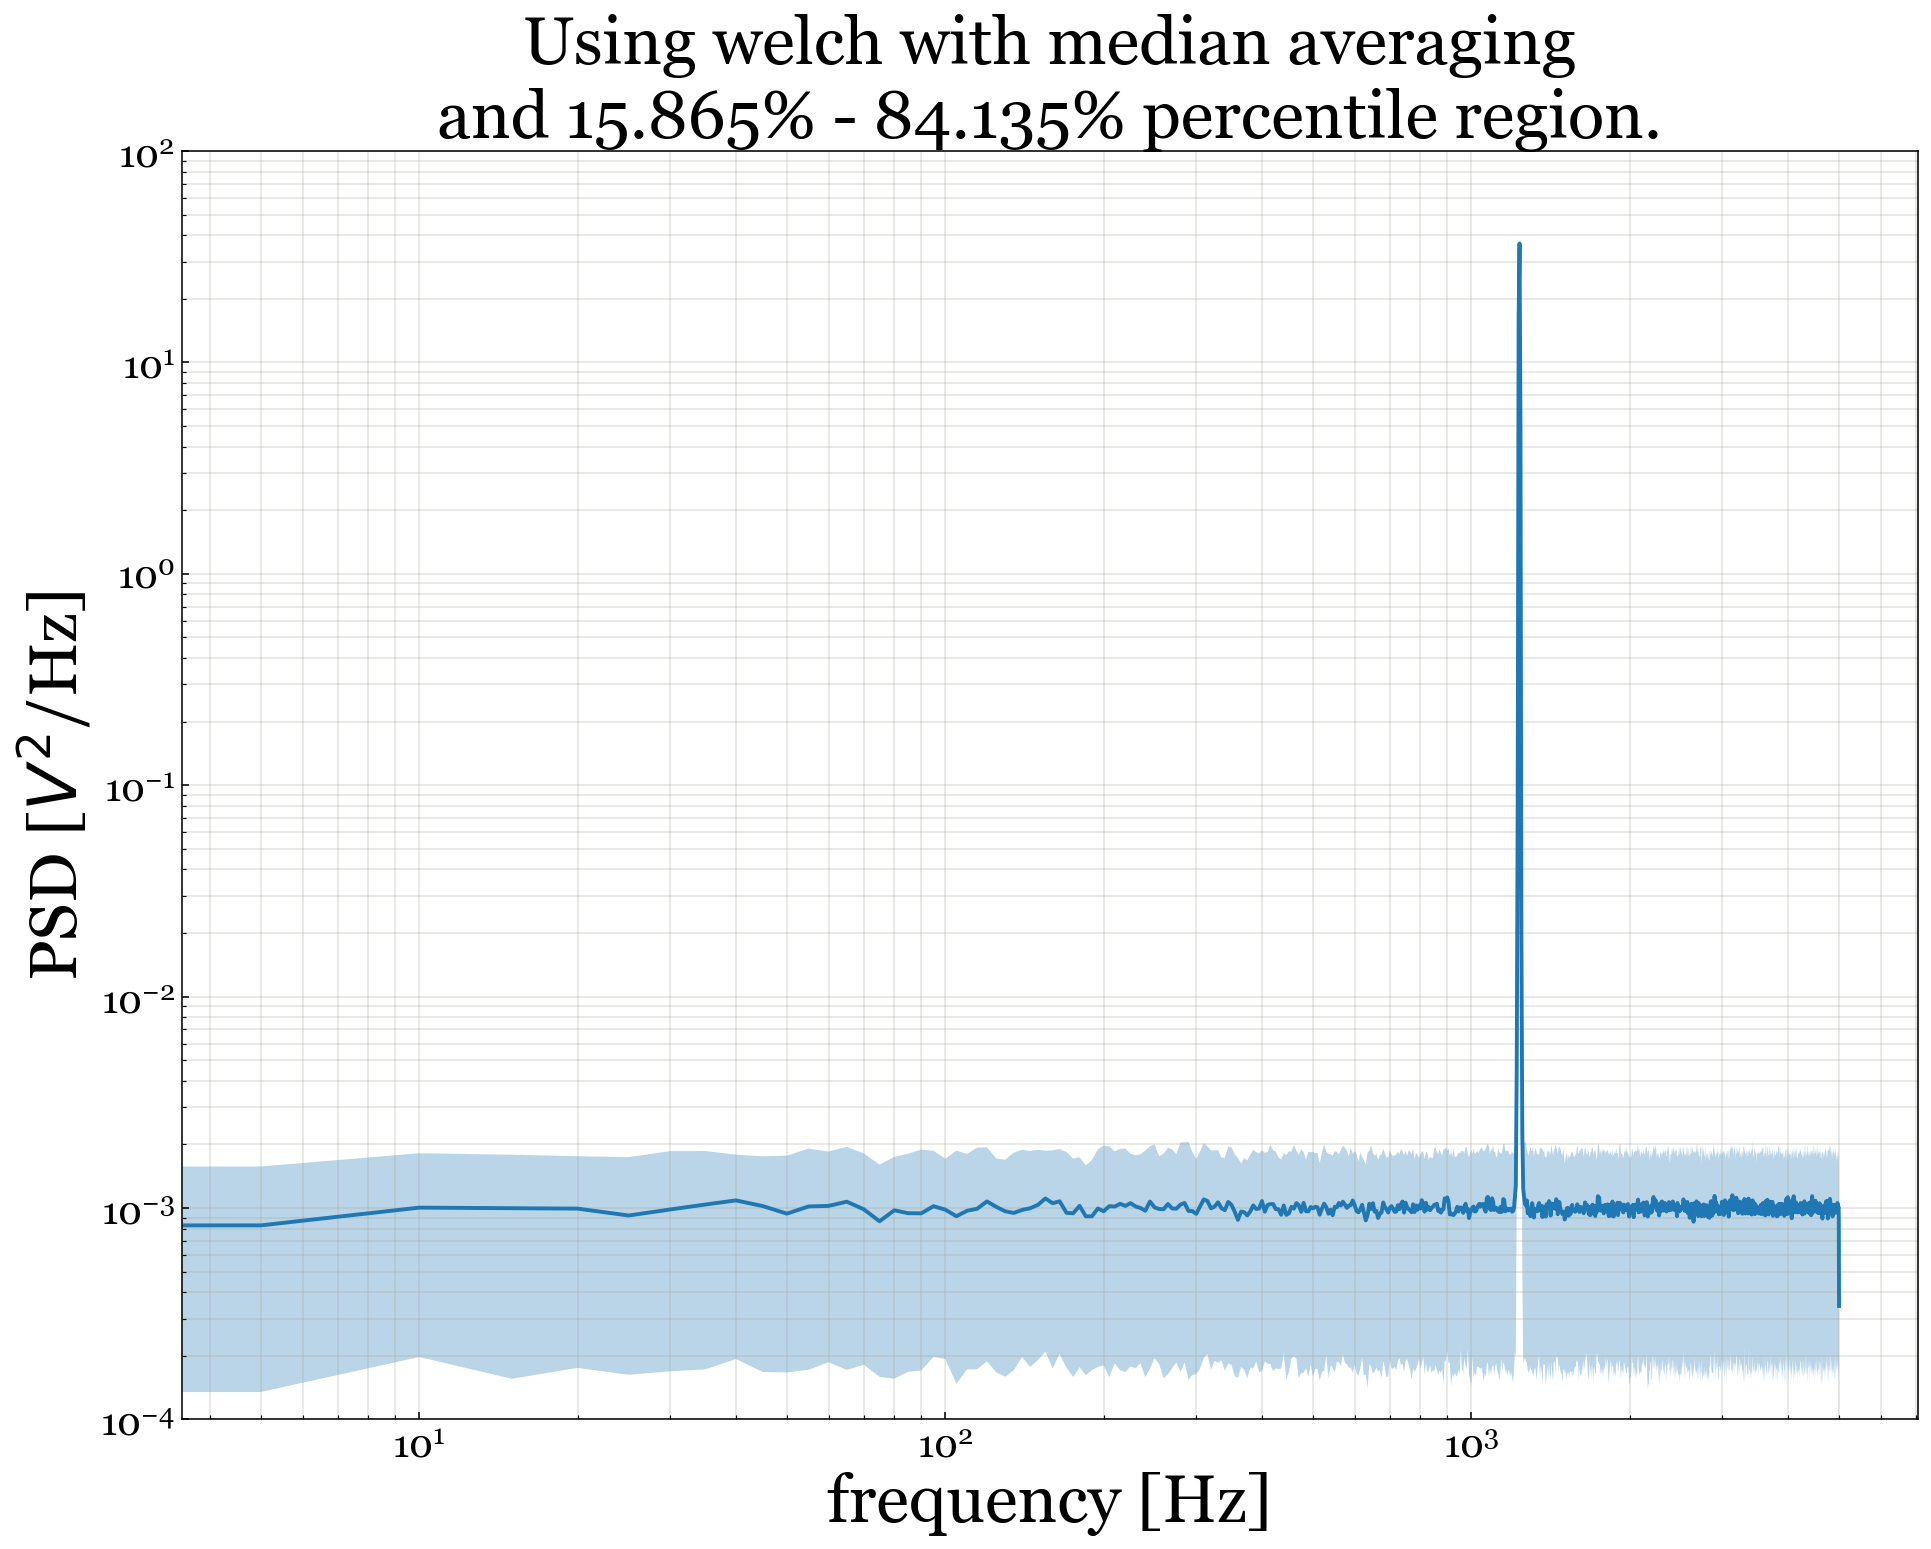
f, Pxx, Pxxlb, Pxxub = welch(x, fs, nperseg=2000, average='median', getUnc=True)
fig, ax = plt.subplots(1, 1, figsize=[16, 12])
ax.plot(f, np.abs(Pxx))
ax.fill_between(f, np.abs(Pxxlb), np.abs(Pxxub), alpha=0.3)
ax.set_yscale('log')
ax.set_xscale('log')
ax.set_ylim(1e-4, 1e2)
ax.set_xlabel('frequency [Hz]', fontsize='xx-large')
ax.set_ylabel('PSD [$V^2$/Hz]', fontsize='xx-large')
ax.set_title('Using welch with median averaging\nand 15.865% - 84.135% percentile region.',
             fontsize='xx-large')
Using csd with 'no' averaging and getting full distribution of data
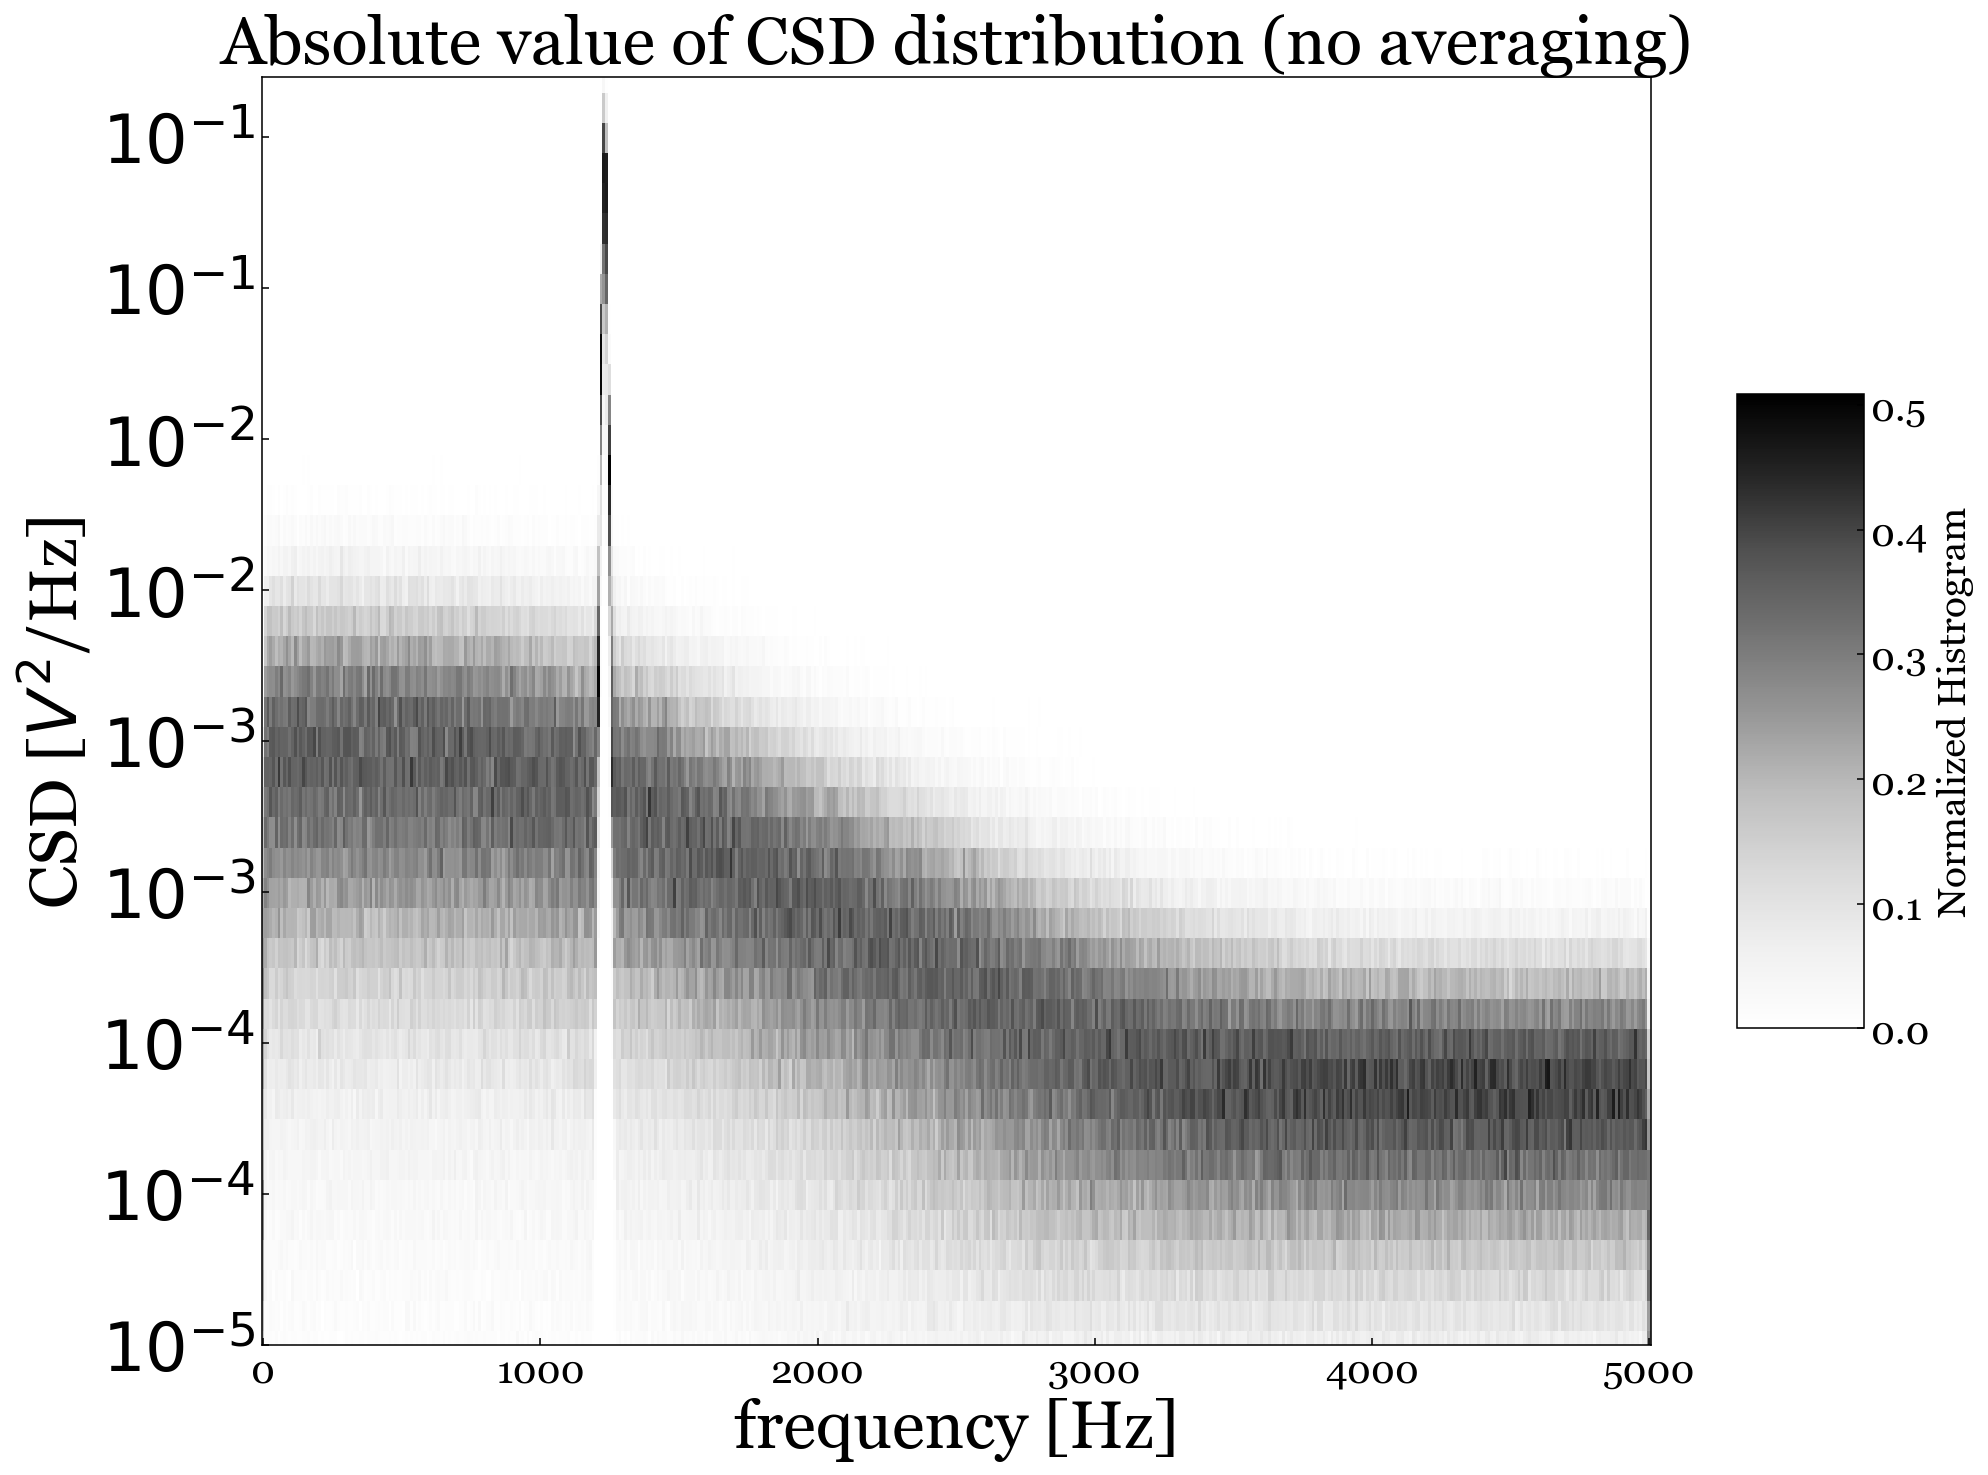
Sometimes, we are interested in how the PSD or CSD of data is distributed across time.
We can have no averaging by setting average='no' in csd or welch function and would
get PSD or CSD with extra dimension containing individual PSD or CSD of each time window
considered.
f, Pxy = csd(x, y, fs, nperseg=1024, average='no', getUnc=True)
This can be histogrammed at each frequency bin to understand the underlying distribution.
Pxyhist = np.zeros((Pxy.shape[0], 70))
bins = np.arange(-7, 0.1, 0.1)
for row in range(Pxy.shape[0]):
    Pxyhist[row, :], be = np.histogram(np.log10(np.abs(Pxy[row, :])), bins=bins)
    Pxyhist[row, :] /= np.linalg.norm(Pxyhist[row, :])
Plotting a pcolormesh.
fig = plt.figure(figsize=[16,12])
ax = fig.gca()
X, Y = np.meshgrid(f, be[:-1])
Z = np.transpose(Pxyhist)
pcm = ax.pcolormesh(X, Y, Z, cmap=cm.Greys, shading='auto')
ax.set_ylim(-5, -0.8)
ticks_loc = ax.get_yticks().tolist()
ax.yaxis.set_major_locator(mticker.FixedLocator(ticks_loc))
ax.set_yticklabels([r'$10^{' + str(int(ele)) + '}$' for ele in ticks_loc], fontsize='xx-large')
ax.set_xlabel('frequency [Hz]', fontsize='xx-large')
ax.set_ylabel('CSD [$V^2$/Hz]', fontsize='xx-large')

ax.set_title('Absolute value of CSD distribution (no averaging)', fontsize='xx-large')

# Add a color bar which maps values to colors.
fig.colorbar(pcm, shrink=0.5, aspect=5, label='Normalized Histrogram')
1 maintainer

Metadata
1 maintainer
Release files for csdTools 0.1.1
For a detailed explanation of source distributions (sdists) and built distributions (wheels), please see the package formats documentation.
Source distribution (sdist)
| File | Size | Uploaded | |
|---|---|---|---|
| csdTools-0.1.1.tar.gz | 598.0 kB | Details |
Release files / csdTools-0.1.1.tar.gz
| Download URL | csdTools-0.1.1.tar.gz |
|---|---|
| Size | 598.0 kB |
| Tags | Source |
|
SHA-256 checksum How to use checksums |
b856c3a59e3f16aafdc61e61f3f2eaf4345f9117b4302fe3cc73dd479aff2a2a
|
|
BLAKE2b-256 checksum How to use checksums |
a4a1024a9b12e6f379e475868ebd496f7a0294f03846be543edcebed95bea3a3
|
| Upload date | |
|
Uploaded using Trusted Publishing? What is trusted publishing? |
No |
| Uploaded via |
twine/3.4.1 importlib_metadata/3.10.1 pkginfo/1.5.0.1 requests/2.22.0 requests-toolbelt/0.9.1 tqdm/4.42.1 CPython/3.7.6
|














