
Dash Chartjs Component
Chart.js is one the most popular javascript charting library. Dash Chartjs Component is a Dash component library that renders ChartJs React component inside Dash App.
Installation
pip install dash-chartjs
Prop List
id (str): The ID used to identify this component in Dash callbacks.
type (str): Chart.js chart type.
data (dict): The data object that is passed into the Chart.js chart.
options (dict): The options object that is passed into the Chart.js chart.
redraw (boolean): Teardown and redraw chart on every update.
toolbox (boolean): Toolbox with reset and download buttons for chart.
customJSFunctions (dict): Write custom JS functions in dict format.
customPlugins (dict): Write Plugins in dict format.
actions (dict): List of action objects with name and handler properties. Each action will be rendered as a button below the chart.
clickData (dict): clickData returns the datasetIndex and index of data point clicked.
style (dict): Defines CSS styles which will override styles previously set.
Basic Usage
from dash import dash,html
import pandas as pd
from dash_chartjs import ChartJs

app = dash.Dash(__name__,meta_tags=[{"name": "viewport", "content": "width=device-width, initial-scale=1"}])

df = pd.read_csv('https://raw.githubusercontent.com/JetBlack101/visitors-to-georgia-ts-analysis/main/Data/VisitorsToGeorgia_2011-2019.csv')

df['Date'] = pd.to_datetime(df['Date'])

x = df['Date']
y = df['Visitors']

data = {
    'labels': x,
    'datasets': [{
        'label': 'Visitors to Georgia',
        'data': y,
        'fill':'false',
        'borderColor': 'rgb(75, 192, 192)',
        'tension': 0.1
    }]
}
options = {
    'scales': {
        'x': {
            'type':'time'
        }
    },
    'plugins':{
        'zoom':{
            'zoom':{
                'wheel':{
                    'enabled': True
                },
            'mode':'xy'
            }
        }
    }
}


app.layout = html.Div(
    [
        ChartJs(type='line',data=data,options=options)
    ]
)

if __name__ == '__main__':
    app.run_server(debug=False)
Demo
Additional Plugins Integrated
chartjs-plugin-zoom
chartjs-plugin-datalabels
Example
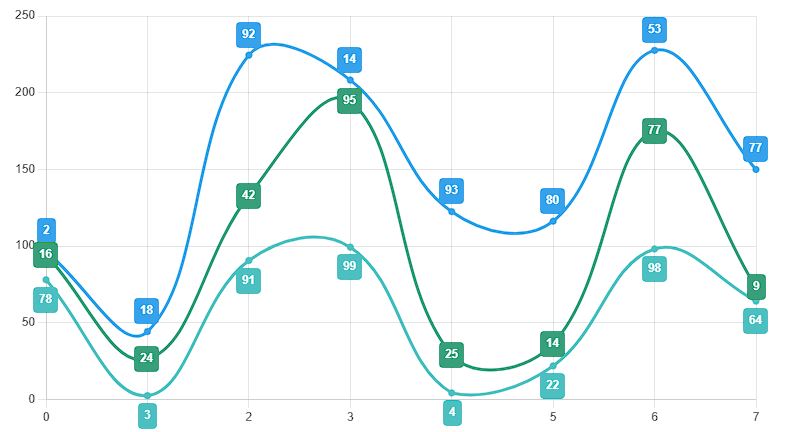
chartjs-plugin-annotation
Example
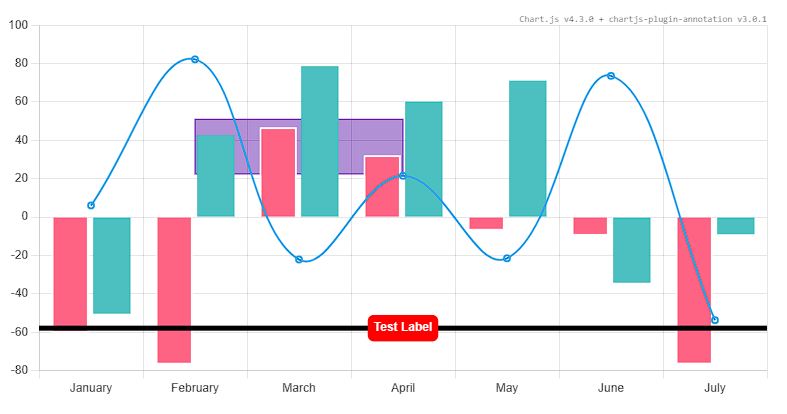
chartjs-chart-geo
Example
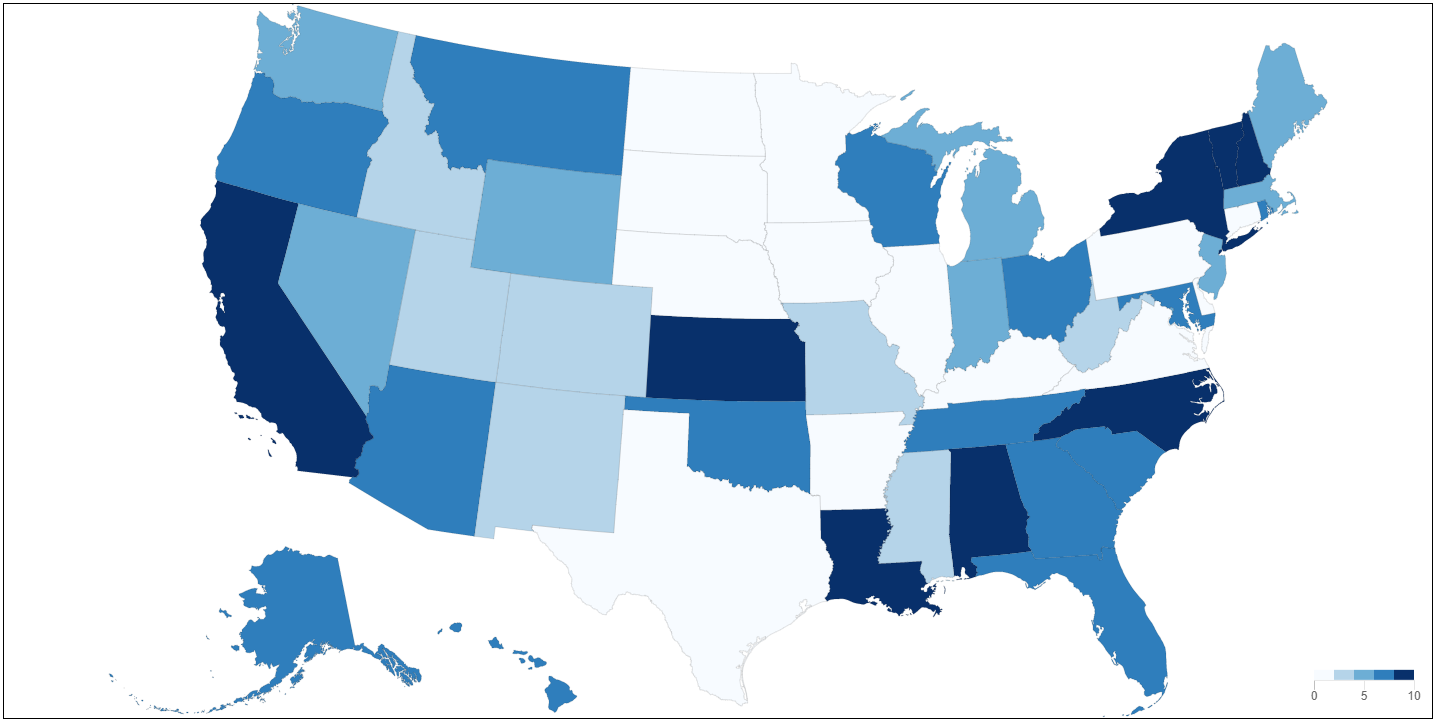
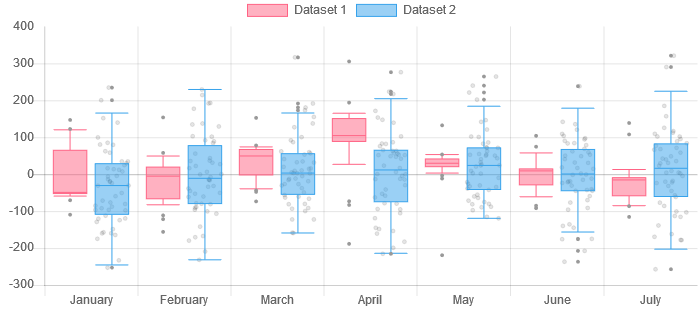
chartjs-chart-boxplot
Example
chartjs-chart-matrix
Example

chartjs-chart-treemap
Example

chartjs-chart-sankey
Example

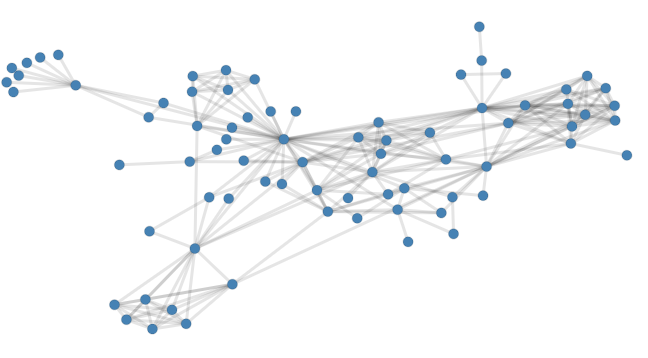
chartjs-chart-graph
Example
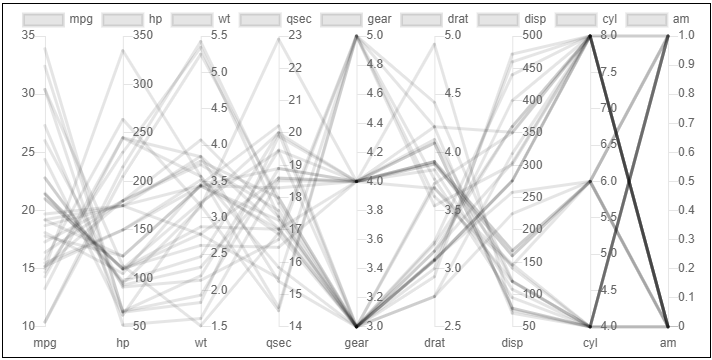
chartjs-chart-pcp
Example
1 maintainer

Metadata
1 maintainer
Release files for dash-chartjs 1.3.0
For a detailed explanation of source distributions (sdists) and built distributions (wheels), please see the package formats documentation.
Source distribution (sdist)
| File | Size | Uploaded | |
|---|---|---|---|
| dash_chartjs-1.3.0.tar.gz | 276.0 kB | Details |
Built distribution (wheel)
| File | Interpreter | ABI | Platform | Reset |
|---|---|---|---|---|
| dash_chartjs-1.3.0-py3-none-any.whl | Python 3 | none | any | Details |
Total release size: 551.5 kB
Release files / dash_chartjs-1.3.0.tar.gz
| Download URL | dash_chartjs-1.3.0.tar.gz |
|---|---|
| Size | 276.0 kB |
| Tags | Source |
|
SHA-256 checksum How to use checksums |
2878fc7951edeaa2eb64b84a77c175353c85695a045310cbe8bb6710e53ac6e2
|
|
BLAKE2b-256 checksum How to use checksums |
a5cc2c7098a3e2ef356e2d1a47bdd7383597c8605ab91ba497bb2efc6050894b
|
| Upload date | |
|
Uploaded using Trusted Publishing? What is trusted publishing? |
No |
| Uploaded via |
twine/6.2.0 CPython/3.11.3
|
Release files / dash_chartjs-1.3.0-py3-none-any.whl
| Download URL | dash_chartjs-1.3.0-py3-none-any.whl |
|---|---|
| Size | 275.5 kB |
| Tags | Python 3 |
|
SHA-256 checksum How to use checksums |
02c0b12ff26df9e69e6108834dc7d0911be314bfb9d51345b42a15410204c349
|
|
BLAKE2b-256 checksum How to use checksums |
206c7f2b2fb690363268c2d32e8386a38f44666b50eaef4ee1bf40292bde3d2d
|
| Upload date | |
|
Uploaded using Trusted Publishing? What is trusted publishing? |
No |
| Uploaded via |
twine/6.2.0 CPython/3.11.3
|














