A friendly toolkit for quick exploratory data analysis (EDA)

Project description

🌌 DataNova
DataNova — a toolkit for data exploration in Python with a few lines of code!
🚀 Features
- Instant profiling: Summarize your data with
profile(df) - Bar Graph: Shows the top 5 most common values
bar(df, 'Column_Name') - Histogram: Plots the distribution of numerical data
hist(df, 'Column_Name') - Exploratory Data Analysis:
EDA(df) - Simple Linear Regression:
lm(df, x_var, y_var)
what's next?
- Logistic Regression (coming soon!)
🧭 Examples
Examples below use a dataset provided in the package called WINE_DF
from datanova import *
profile( WINE_DF )
- Most of our data is not blank, expect for 'price' (only 5% blank).
| Variable Name | Variable Type | Missing Count | % Blank | Unique Values | Most Frequent Value | Mean | Standard Deviation | Min | 25% | Median | 75% | Max | |
|---|---|---|---|---|---|---|---|---|---|---|---|---|---|
| 0 | country | object | 0 | 0 | 24 | US | |||||||
| 1 | province | object | 0 | 0 | 120 | California | |||||||
| 2 | points | int64 | 0 | 0 | 13 | 90 | 89.55 | 2.32 | 84.0 | 88.0 | 90.0 | 91.0 | 96.0 |
| 3 | price | float64 | 88 | 5 | 110 | 20.0 | 38.71 | 29.39 | 7.0 | 20.0 | 30.0 | 48.0 | 500.0 |
| 4 | variety | object | 0 | 0 | 161 | Pinot Noir |
$$\:$$ $$\:$$
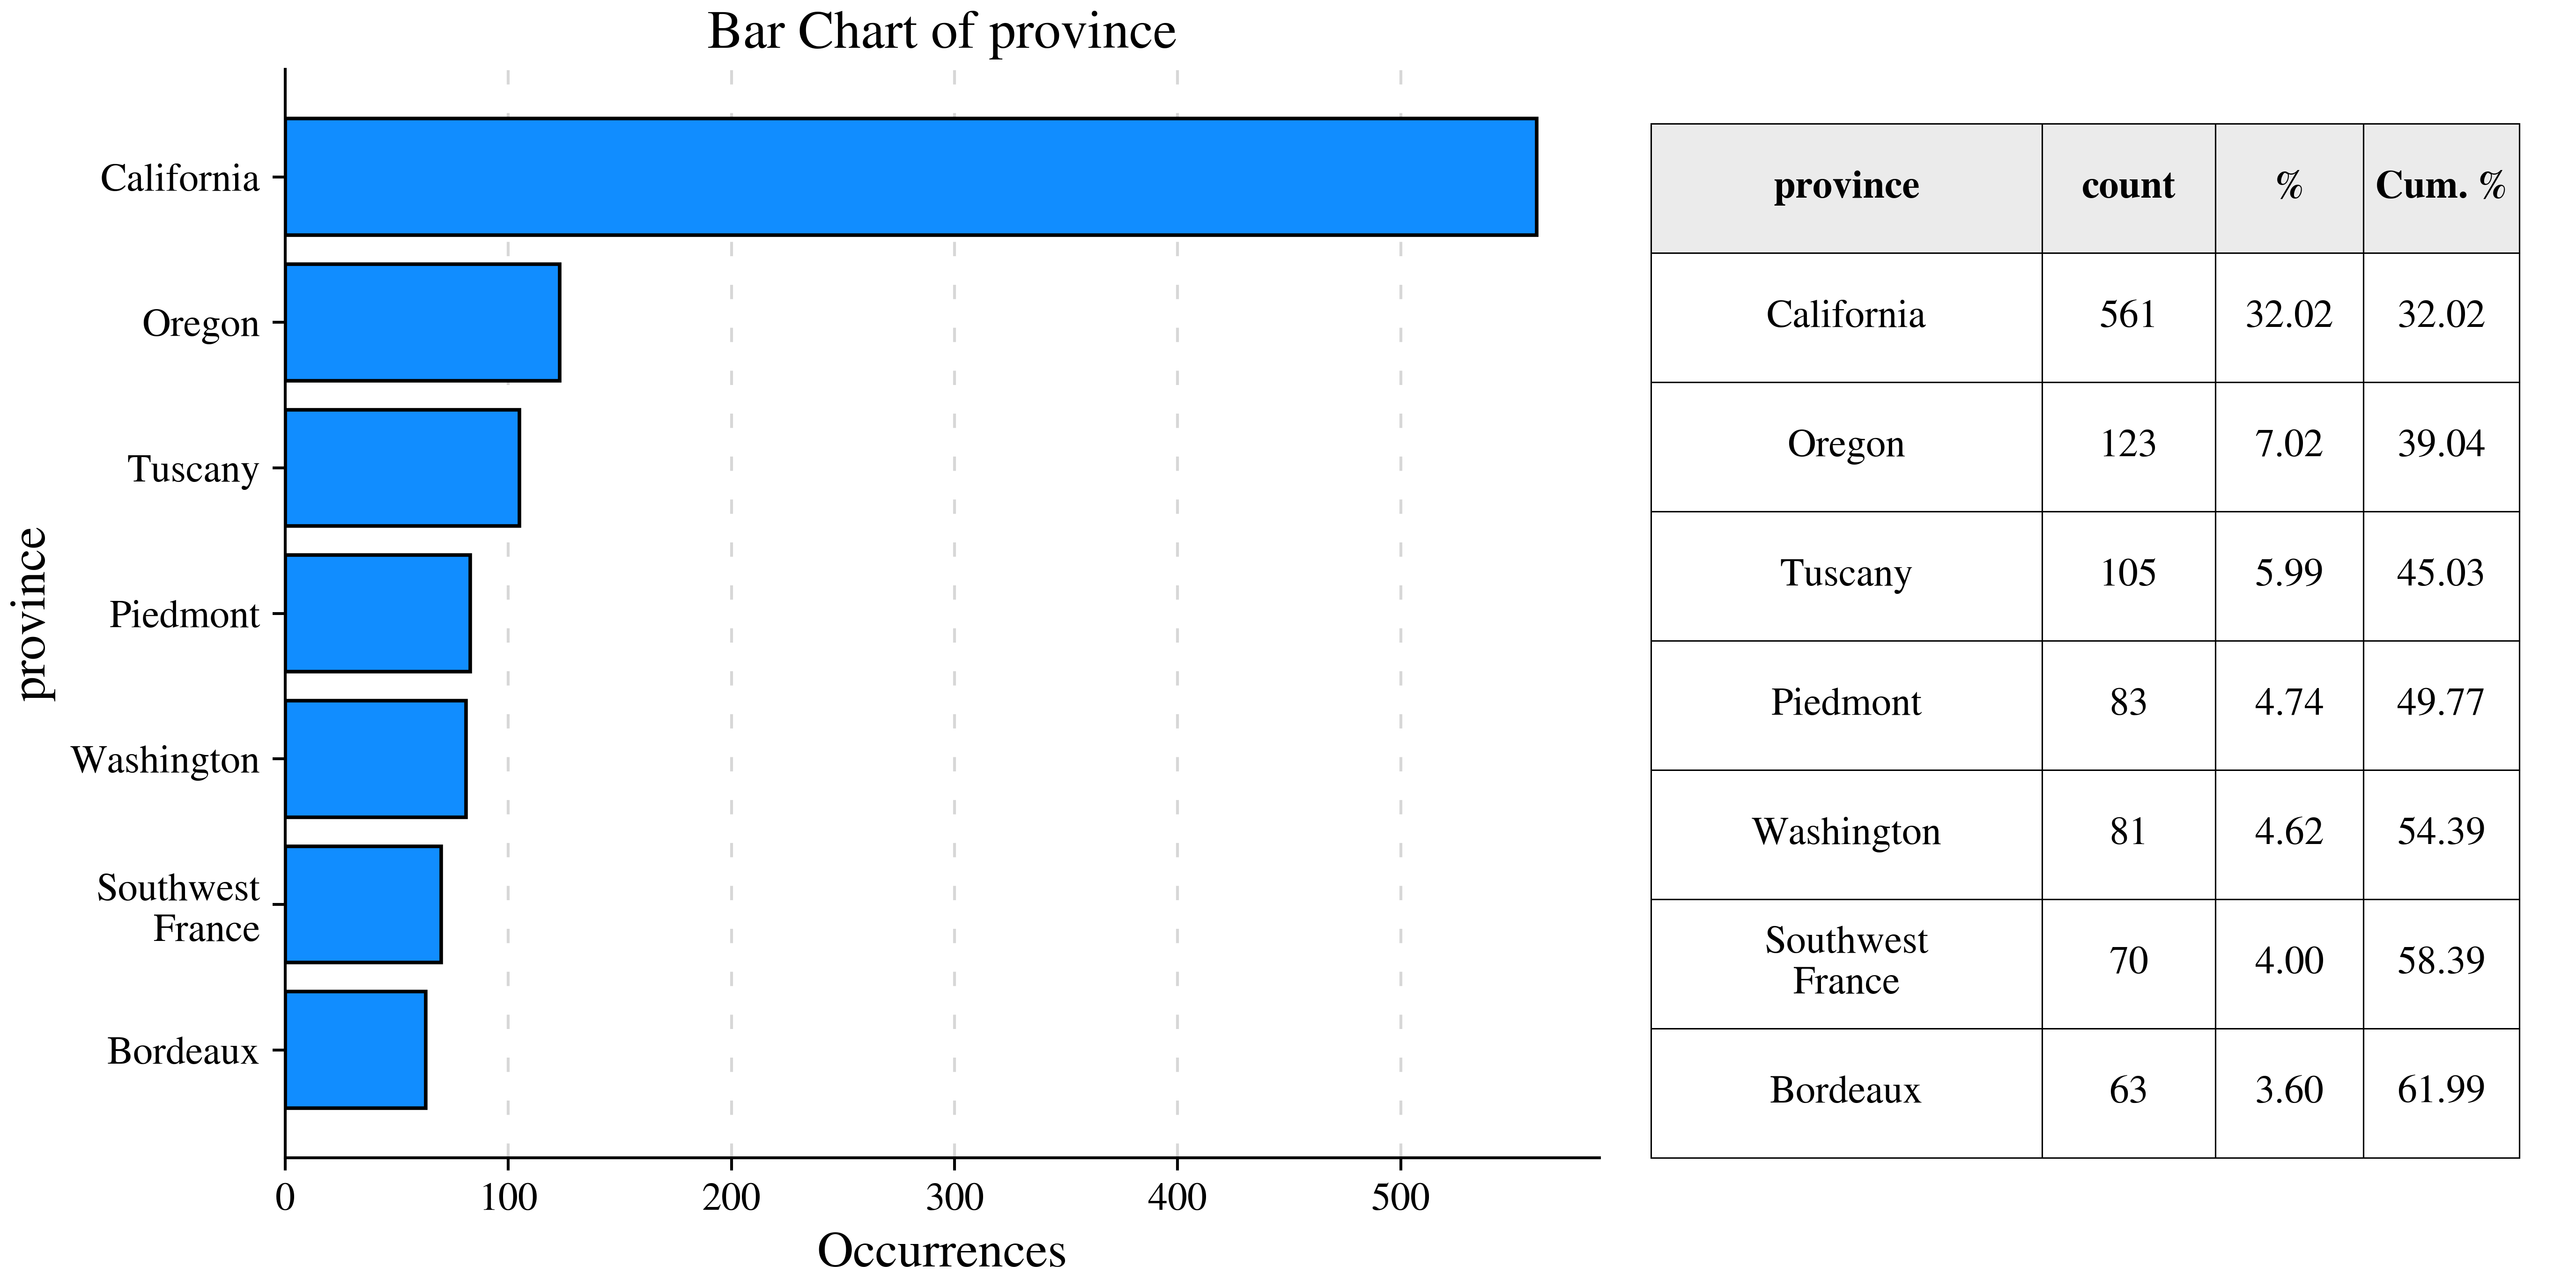
bar( WINE_DF , 'province', top_n=7)
- California accounts for 32% of total wine sales, and the top five regions collectively contribute over half of all sales.
$$\:$$ $$\:$$
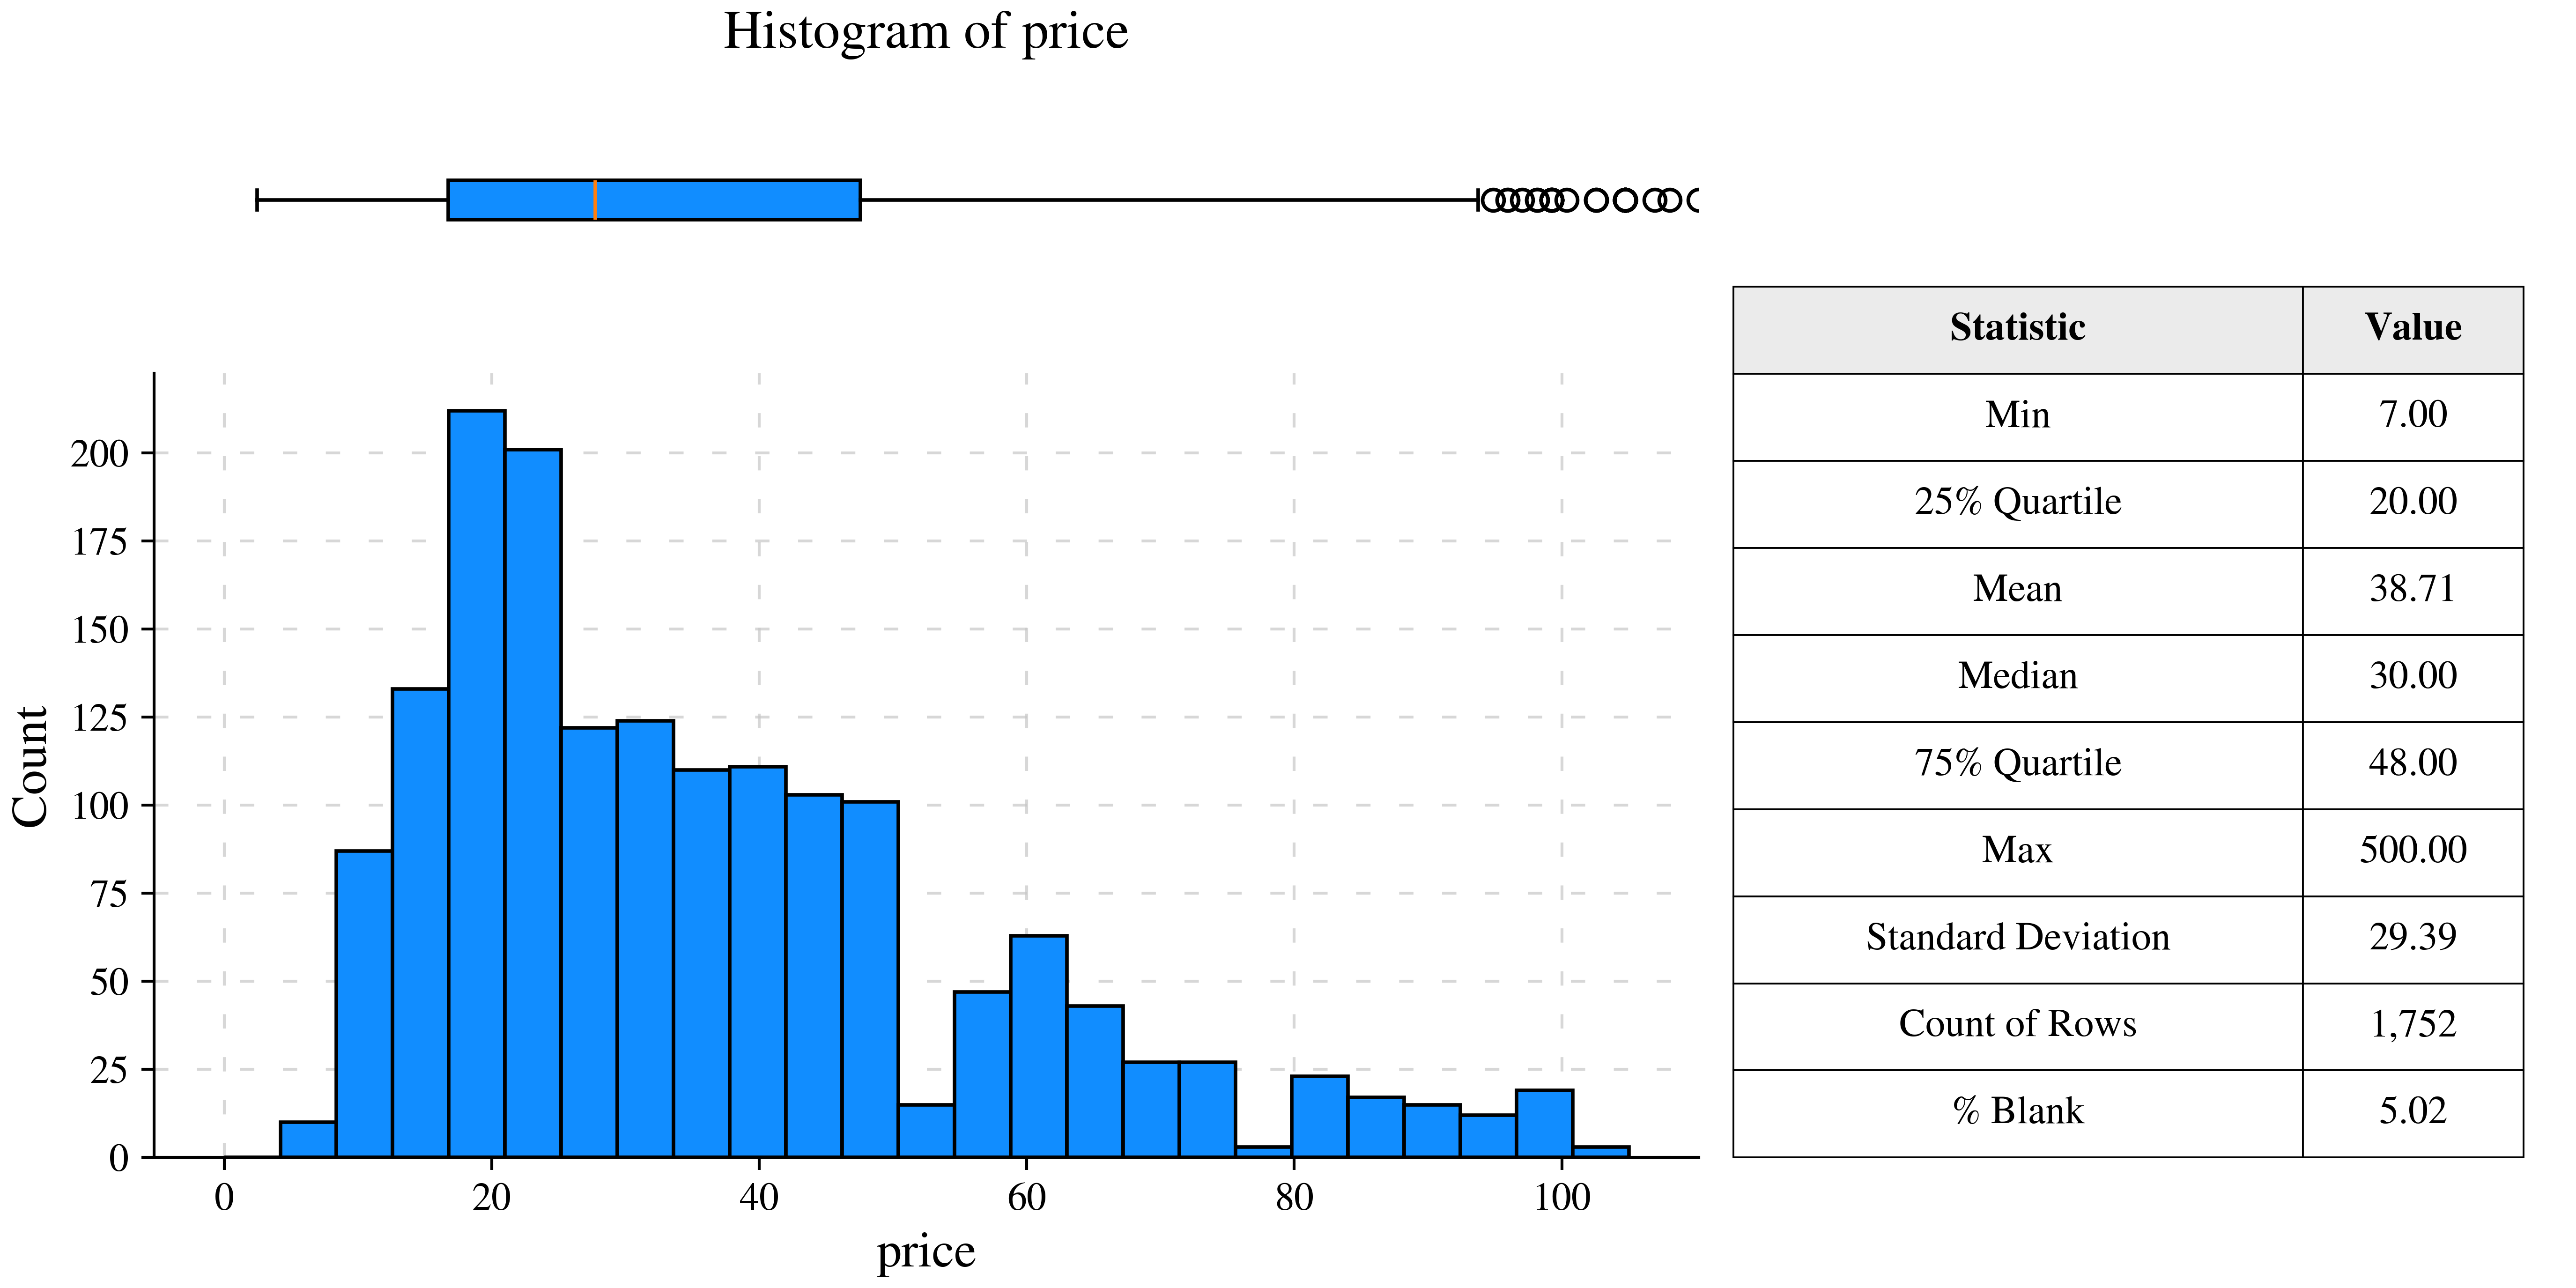
hist( WINE_DF , 'price' , xlim = [0,105], n_bins = 25)
- On average, a bottle of wine costs $38. The price ranges from: $20-$48
$$\:$$ $$\:$$
eda( WINE_DF )
- Creates bar graphs and histograms for all columns in the dataset.
$$\:$$
Regression Modeling
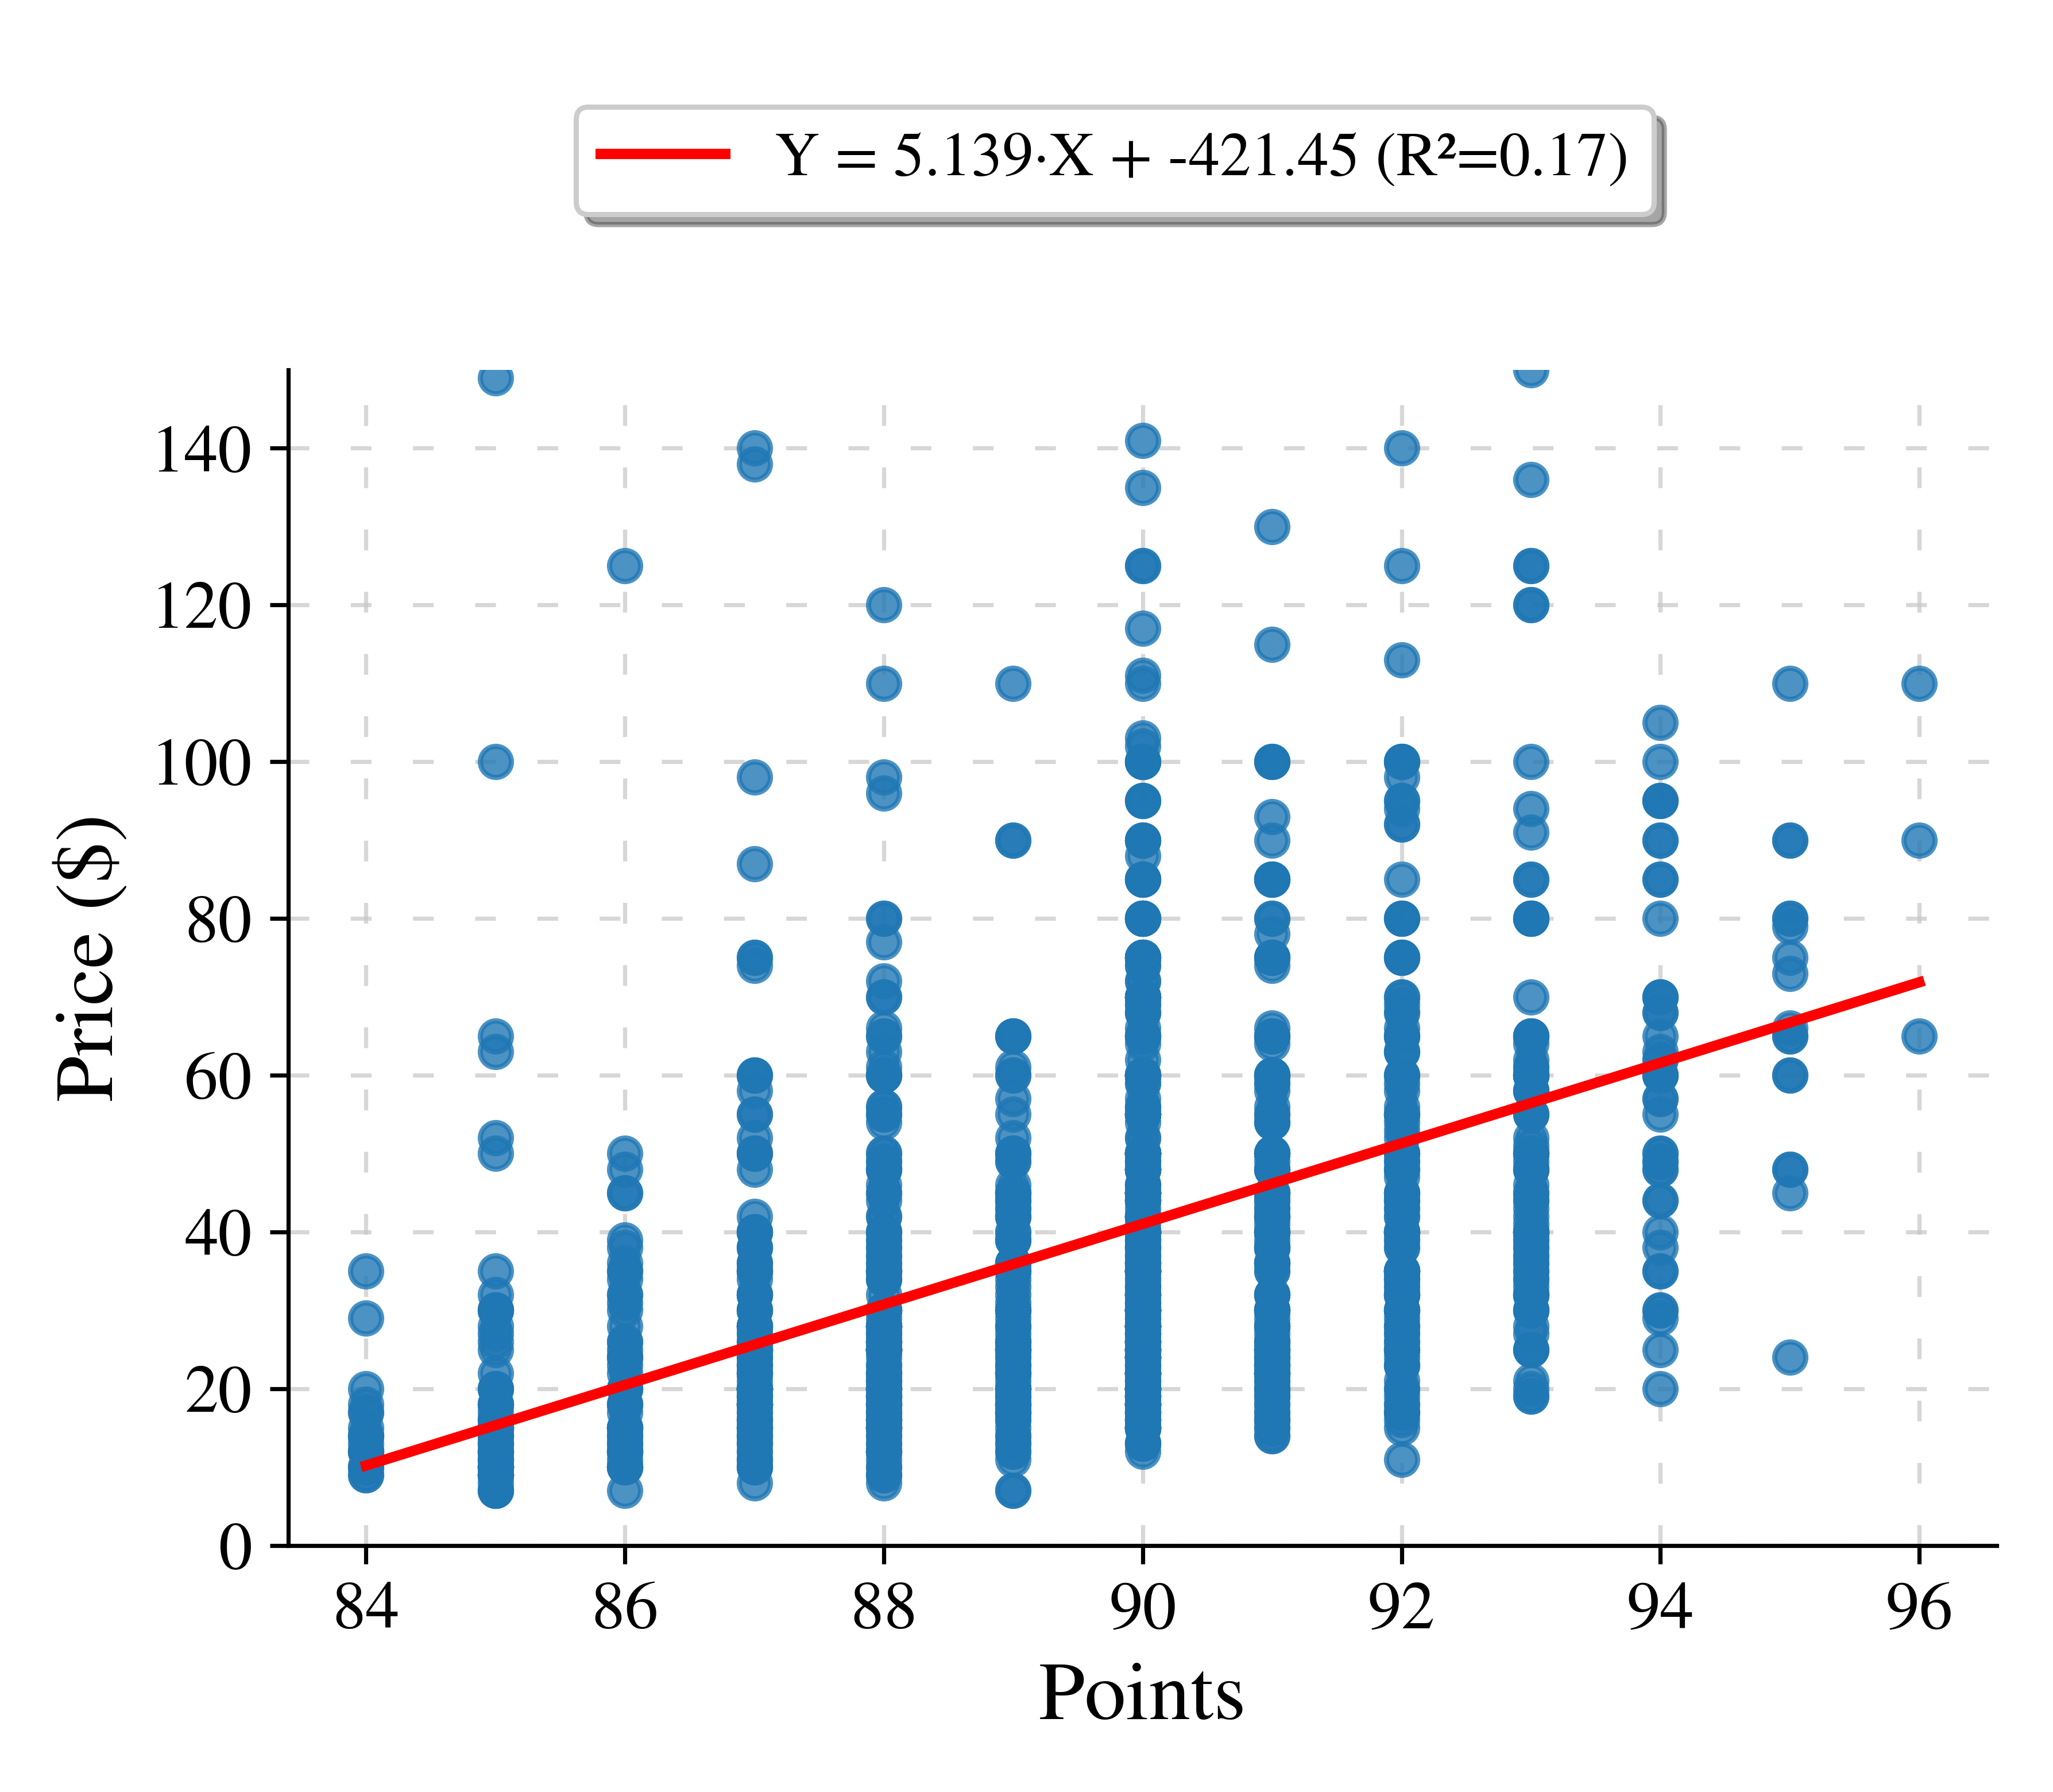
figure, model = lm(WINE_DF, 'points' , 'price' ,  ylimit = [0,150] ,
                   xtitle = 'Points' , ytitle = 'Price ($)' ,
                   show_summary=False , alpha = 0.8 )

display( figure )
- Creates a simple linear regression
- As the quality of wine increases (points), the price also increases.
🛠️ Installation
pip install DataNova
Release history Release notifications | RSS feed

Download files
Download the file for your platform. If you're not sure which to choose, learn more about installing packages.
Source Distribution
datanova-0.1.3.tar.gz
(21.3 kB
view details)
Built Distribution
Filter files by name, interpreter, ABI, and platform.
If you're not sure about the file name format, learn more about wheel file names.
Copy a direct link to the current filters
datanova-0.1.3-py3-none-any.whl
(21.6 kB
view details)
File details
Details for the file datanova-0.1.3.tar.gz.
File metadata
- Download URL: datanova-0.1.3.tar.gz
- Upload date:
- Size: 21.3 kB
- Tags: Source
- Uploaded using Trusted Publishing? No
- Uploaded via: twine/6.2.0 CPython/3.12.0
File hashes
| Algorithm | Hash digest | |
|---|---|---|
| SHA256 |
8ae85b00d227f9e66ea70734fe2bc0eb7dac6b91a452cfa5c097affd0728f7b2
|
|
| MD5 |
eac6c393b236b250286067137dda8629
|
|
| BLAKE2b-256 |
1b291de310bebbc3235aa850e467c75d0275bc36937256b91602481ade949239
|
File details
Details for the file datanova-0.1.3-py3-none-any.whl.
File metadata
- Download URL: datanova-0.1.3-py3-none-any.whl
- Upload date:
- Size: 21.6 kB
- Tags: Python 3
- Uploaded using Trusted Publishing? No
- Uploaded via: twine/6.2.0 CPython/3.12.0
File hashes
| Algorithm | Hash digest | |
|---|---|---|
| SHA256 |
6b86657e9bb62f2e964cd11bfdb0fd26a362daf54ac945c55c715f85acd0b78d
|
|
| MD5 |
cca12b56de24b74fc46bbcbf55a9eb28
|
|
| BLAKE2b-256 |
b9a3744ab199cfa4afcb5194b503ddb9bcc1e94f986fc74a7e30bb42b23b0930
|


