DeGiro Analytics and API tools

Project description
Intro
This is a DeGiro analytics platform. DeGiro is a low-fee Dutch investment broker that, sadly, offers limited account analytics functionality. This project leverages DeGiro's private API and provides some investment performance analytics tools.
Requirments
pandas>=1.4.2
requests>=2.27.1
Installation
pip install degiro_analytics
Docker
If you prefer to run the project in Docker, I made an image available in Docker hub. It contains a Jupyter Notebook with getting-started example.
docker pull degiro-analytics-notebook
docker run -p 8888:8888 degiro-analytics-notebook
Just copy the link with an automatically generated token and plug it to your browser to run Jupyter.
Hint: Make sure you don't have any existing notebooks running on port 8888.
Description
degiro_analytics/DegiroWrapper.py contains API to retrieve current portfolio information and product search. It does not include trading API. There are open-source projects implementing trading API.
degiro_analytics/utils.py contains various methods for portfolio analytics.
Examples.ipynb Refer to this Jupyter Notebook for examples.
Examples
import pandas as pd
from degiro_analytics import DeGiroWrapper
from degiro_analytics.utils import irr, analytics
DGW = DeGiroWrapper(True, True, base_curr='EUR') # you will have to provide your credentials (and possibly multi-factor auth code)
Insights into your portfolio
pf = DGW.get_current_portfolio() # retrieves your current portfolio
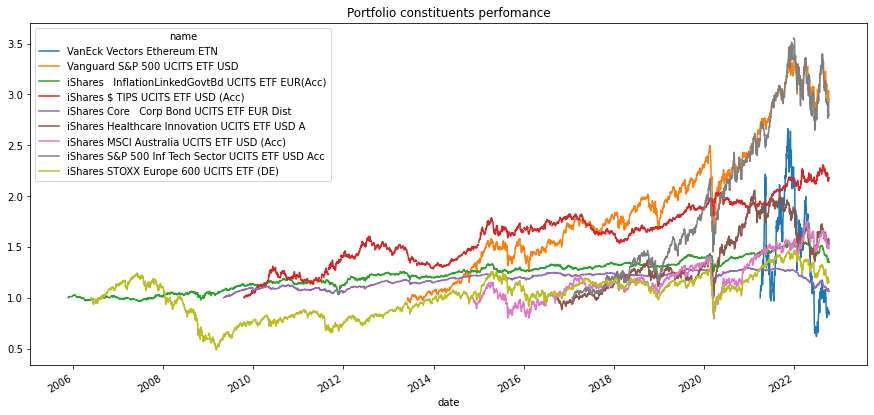
Get price history of your portfolio constituents
P = DGW.get_prices(pf.index)
P = P.pivot(index='date', columns='name', values='price')
P = P.apply(lambda x: x/x.dropna().iloc[0]) # normalize by starting price
P.plot(title='Portfolio constituents perfomance', figsize=(15, 7))
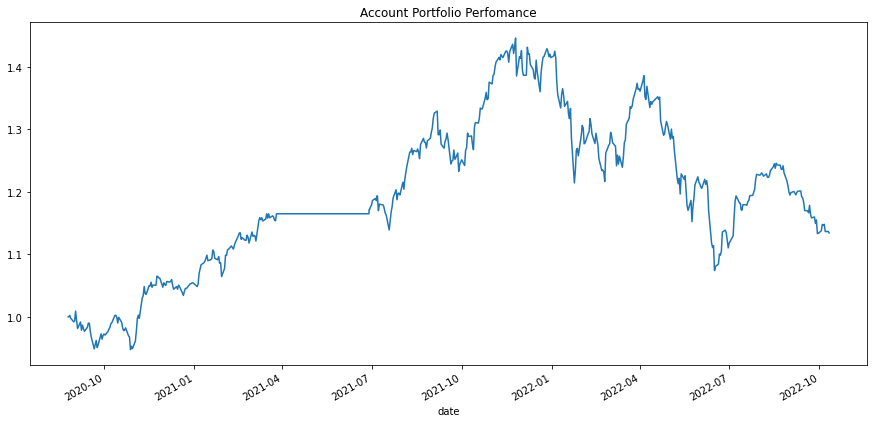
Perfomance of your account
start_date = '01/01/2020' # use any date
T = DGW.get_transactions(start_date) # trasactions history
P = DGW.get_prices(T.productId.unique()) # get price history of all products from T
P = P[P.date>=T.date.min()]
P = pd.pivot_table(P, index='date', columns='productId', values='price', aggfunc='mean') # product per columns
P.fillna(method='ffill', inplace=True)
Q = pd.pivot_table(T, index='date', columns='productId', values='quantity', aggfunc='sum') # number of shares purchased, product per column
Q = Q.reindex(P.index.append(Q.index)).sort_index().fillna(0).cumsum() # portfolio quantities per day
idx = P.index.get_indexer(Q.index, method='nearest')
matched_P = P.iloc[idx].values
The following cell computes portfolio returns as $R_t = \frac{Q_{t-1}'P_t}{Q_{t-1}'P_{t-1}}$.
numerator = Q.shift().multiply(matched_P).sum(axis=1)
denominator = Q.multiply(matched_P).sum(axis=1).shift()
R = numerator/denominator
IDX = R.fillna(1).cumprod() # index (or normalized price) of the portfolio
IDX.plot(title='Account Portfolio Perfomance', figsize=(15, 7))
Some analytics
analytics(IDX)
{'Mean return': 0.00027660251717962994,
 'Std': 0.010483131903391498,
 'Risk Adjusted Return': 0.02638548477007559,
 'Number of drawdowns': 28,
 'Maximum Drawdown': 0.25730401117784857,
 'Max drawdown duration (days)': 320,
 'Mean drawdown duration (days)': 26.035714285714285,
 'T': 570}
Cash Flows analysis and money weighted return (IRR)
cf_df = DGW.get_account_cash_flows('01/01/2000', fees=True, dividends=True)
cf = cf_df.set_index('date').CF
cf.loc[pd.to_datetime(DGW.today, dayfirst=True, utc=True)] = pf.Q.multiply(pf.price_base_curr).sum() # current portfolio value
mwr = irr(cf)
print('Money weighted return is', mwr)
Money weighted return is 0.008600000000000003
Search products
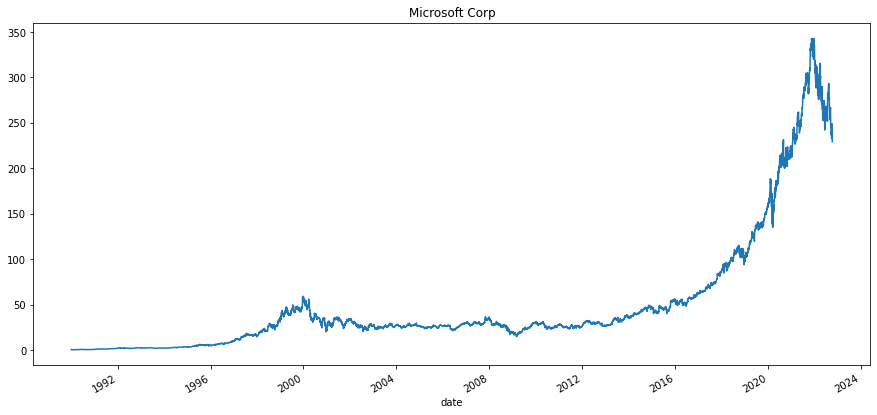
search_text = 'Microsoft'
product = DGW.lookup(search_text, limit=1)[0]
print('The current price of', product.name, 'is', product.closePrice, product.currency)
p = product.get_price_hist(convert=False).set_index('date').price
p.plot(title=product.name, figsize=(15,7))
The current price of Microsoft Corp is 229.25 USD
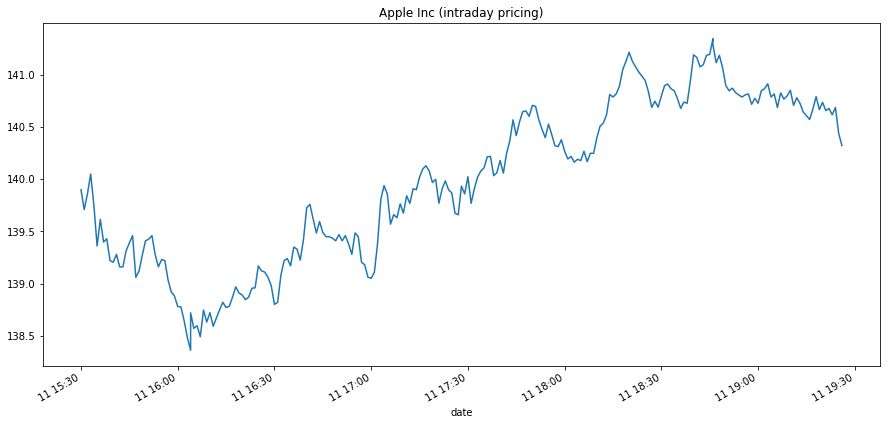
search_text = 'Apple'
product = DGW.lookup(search_text, limit=1)[0]
print('The current price of', product.name, 'is', product.closePrice, product.currency)
p = product.get_price_hist(history='1D', resolution='T1M', convert=False).set_index('date').price
p.plot(title=product.name + ' (intraday pricing)', figsize=(15,7))
The current price of Apple Inc is 140.42 USD
Search and analyze ETFs from core selection
etfs = DGW.search_etfs(only_free=True, limit=200) # returns all ETFs from DeGiro core selection
Loop through the ETFs and analyze the prices
out = []
for etf in etfs:
    p = etf.get_price_hist(resolution='1M')
    a = analytics(p.set_index('date').price)
    a['name'] = etf.name
    out.append(a)
pd.DataFrame(out).sort_values('Risk Adjusted Return')
.dataframe tbody tr th {
    vertical-align: top;
}

.dataframe thead th {
    text-align: right;
}
| Mean return | Std | Risk Adjusted Return | Number of drawdowns | Maximum Drawdown | Max drawdown duration (days) | Mean drawdown duration (days) | T | name | |
|---|---|---|---|---|---|---|---|---|---|
| 185 | -0.003599 | 0.024421 | -0.147393 | 6 | 0.315074 | 1278 | 375.333333 | 80 | Xtrackers USD Corporate Bond UCITS ETF 2D HEUR |
| 100 | -0.001715 | 0.012107 | -0.141665 | 5 | 0.163109 | 852 | 329.000000 | 59 | iShares Core Gl Aggregate Bd UCITS ETF EUR Hgd... |
| 190 | -0.012569 | 0.095570 | -0.131513 | 2 | 0.624981 | 699 | 380.000000 | 27 | The Medical Cannabis and Wellness UCITS ETF Acc |
| 178 | -0.012005 | 0.106949 | -0.112248 | 2 | 0.649046 | 699 | 380.000000 | 27 | Rize Medical Cannabis and Life Sciences UCITS ETF |
| 106 | -0.001573 | 0.015111 | -0.104113 | 4 | 0.207632 | 1064 | 578.250000 | 80 | Vanguard EUR Eurozone Government Bd UCITS ETF EUR |
| ... | ... | ... | ... | ... | ... | ... | ... | ... | ... |
| 72 | 0.015837 | 0.052422 | 0.302098 | 14 | 0.243017 | 396 | 139.357143 | 78 | SPDR MSCI World Technology UCITS ETF |
| 63 | 0.012074 | 0.038280 | 0.315414 | 23 | 0.176644 | 518 | 166.782609 | 149 | Amundi S&P 500 UCITS ETF- EUR (C) |
| 14 | 0.015172 | 0.046238 | 0.328118 | 21 | 0.239507 | 365 | 175.523810 | 142 | iShares NASDAQ 100 UCITS ETF USD (Acc) |
| 172 | 0.023167 | 0.070230 | 0.329876 | 3 | 0.271599 | 365 | 284.333333 | 31 | Lyx Msci Future Etf |
| 149 | 0.025988 | 0.065900 | 0.394360 | 3 | 0.238976 | 365 | 294.333333 | 32 | WisdomTree Battery Solutions UCITS ETF USD Acc |
198 rows × 9 columns


Download files
Download the file for your platform. If you're not sure which to choose, learn more about installing packages.
Source Distribution
Built Distribution
File details
Details for the file degiro_analytics-0.3.2.tar.gz.
File metadata
- Download URL: degiro_analytics-0.3.2.tar.gz
- Upload date:
- Size: 424.5 kB
- Tags: Source
- Uploaded using Trusted Publishing? No
- Uploaded via: python-httpx/0.23.0
File hashes
| Algorithm | Hash digest | |
|---|---|---|
| SHA256 |
2d74dc5c1c0d01962ef8e6ade92b2a88fc025d07075297eb195d7507718a8f06
|
|
| MD5 |
730da0ce18f3c0ab8177b02e56e32e58
|
|
| BLAKE2b-256 |
819857f501f182139e740d1ed9755a073e52421d08fd5d84a9ca8b13df4aec3d
|
File details
Details for the file degiro_analytics-0.3.2-py3-none-any.whl.
File metadata
- Download URL: degiro_analytics-0.3.2-py3-none-any.whl
- Upload date:
- Size: 11.6 kB
- Tags: Python 3
- Uploaded using Trusted Publishing? No
- Uploaded via: python-httpx/0.23.0
File hashes
| Algorithm | Hash digest | |
|---|---|---|
| SHA256 |
862a5b2cc49f2f9d0d409c093e5c92fa69b843f12f2f15a43e8656b93d620e2b
|
|
| MD5 |
a14d7a68d92b0b9b6c67c8a4d3bcc834
|
|
| BLAKE2b-256 |
0576984934c2ad502a4c76a07fce2cda14860d50e3a226c09c5c54f8e28de825
|


