
Xu Jing
Introduction
The motivation of this project is the lack of consensus used by different works and implementations concerning the evaluation metrics of the object detection problem. Although on-line competitions use their own metrics to evaluate the task of object detection, just some of them offer reference code snippets to calculate the accuracy of the detected objects.
Researchers who want to evaluate their work using different datasets than those offered by the competitions, need to implement their own version of the metrics. Sometimes a wrong or different implementation can create different and biased results. Ideally, in order to have trustworthy benchmarking among different approaches, it is necessary to have a flexible implementation that can be used by everyone regardless the dataset used.
This project provides easy-to-use functions implementing the same metrics used by the the most popular competitions of object detection. Our implementation does not require modifications of your detection model to complicated input formats, avoiding conversions to XML or JSON files. We simplified the input data (ground truth bounding boxes and detected bounding boxes) and gathered in a single project the main metrics used by the academia and challenges. Our implementation was carefully compared against the official implementations and our results are exactly the same.
In the topics below you can find an overview of the most popular metrics used in different competitions and works, as well as samples showing how to use our code.
This package support:
PASCAL VOC Challenge metric (P-R Curve, mAP)
COCO Detection Challenge (P-R Curve, AP)
Precision
Recall
F-Score
Confidence Interval and Variance
More detials can find in demo.
Demo
#---------------------test detcivar module-----------------------
from detcivar import DetStatic

precision = [0.1, 0.2, 0.3, 0.4, 0.5]


# test mean
p_mean = DetStatic().mu(precision)
print(p_mean)

real_mean = sum(precision) / len(precision)
print(real_mean)


# test variance

p_var = DetStatic().variance(precision)
print(p_var)

real_var = float((0.1-real_mean)**2 + (0.2-real_mean)**2  + (0.3-real_mean)**2  + (0.4-real_mean)**2  + (0.5-real_mean)**2) / (len(precision)-1)
print(real_var)

# test confidence

ci = DetStatic().detcivar(precision,level=0.95)

import pprint
pprint.pprint(ci)


# real
# N(0,1) 0.025 quntile like equel -1.9599639845400545
import numpy as np
lower = 0.3 - np.sqrt(0.025) / np.sqrt(5) * 1.9599639845400545
upper = 0.3 + np.sqrt(0.025) / np.sqrt(5) * 1.9599639845400545

print(lower)
print(upper)


# test done!!!

# 0.3
# 0.3
# 0.025
# 0.025
# {'CI': [0.16141, 0.43859], 'Var': 0.025}
# 0.16140961756503217
# 0.43859038243496784
#----------------test detmet module-------------------------------

from detmet import *
from utils import *
from BoundingBox import BoundingBox
from BoundingBoxes import BoundingBoxes

import glob
import os

def getBoundingBoxes():
    """
    Read txt files containing bounding boxes (ground truth and detections).
    """
    # allBoundingBoxes = BoundingBoxes()

    # --------------------------Read ground truths-----------------------------
    folderGT = './groundtruths'

    files = os.listdir(folderGT)
    # files = glob.glob("./groundtruths/*.txt")
    files.sort()

    # Class representing bounding boxes (ground truths and detections)
    allBoundingBoxes = BoundingBoxes()
    # Read GT detections from txt file
    # Each line of the files in the groundtruths folder represents a ground truth bounding box
    # (bounding boxes that a detector should detect)

    # Each value of each line is  "class_id, x, y, width, height" respectively
    # Class_id represents the class of the bounding box
    # x, y represents the most top-left coordinates of the bounding box
    # x2, y2 represents the most bottom-right coordinates of the bounding box

    for f in files:   # file in GT-folder
        nameOfImage = f.replace(".txt", "")
        fh1 = open(os.path.join(folderGT,f), "r")
        for line in fh1:
            line = line.replace("\n", "")
            if line.replace(' ', '') == '':
                continue
            splitLine = line.split(" ")  # space to sep line

            idClass = splitLine[0]  # class
            x = float(splitLine[1])  # GT no confidnce
            y = float(splitLine[2])
            w = float(splitLine[3])
            h = float(splitLine[4])

            bb = BoundingBox(
                nameOfImage,
                idClass,
                x,
                y,
                w,
                h,
                CoordinatesType.Absolute, None,
                BBType.GroundTruth,
                format=BBFormat.XYWH)
            allBoundingBoxes.addBoundingBox(bb)
        fh1.close()

    # ----------------------------Read detections------------------------------
    folderDet = './detections'
    files = os.listdir(folderDet)
    # files = glob.glob("./detections/*.txt")
    files.sort()
    # Read detections from txt file
    # Each line of the files in the detections folder represents a detected bounding box.

    # Each value of each line is  "class_id, confidence, x, y, width, height" respectively
    # Class_id represents the class of the detected bounding box
    # Confidence represents confidence (from 0 to 1) that this detection belongs to the class_id.
    # x, y represents the most top-left coordinates of the bounding box
    # x2, y2 represents the most bottom-right coordinates of the bounding box

    for f in files:
        # nameOfImage = f.replace("_det.txt","")
        nameOfImage = f.replace(".txt", "")
        # Read detections from txt file
        fh1 = open(os.path.join(folderDet,f), "r")
        for line in fh1:
            line = line.replace("\n", "")
            if line.replace(' ', '') == '':
                continue
            splitLine = line.split(" ")
            idClass = splitLine[0]  # class
            confidence = float(splitLine[1])  # confidence predict detect
            x = float(splitLine[2])
            y = float(splitLine[3])
            w = float(splitLine[4])
            h = float(splitLine[5])
            bb = BoundingBox(
                nameOfImage,
                idClass,
                x,
                y,
                w,
                h,
                CoordinatesType.Absolute, None,
                BBType.Detected,  # GT or predict
                confidence,
                format=BBFormat.XYWH)
            allBoundingBoxes.addBoundingBox(bb)
        fh1.close()
    return allBoundingBoxes


def createImages(dictGroundTruth, dictDetected):
    """
    Create representative images with bounding boxes.
    """
    import numpy as np
    import cv2
    # Define image size
    width = 200
    height = 200
    # Loop through the dictionary with ground truth detections
    for key in dictGroundTruth:
        image = np.zeros((height, width, 3), np.uint8)
        gt_boundingboxes = dictGroundTruth[key]
        image = gt_boundingboxes.drawAllBoundingBoxes(image)
        detection_boundingboxes = dictDetected[key]
        image = detection_boundingboxes.drawAllBoundingBoxes(image)
        # Show detection and its GT
        cv2.imshow(key, image)
        cv2.waitKey()


# Read txt files containing bounding boxes (ground truth and detections)
boundingboxes = getBoundingBoxes()
# Uncomment the line below to generate images based on the bounding boxes
# createImages(dictGroundTruth, dictDetected)
# Create an evaluator object in order to obtain the metrics
evaluator = DetMetric()


##############################################################
# VOC PASCAL Metrics
##############################################################
# Plot Precision x Recall curve
evaluator.PlotPRCurve(
    boundingboxes,  # Object containing all bounding boxes (ground truths and detections)
    IOUThreshold=0.3,  # IOU threshold
    # MethodAveragePrecision.COCOInterpolation: COCO AP, MethodAveragePrecision.ElevenInterpolationElevenPointInterpolation: VOC2008,
    # MethodAveragePrecision.EveryPointInterpolation: VOC2010
    method=MethodAveragePrecision.COCOInterpolation,
    showAP=True,  # Show Average Precision in the title of the plot
    savePath="P-R-Curve-VOC.png",
    showInterpolatedPrecision=False)  # Plot the interpolated precision curve


# Get metrics with PASCAL VOC metrics
metricsPerClass,metricsAll = evaluator.GetDetMetrics(
    boundingboxes,  # Object containing all bounding boxes (ground truths and detections)
    IOUThreshold=0.3,  # IOU threshold
    beta = 1,  # F1-score
    method=MethodAveragePrecision.ElevenPointInterpolation)

print("Average precision values per class:\n")
# Loop through classes to obtain their metrics

s = ('%20s' + '%14s' * 6) % ('Class','P', 'R', 'F-Score',  'total TP', 'total FP','VOC AP@.5')
print(s)
for mc in metricsPerClass:
    # Get metric values per each class
    c = mc['class']
    precision = mc['precision']
    recall = mc['recall']
    f_score = mc['f_score']
    average_precision = mc['AP']
    tp = mc['total TP']
    fp = mc['total FP']

    metric_c = ('%20s' + '%14s' * 6) % (c, round(precision[-1],3), round(recall[-1],3), round(f_score,3),  tp, fp, round(average_precision,3))

    # Print AP per class
    print(metric_c)

all_precision = round(metricsAll["all_precision"],3)
all_recall = round(metricsAll["all_recall"],3)
all_f_score = round(metricsAll["all_f_score"],3)
all_ap = round(metricsAll["total_map"],3)

metric_all = ('%20s' + '%14s' * 6) % ("all", all_precision, all_recall, all_f_score,  "\\", "\\", "mAP@50:{}".format(all_ap))

# Print voc mAP for all class
print(metric_all)

#########################################################################
# COCO Metrics
# Precision, Recall, F-Score are same to VOC, so we only compute COCO AP
#########################################################################
# Plot Precision x Recall curve
evaluator.PlotPRCurve(
    boundingboxes,  # Object containing all bounding boxes (ground truths and detections)
    IOUThreshold=0.5,  # IOU threshold
    # MethodAveragePrecision.COCOInterpolation: COCO AP, MethodAveragePrecision.COCOInterpolationElevenPointInterpolation: VOC2008,
    # MethodAveragePrecision.EveryPointInterpolation: VOC2010
    method=MethodAveragePrecision.ElevenPointInterpolation, # we do not compute the COCO AP for every class, so we use VOC AP replace,in P-R Curve!
    showAP=True,  # Show Average Precision in the title of the plot
    savePath="P-R-Curv-COCO.png",
    showInterpolatedPrecision=False)  # Plot the interpolated precision curve


# Get metrics with COCO metrics

coco_ap_dict = {}
for viou in np.linspace(0.5, 0.95, num=10):

    metricsPerClass, metricsAll = evaluator.GetDetMetrics(
        boundingboxes,      # Object containing all bounding boxes (ground truths and detections)
        IOUThreshold=viou,  # IOU threshold
        beta = 1,           # F1-score
        method=MethodAveragePrecision.COCOInterpolation)

    ap_iou = metricsAll["total_map"]

    coco_ap_dict[str(viou)] = ap_iou
    print(" Average Precision  (AP)  AP@{}: {}".format(int(viou*100), round(ap_iou,3)))


COCO_AP = np.mean(np.array(list(coco_ap_dict.values())))
print(" Average Precision  (AP)  AP@50:95: {}".format(COCO_AP))
Supports
Tested on Python 3.x
pip install detmetric
Download: https://github.com/DataXujing/detmetric
Documentation: https://github.com/DataXujing/detmetric
TODO
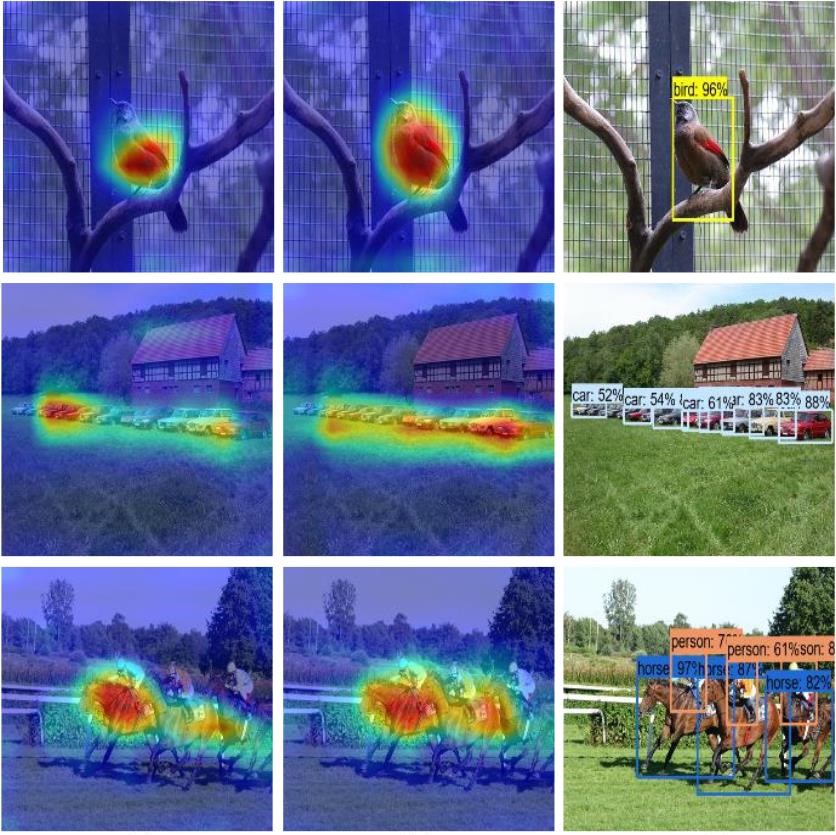
Heatmap of object detectiom. like
Reference
Thanks to the open source community, we refer to many open source projects for the implementation of part of our code !
1 maintainer

Release files for detmetric 0.2.0
For a detailed explanation of source distributions (sdists) and built distributions (wheels), please see the package formats documentation.
Source distribution (sdist)
| File | Size | Uploaded | |
|---|---|---|---|
| detmetric-0.2.0.tar.gz | 346.5 kB | Details |
Release files / detmetric-0.2.0.tar.gz
| Download URL | detmetric-0.2.0.tar.gz |
|---|---|
| Size | 346.5 kB |
| Tags | Source |
|
SHA-256 checksum How to use checksums |
c16b0847b1c5db4a51ebe7904a9c609b8ecd7ff6ec67c92cc8890905feab5da3
|
|
BLAKE2b-256 checksum How to use checksums |
d77571ab99c3187f2aeff817ef9bc8ee2232178f6fbced1fe98ac8b6aed7e855
|
| Upload date | |
|
Uploaded using Trusted Publishing? What is trusted publishing? |
No |
| Uploaded via |
Python-urllib/3.6
|














