
Introduction
The debugtools module offers some easy to use debugging utilities to assist Django development. It features:
A template tag to print context.
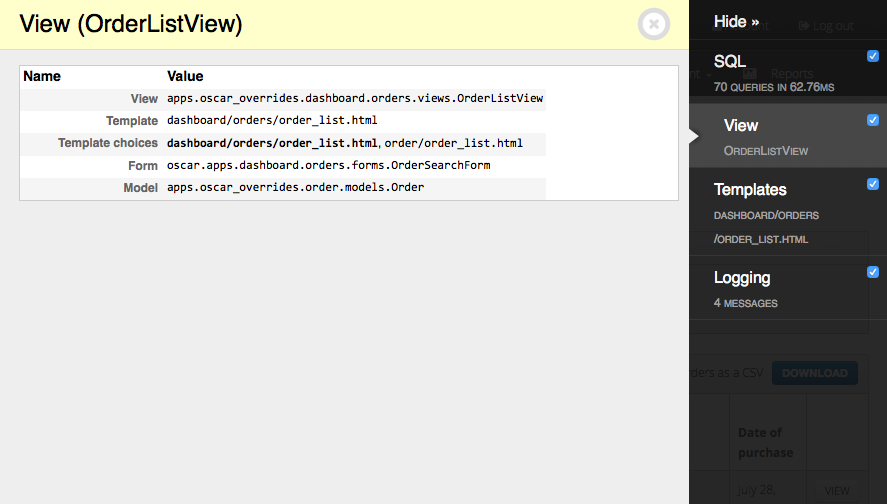
A XViewMiddleware variation to see which view and template was used to render a page.
A panel for django-debug-toolbar to show which view and template was used to render a page.
A jQuery debug() function.
Installation
First install the module, preferably in a virtual environment. It can be installed from PyPI:
pip install django-debugtools
Or the current folder can be installed:
pip install .
Configuration
Add the module to the installed apps:
INSTALLED_APPS += (
    'debugtools',
)
As of Django 1.9, either use {% load debugtools_tags %} or add the following to the settings:
TEMPLATES = [
    {
        'BACKEND': 'django.template.backends.django.DjangoTemplates',
        'DIRS': [],
        'APP_DIRS': True,
        'OPTIONS': {
            'context_processors': [
                'django.template.context_processors.debug',
                'django.template.context_processors.request',
                # ...
            ],
           'builtins': [                                     # Add this section
                "debugtools.templatetags.debugtools_tags",   # Add this line
            ],
        },
    },
]
Or, when you use a local.py settings file:
TEMPLATES[0]['OPTIONS']['builtins'] += [
    "debugtools.templatetags.debugtools_tags",  # enables {% print %}
]
Features
Print Template Tag
In Django templates, the following code can be used:
{% print variable1 variable2 %}
This will print out the specific variables, in case of {% print original %}:

When no variables are given (e.g. {% print %}), all context variables are displayed:
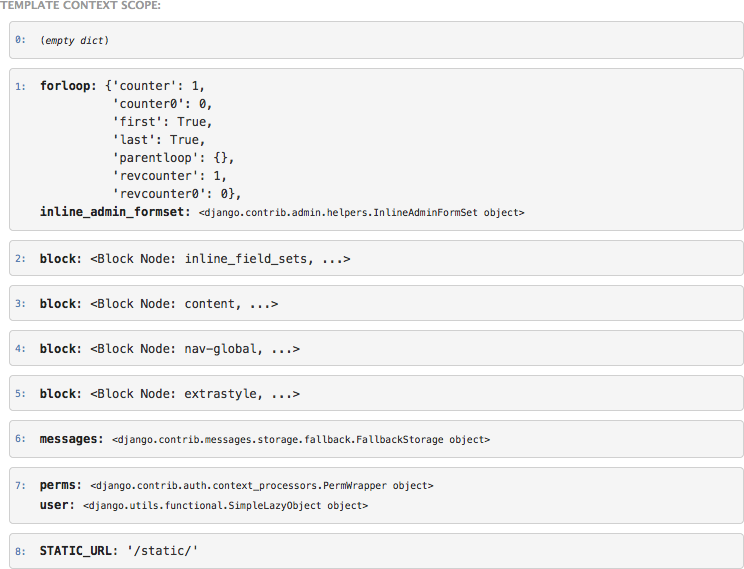
The template context variables are printed in a customized pprint.pformat format, for easy reading. Note no {% load %} tag is needed; the {% print %} function is added to the template builtins for debugging convenience.
Print Queries template tag
For convenience, there is also a {% print_queries %} tag, based on http://djangosnippets.org/snippets/93/
For more sophisticated debugging, you may want to use the django-debug-toolbar for this job.
Debug Toolbar Panel
Add the following settings to your django-debug-toolbar configuration:
DEBUG_TOOLBAR_PANELS = (
    'debug_toolbar.panels.versions.VersionsPanel',
    'debug_toolbar.panels.timer.TimerPanel',
    'debug_toolbar.panels.settings.SettingsPanel',
    'debug_toolbar.panels.headers.HeadersPanel',
    'debug_toolbar.panels.request.RequestPanel',
    'debug_toolbar.panels.sql.SQLPanel',
    'debug_toolbar.panels.staticfiles.StaticFilesPanel',
    'debugtools.panels.ViewPanel',    # Add this one
    'debug_toolbar.panels.templates.TemplatesPanel',
    'debug_toolbar.panels.cache.CachePanel',
    'debug_toolbar.panels.signals.SignalsPanel',
    'debug_toolbar.panels.logging.LoggingPanel',
    'debug_toolbar.panels.redirects.RedirectsPanel',
)
jQuery debug print
Add the following to the page:
<script type="text/javascript" src="{{ STATIC_URL }}debugtools/jquery.debug.js"></script>
Now you can print the jQuery selector context to the console:
$("#foo").children('li').debug().addClass('bar');
This will print the matched <li> elements in the console, among with the current jQuery selector. Optionally, a prefix can be included in the debug() call:
$("#foo").debug("at baz: ").addClass('bar');
X-View Middleware
As alternative to the django-debug-toolbar panel, you can also add the XViewMiddleware. Add the following setting:
INTERNAL_IPS = (
    '127.0.0.1',
)

MIDDLEWARE_CLASSES += (
    'debugtools.middleware.XViewMiddleware',
)
All requests from the internal IP, or made by the admin user will have a X-View header and X-View-Template header. In the Firebug console, or Chrome web inspector, you can see which view and template handled the current request:

The alternative templates are also displayed, in case the view allows the template to be overwritten with a different name.
Print tag examples
For example, when using the following code:
{% print original %}

{% print inline_admin_formset %}

{% for inline_admin_form in inline_admin_formset %}
    {% print inline_admin_form %}
    {% print inline_admin_form.form.name %}
{% endfor %}
It prints the context values, which helps to learn a lot about the template context:
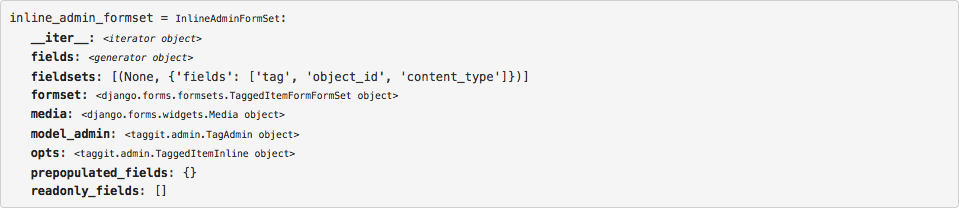
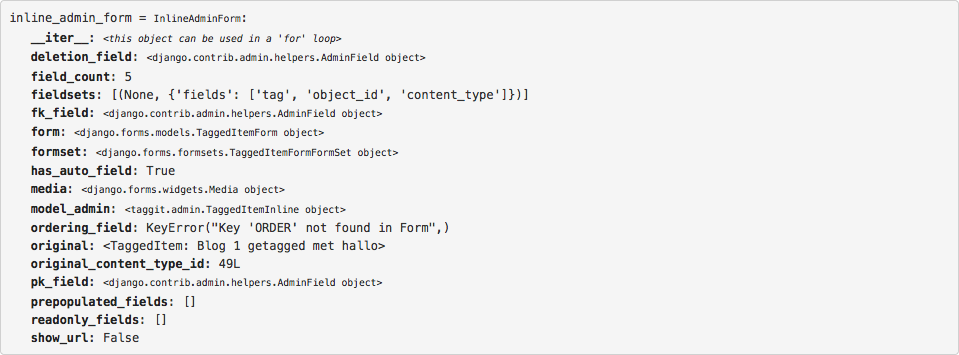
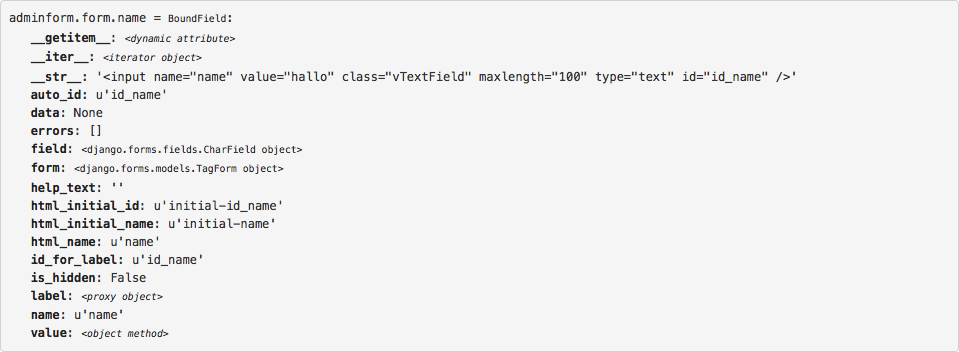
This makes it much easier to understand what the code provides to templates.
1 maintainer

Metadata
1 maintainer
Release files for django-debugtools 1.7.3
For a detailed explanation of source distributions (sdists) and built distributions (wheels), please see the package formats documentation.
Source distribution (sdist)
| File | Size | Uploaded | Provenance | |
|---|---|---|---|---|
| django-debugtools-1.7.3.tar.gz | 20.8 kB | Without provenance | Details |
Built distribution (wheel)
| File | Interpreter | ABI | Platform | Reset |
|---|---|---|---|---|
| django_debugtools-1.7.3-py2.py3-none-any.whl | Python 3, Python 2 | none | any | Details |
Total release size: 41.2 kB
Release files / django-debugtools-1.7.3.tar.gz
| Download URL | django-debugtools-1.7.3.tar.gz |
|---|---|
| Size | 20.8 kB |
| Tags | Source |
|
SHA-256 checksum How to use checksums |
162727452c7644d7dedde4f14851c7018b921154cee00fc5417492acf499d4d9
|
|
BLAKE2b-256 checksum How to use checksums |
045b1772187db7fa48cd60753cfb80d75edac3d034ae567061d579303c906d49
|
| Upload date | |
|
Uploaded using Trusted Publishing? What is trusted publishing? |
No |
Release files / django_debugtools-1.7.3-py2.py3-none-any.whl
| Download URL | django_debugtools-1.7.3-py2.py3-none-any.whl |
|---|---|
| Size | 20.5 kB |
| Tags | Python 2 Python 3 |
|
SHA-256 checksum How to use checksums |
3980b444368643144bdd22dda8970c65a07f4b8cf802aba8ba05a436579500cd
|
|
BLAKE2b-256 checksum How to use checksums |
92624e4b449df4c87383b56f496c5db72643861c42d76edf95e8efcf2630ae5e
|
| Upload date | |
|
Uploaded using Trusted Publishing? What is trusted publishing? |
No |
Security for django-debugtools 1.7.3
Provenance
Provenance describes where a file came from. On PyPI, provenance is shared via attestations, which provide a verifiable record of the build or publishing details. View details, limitations and caveats.
No provenance found
None of the files in this release were uploaded with provenance metadata.
A note on package security
PyPI is a repository for distributing packages, not a service for auditing them. While third-party security researchers and our staff do their best to detect and remove malicious packages, PyPI cannot guarantee the quality, security or suitability of any given package.














