Utility for running workflows leveraging delta live tables from interactive notebooks

Project description

DLT with Debug
Running DLT workflows from interactive notebooks.
About The Project
Delta Live Tables (DLTs) are a great way to design data pipelines with only focusing on the core business logic. It makes the life of data engineers easy but while the development workflows are streamlined in DLT, when it comes to debugging and seeing how the data looks after each transformation step in a typical DLT pipeline it becomes very painful and cumbersome as we dont have the DLT package available in our interactive environment.
Enter dlt-with-debug a lightweight decorator utility which allows developers to do interactive pipeline development by having a unified source code for both DLT run and Non-DLT interactive notebook run.
Built With
- Python's builtins
Installation
pip install in your Databricks Notebook
PyPI
%pip install dlt-with-debug
Prerequisites
Usage
- In our notebooks containing DLT Jobs the imports changes slightly as below
from dlt_with_debug import dltwithdebug, pipeline_id, showoutput

if pipeline_id:
  import dlt
else:
  from dlt_with_debug import dlt
Note:
- Use the
dlt.create_table()API instead ofdlt.table()asdlt.table()sometimes gets mixed withspark.table()in the global namespace.- Always pass the
globals()namespace todltwithdebugdecorator like this@dltwithdebug(globals())
Sample DLT with debug DLT pipeline example
Code:
Cmd 1
%pip install -e git+https://github.com/souvik-databricks/dlt-with-debug.git#"egg=dlt_with_debug"
Cmd 2
from pyspark.sql.functions import *
from pyspark.sql.types import *

# We are importing
# dltwithdebug as that's the entry point to interactive DLT workflows
# pipeline_id to ensure we import the dlt package based on environment
# showoutput is a helper function for seeing the output result along with expectation metrics if any is specified
from dlt_with_debug import dltwithdebug, pipeline_id, showoutput

if pipeline_id:
  import dlt
else:
  from dlt_with_debug import dlt
Cmd 3
json_path = "/databricks-datasets/wikipedia-datasets/data-001/clickstream/raw-uncompressed-json/2015_2_clickstream.json"
Cmd 4
# Notice we are using dlt.create_table instead of dlt.table

@dlt.create_table(
  comment="The raw wikipedia click stream dataset, ingested from /databricks-datasets.",
  table_properties={
    "quality": "bronze"
  }
)
@dltwithdebug(globals())
def clickstream_raw():
  return (
    spark.read.option("inferSchema", "true").json(json_path)
  )
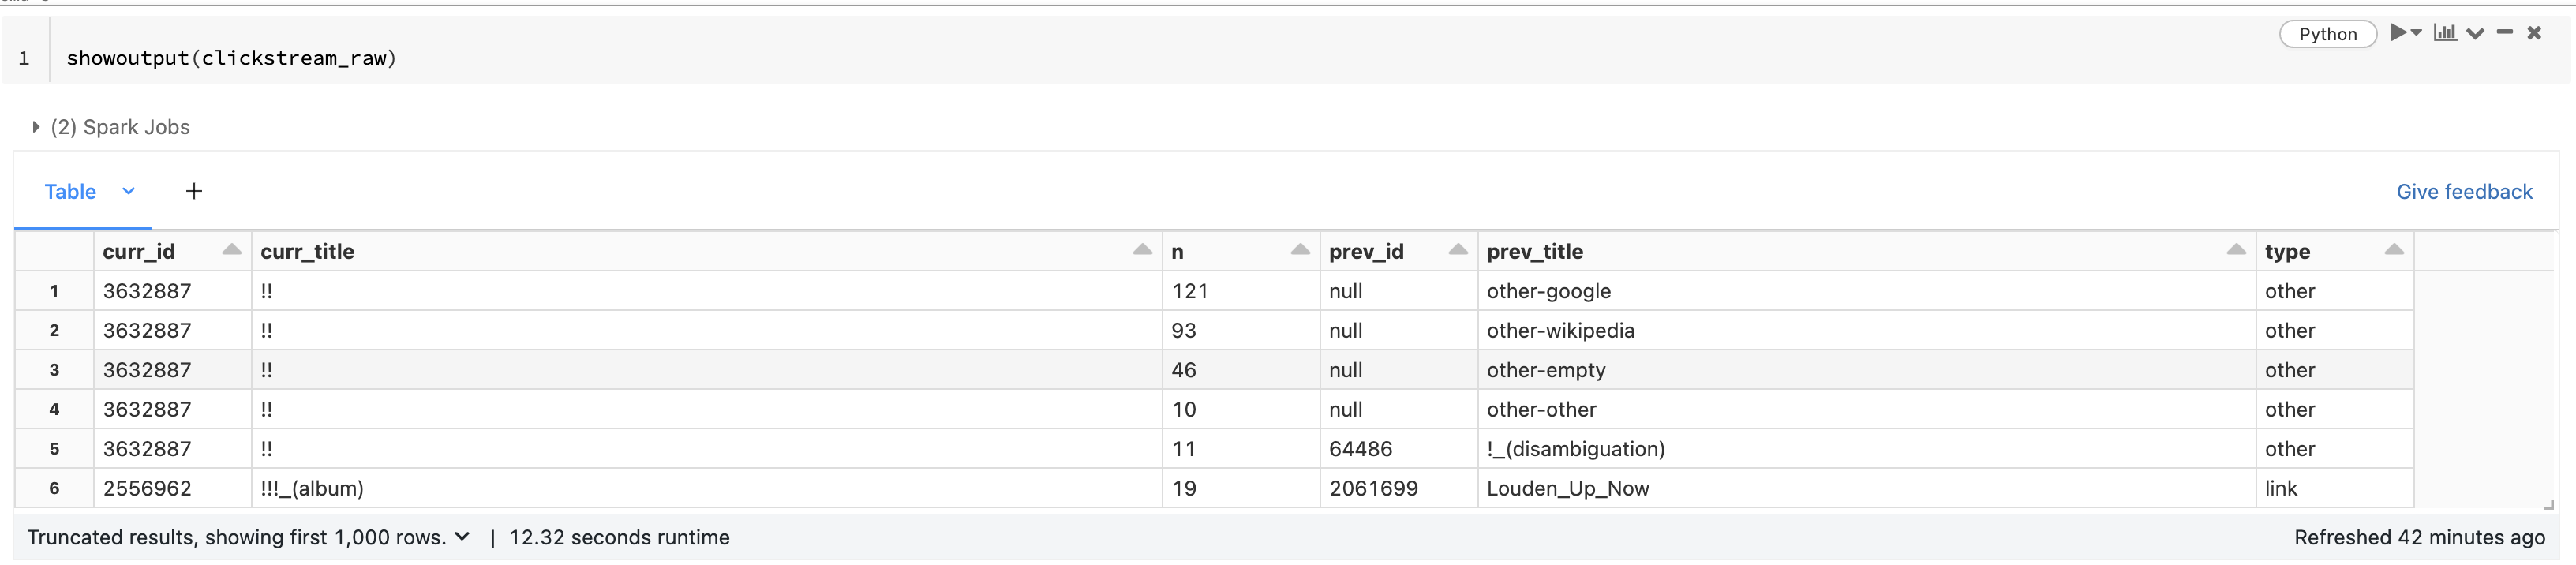
Cmd 5
# for displaying the result of the transformation
# use showoutput(func_name)
# for example here we are using showoutput(clickstream_raw)
showoutput(clickstream_raw)
Cmd 6
@dlt.create_table(
  comment="Wikipedia clickstream dataset with cleaned-up datatypes / column names and quality expectations.",
  table_properties={
    "quality": "silver"
  }
)
@dlt.expect("valid_current_page", "current_page_id IS NOT NULL AND current_page_title IS NOT NULL")
@dlt.expect_or_fail("valid_count", "click_count > 0")
@dlt.expect_all({'valid_prev_page_id': "previous_page_id IS NOT NULL"})
@dltwithdebug(globals())
def clickstream_clean():
  return (
    dlt.read("clickstream_raw")
      .withColumn("current_page_id", expr("CAST(curr_id AS INT)"))
      .withColumn("click_count", expr("CAST(n AS INT)"))
      .withColumn("previous_page_id", expr("CAST(prev_id AS INT)"))
      .withColumnRenamed("curr_title", "current_page_title")
      .withColumnRenamed("prev_title", "previous_page_title")
      .select("current_page_id", "current_page_title", "click_count", "previous_page_id", "previous_page_title")
  )
Cmd 7
showoutput(clickstream_clean)
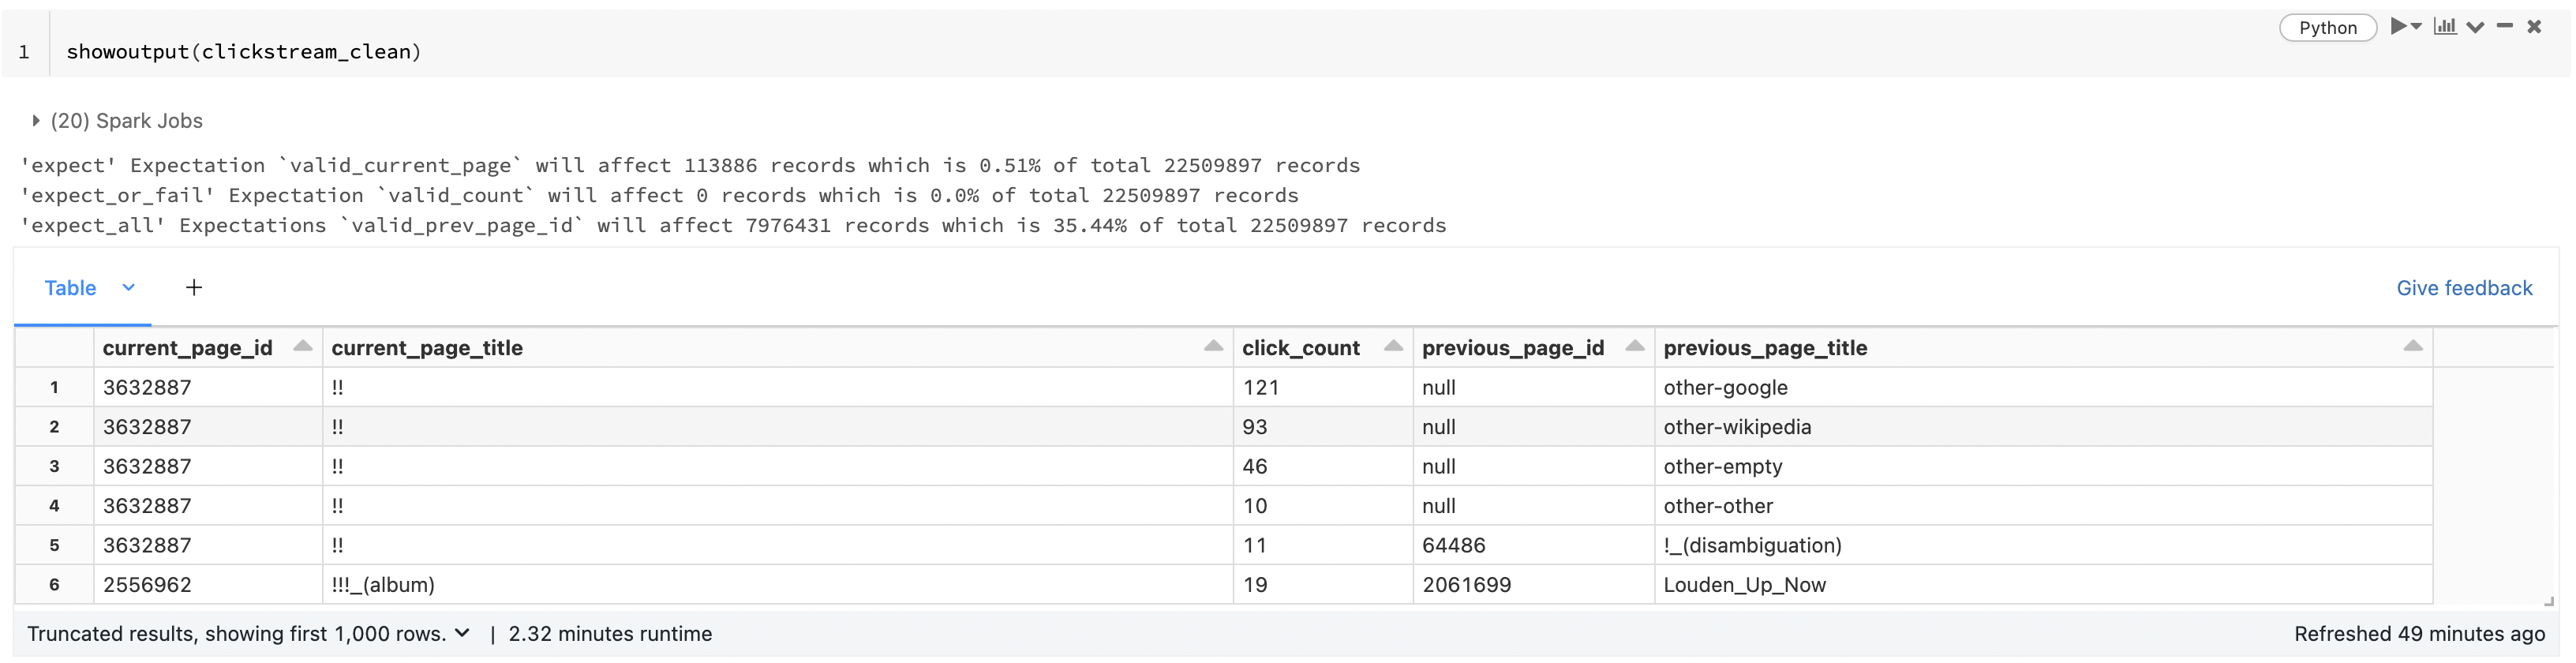
Important to note that here you can see we are also seeing how many records will the expectations affect.
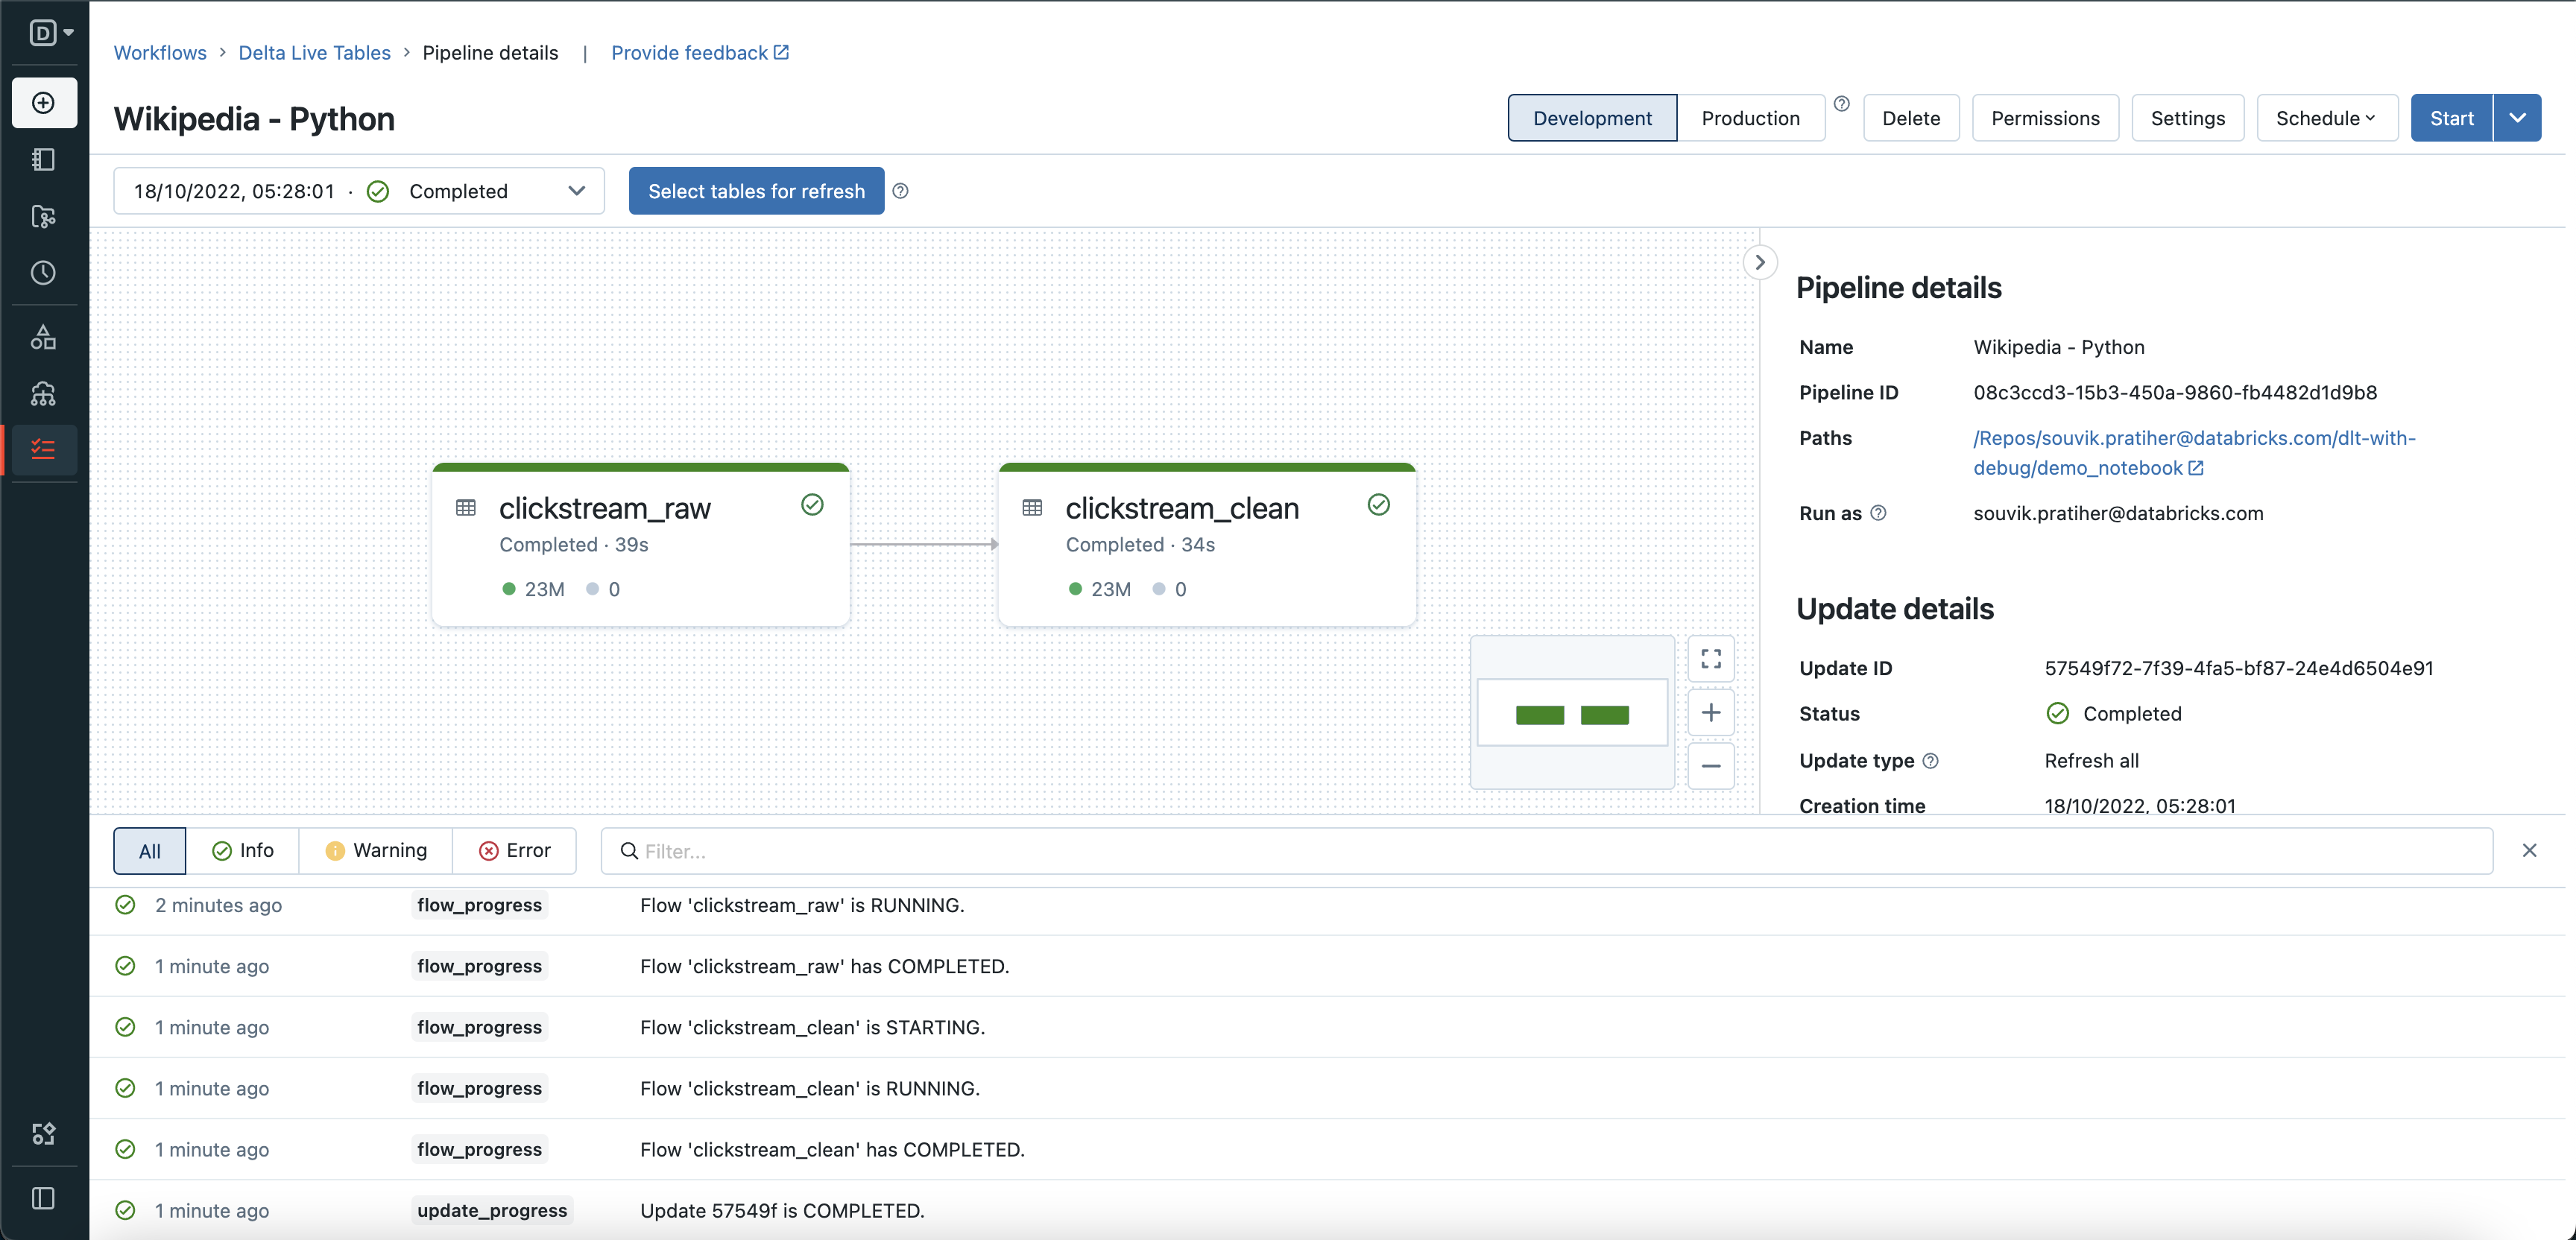
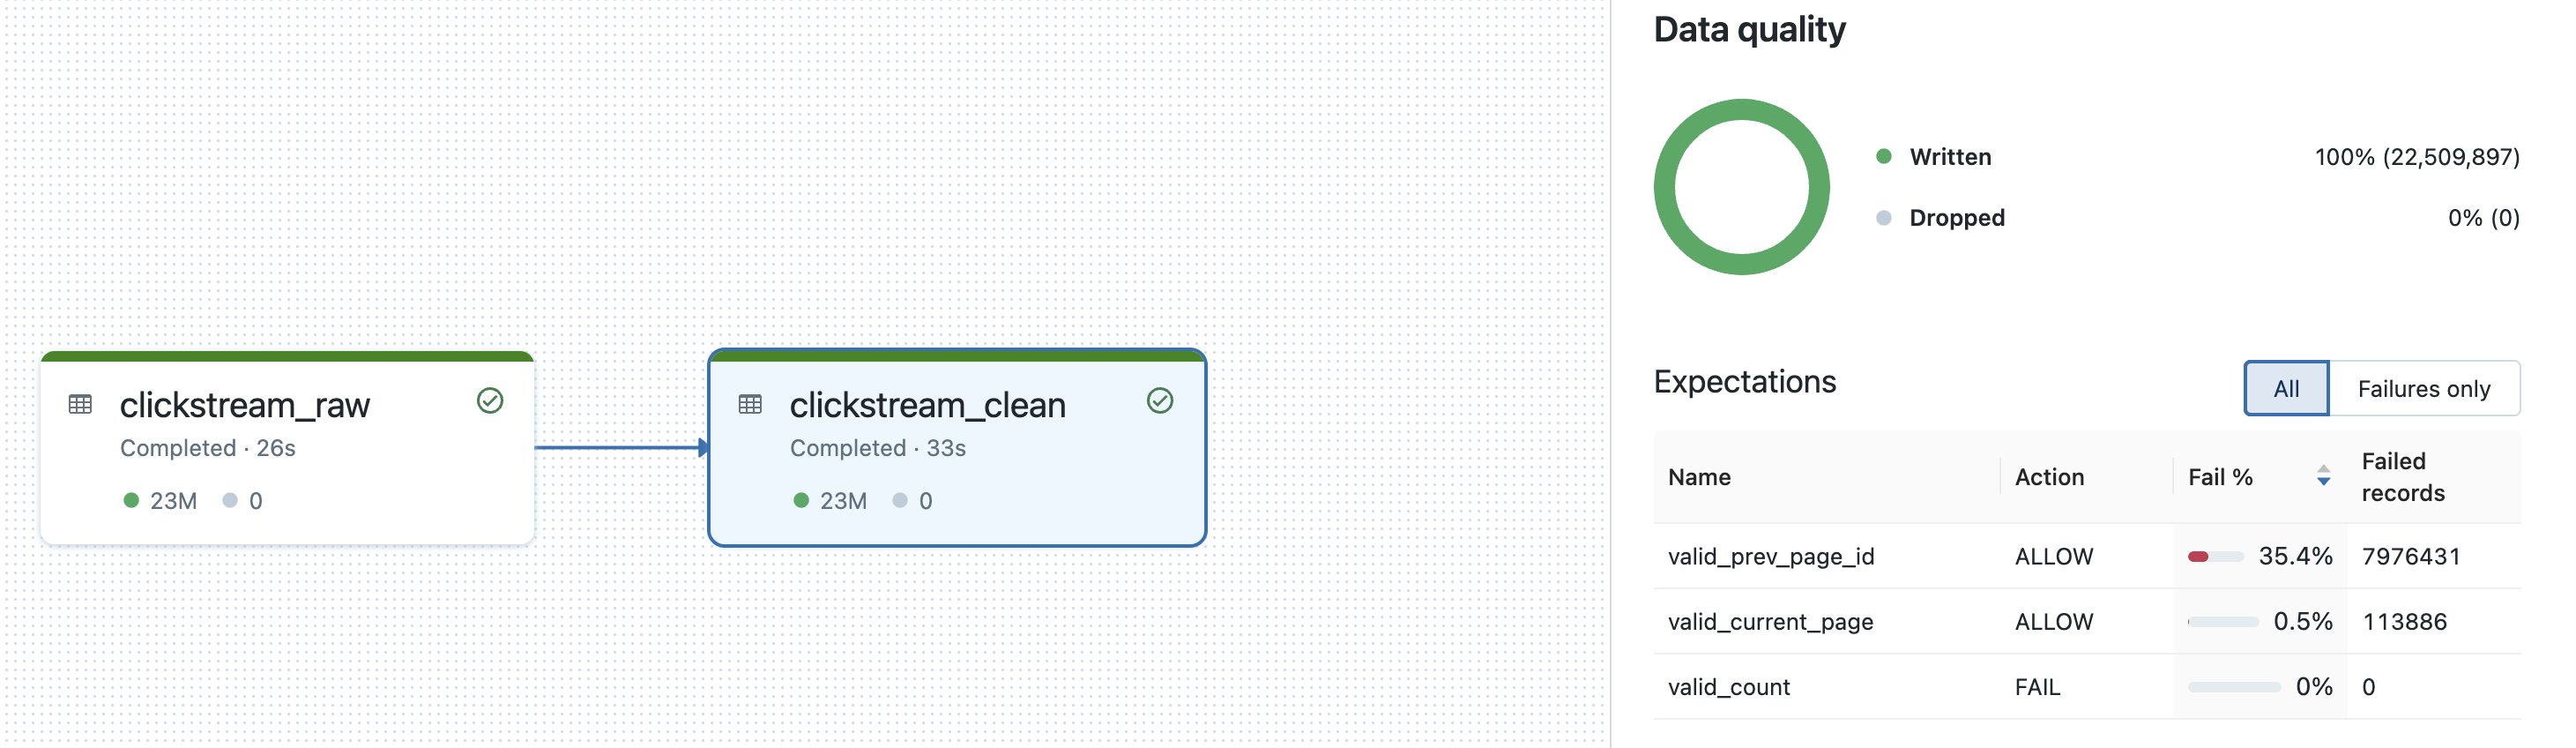
Same sample DLT with debug DLT pipeline executed as part of a delta live table
Below we can the expectation results also match up with the expectation metrics that we got from dltwithdebug earlier with
showoutput(clickstream_clean)
Quick API guide
Table syntax
@dlt.create_table(   # <-- Notice we are using the dlt.create_table() instead of dlt.table()
  name="<name>",
  comment="<comment>",
  spark_conf={"<key>" : "<value", "<key" : "<value>"},
  table_properties={"<key>" : "<value>", "<key>" : "<value>"},
  path="<storage-location-path>",
  partition_cols=["<partition-column>", "<partition-column>"],
  schema="schema-definition",
  temporary=False)
@dlt.expect
@dlt.expect_or_fail
@dlt.expect_or_drop
@dlt.expect_all
@dlt.expect_all_or_drop
@dlt.expect_all_or_fail
@dltwithdebug(globals())    # <-- This dltwithdebug(globals()) needs to be added
def <function-name>():
    return (<query>)
View syntax
@dlt.create_view(    # <-- Notice we are using the dlt.create_view() instead of dlt.view()
  name="<name>",
  comment="<comment>")
@dlt.expect
@dlt.expect_or_fail
@dlt.expect_or_drop
@dlt.expect_all
@dlt.expect_all_or_drop
@dlt.expect_all_or_fail
@dltwithdebug(globals())    # <-- This dltwithdebug(globals()) needs to be added
def <function-name>():
    return (<query>)
Getting results syntax
showoutput(function_name)  # <-- showoutput(function_name)
                           # Notice we are only passing the function name
                           # The name of the function which is wrapped by the dltdecorators

                           # For example:
                           # @dlt.create_table()
                           # @dltwithdebug(globals())
                           # def step_one():
                           #    return spark.read.csv()

                           # showoutput(step_one)
Import syntax
# We are importing
# dltwithdebug as that's the entry point to interactive DLT workflows
# pipeline_id to ensure we import the dlt package based on environment
# showoutput is a helper function for seeing the output result along with expectation metrics if any is specified
from dlt_with_debug import dltwithdebug, pipeline_id, showoutput

if pipeline_id:
  import dlt
else:
  from dlt_with_debug import dlt
Upcoming functionality
As of now the following DLT APIs are covered for interactive use:
-
Currently Available:
dlt.readdlt.read_streamdlt.create_tabledlt.create_viewdlt.table<-- This one sometimes gets overridden withspark.tabledlt.viewdlt.expectdlt.expect_or_faildlt.expect_or_dropdlt.expect_alldlt.expect_all_or_dropdlt.expect_all_or_fail
-
Will be covered in the upcoming release:
dlt.create_target_tabledlt.create_streaming_live_tabledlt.apply_changes
Limitation
DLT with Debug is a fully python based utility and as such it doesn't supports spark.table("LIVE.func_name") syntax.
So instead of spark.table("LIVE.func_name") use dlt.read("func_name") or dlt.read_stream("func_name")
License
Distributed under the MIT License.


Download files
Download the file for your platform. If you're not sure which to choose, learn more about installing packages.
Source Distribution
Built Distribution
Hashes for dlt_with_debug-2.2-py3-none-any.whl
| Algorithm | Hash digest | |
|---|---|---|
| SHA256 | d0709001a38a712382d8fc308c8d8b3fa909a8d3a8bb17c0b062ba4e41d4e590 |
|
| MD5 | 60121524cae6f33bce40103ca9b6cbc8 |
|
| BLAKE2b-256 | ccdc9b8ad59b1caec471993739da546b2b037323789d1e1b962ac0e86c36b9bc |


